4333
A multi-output deep learning algorithm to improve brain lesion segmentation by enhancing the resistance of variabilities in tissue contrast1Neuroscience Research Center, Taipei Medical University, Taipei, Taiwan, 2Translational Imaging Research Center, Taipei Medical University Hospital, Taipei, Taiwan, 3Graduate Institute of Biomedical Electronics and Bioinformatics, National Taiwan University, Taipei, Taiwan, 4Department of Medical Imaging, Taipei Medical University - Shuang Ho Hospital, New Taipei, Taiwan
Synopsis
We propose a multi-output segmentation approach, which incorporates other non-lesion brain tissue maps into the additional output layers to force the model to learn more about the lesion and tissue characteristics. We construct a cross-vendor study by training the white matter hyperintensities segmentation model on cases collected from one vendor and testing the model performance on eight different data sets. The model performance can be significantly improved, especially in testing sets which shows low image contrast similarity with training data, suggesting the feasibility of incorporating the non-lesion characteristics into segmentation model to enhance the resistance of cross-vendor image contrast variabilities.
Introduction
Deep learning-based automatic segmentation techniques for brain lesion segmentation have been widely established, however, with varying generalization performance on different MRI vendor, which depends on the different image intensities and contrasts. It has always been a critical issue to enhance the model resistance to these cross-vendor variabilities to maintain the model performance under different MRI acquisition parameters. We proposed to use multi-output segmentation approach which incorporates intensity information of each brain tissue type to achieve a higher cross-vendor model performance. Here, we used cases collected from one MRI scanner for model training, and tested the model performance on independent dataset. We hypothesized that 1) the model performance is closely related to the image contrast similarity between training and testing set; 2) the multi-class segmentation approach can be more resilient to the varying MR image acquisition parameters than the widely used single-label segmentation approach, and can achieve better model performance.Methods
We recruited patients who are referred to Shuang Ho Hospital (SHH), Taipei Medical University Hospital (TMUH), and Wang-Fang Hospital (WFH) with suspicion for appearance of WMHs during the past 5 years (Table 1). The MICCAI WMH segmentation challenge training dataset (MWSC (1); http://wmh.isi.uu.nl/) was also treated as the testing set in this study. Before supplying the data to the auto-segmentation model, the T2-FLAIR images from all subjects were first segmented by a unified algorithm that included bias field correction, tissue classification, and registration using SPM12 software (Wellcome Department, University College London, UK) to generate the probability maps of each non-lesion brain tissue (gray matter [GM], white matter [WM], and cerebrospinal fluid [CSF]) as well as the non-brain tissue area (skull and scalp). Then, the axial slices of T2-FLAIR volumes were automatically resampled to 512×512, to guarantee a uniform size for input to the neural network. Gaussian normalization was further employed to normalize the brain voxel intensity distributions for each axial slice. Then, the image intensity distribution of WMH and other non-lesion tissue types in the training set and each testing set were computed to quantify the degrees of voxel intensity overlap between WMH and other non-lesion brain tissues as well as the image contrast similarity between the training set and each testing set. The segmentation model architecture was constructed, which contained one output layer for single-label segmentation and 6 output layers (Figure 1A), including WMH, GM, WM, CSF, skull/scalp, and air, for multi-class segmentation, respectively. To further investigate the possible model performance improved by the adjustment of the common variant model architectures, three types of architectures (Figure 1B), including U-Net (2), SegNet (3), and U-SegNet (4), a hybrid approach of the above two model structures, were built and combined with single or multiple output segmentation, respectively.Results & DIscussions
The three kinds of multi-output architectures can achieve better model performance (Table 2), then the single-output model structures among all testing set, especially in the external testing sets. It can be found that the prediction results of the single-label segmentation models can cause false positives mainly distributed at GM regions (Figure 2; yellow arrows) and false negatives near the GM regions (Figure 2; red arrows). Among the 8 testing sets used in this study, the voxel intensity distributions of WMH and GM in different data sets showed varying overlap ratios (Figure 3A-H) which correlated significantly with the model sensitivity in both multi-class (R2=0.4719, p=0.0001) and single-label architectures (R2=0.5134, p<0.0001), suggesting that the less similar the voxel intensity between GM and WMH can lead to better model performance regardless of the model structure (Figure 3I). Then, we extracted the voxel intensity distributions of GM, WM and WMH in all testing sets and compared them with the distribution in the training set (Figure 4A-C). The 8 testing sets used in the study can be further divided into 3 high similarity testing sets and 5 low similarity testing sets based on the cosine similarity of histograms with the training set. In the low similarity testing sets, the multi-class segmentation approaches showed significantly superior dice coefficient (Figure 4D; right), precision (Figure 4E; right), sensitivity (Figure 4F; right) and specificity (Figure 4G; right) compared with single-label methods, which supported our hypothesis that the multi-output algorithms can enhance the resistance of image contrast variabilities in MRI data from different hospital and/or MR vendors.Conclusion
In this cross-hospital and cross-vendor study (Table 1), we systematically delineated and quantified the image contrast between WMH lesions and other non-lesion tissue types among the training and all testing sets using the intersection of image intensity distributions of these tissues. The MR image from different hospital/vendor can show varying MR image contrast (Figure 3), which in turn may affect the model performance. The multi-class segmentation approaches showed significantly better model performance at the low similarity testing sets compared with the single-label segmentation methods (Figure 4D-G), supporting that the multi-output algorithms can enhance the resistance of image contrast variabilities in MRI data from different hospital and/or MR vendors. Our study characterizes the effects of varying MR image contrast on model performance and generalizability, and further signifies the advantage of multi-output models that combined the lesion labels with other non-lesion tissue labels for brain lesion segmentation tasks.Acknowledgements
This work was partially supported by the Ministry of Science and Technology, Taiwan (MOST110–2314–B–038–086–MY3) and Taipei Medical University, Taiwan (TMU109-AE1-B18).References
1. Kuijf HJ, et al. (2019) Standardized assessment of automatic segmentation of white matter hyperintensities and results of the WMH segmentation challenge. IEEE transactions on medical imaging 38(11):2556-2568.
2. Ronneberger O, Fischer P, & Brox T (2015) U-net: Convolutional networks for biomedical image segmentation. International Conference on Medical image computing and computer-assisted intervention, (Springer), pp 234-241.
3. Badrinarayanan V, Kendall A, Cipolla RJItopa, & intelligence m (2017) Segnet: A deep convolutional encoder-decoder architecture for image segmentation. 39(12):2481-2495.
4. Kumar P, Nagar P, Arora C, & Gupta A (2018) U-SegNet: fully convolutional neural network based automated brain tissue segmentation tool. 2018 25th IEEE International Conference on Image Processing (ICIP), (IEEE), pp 3503-3507.
Figures

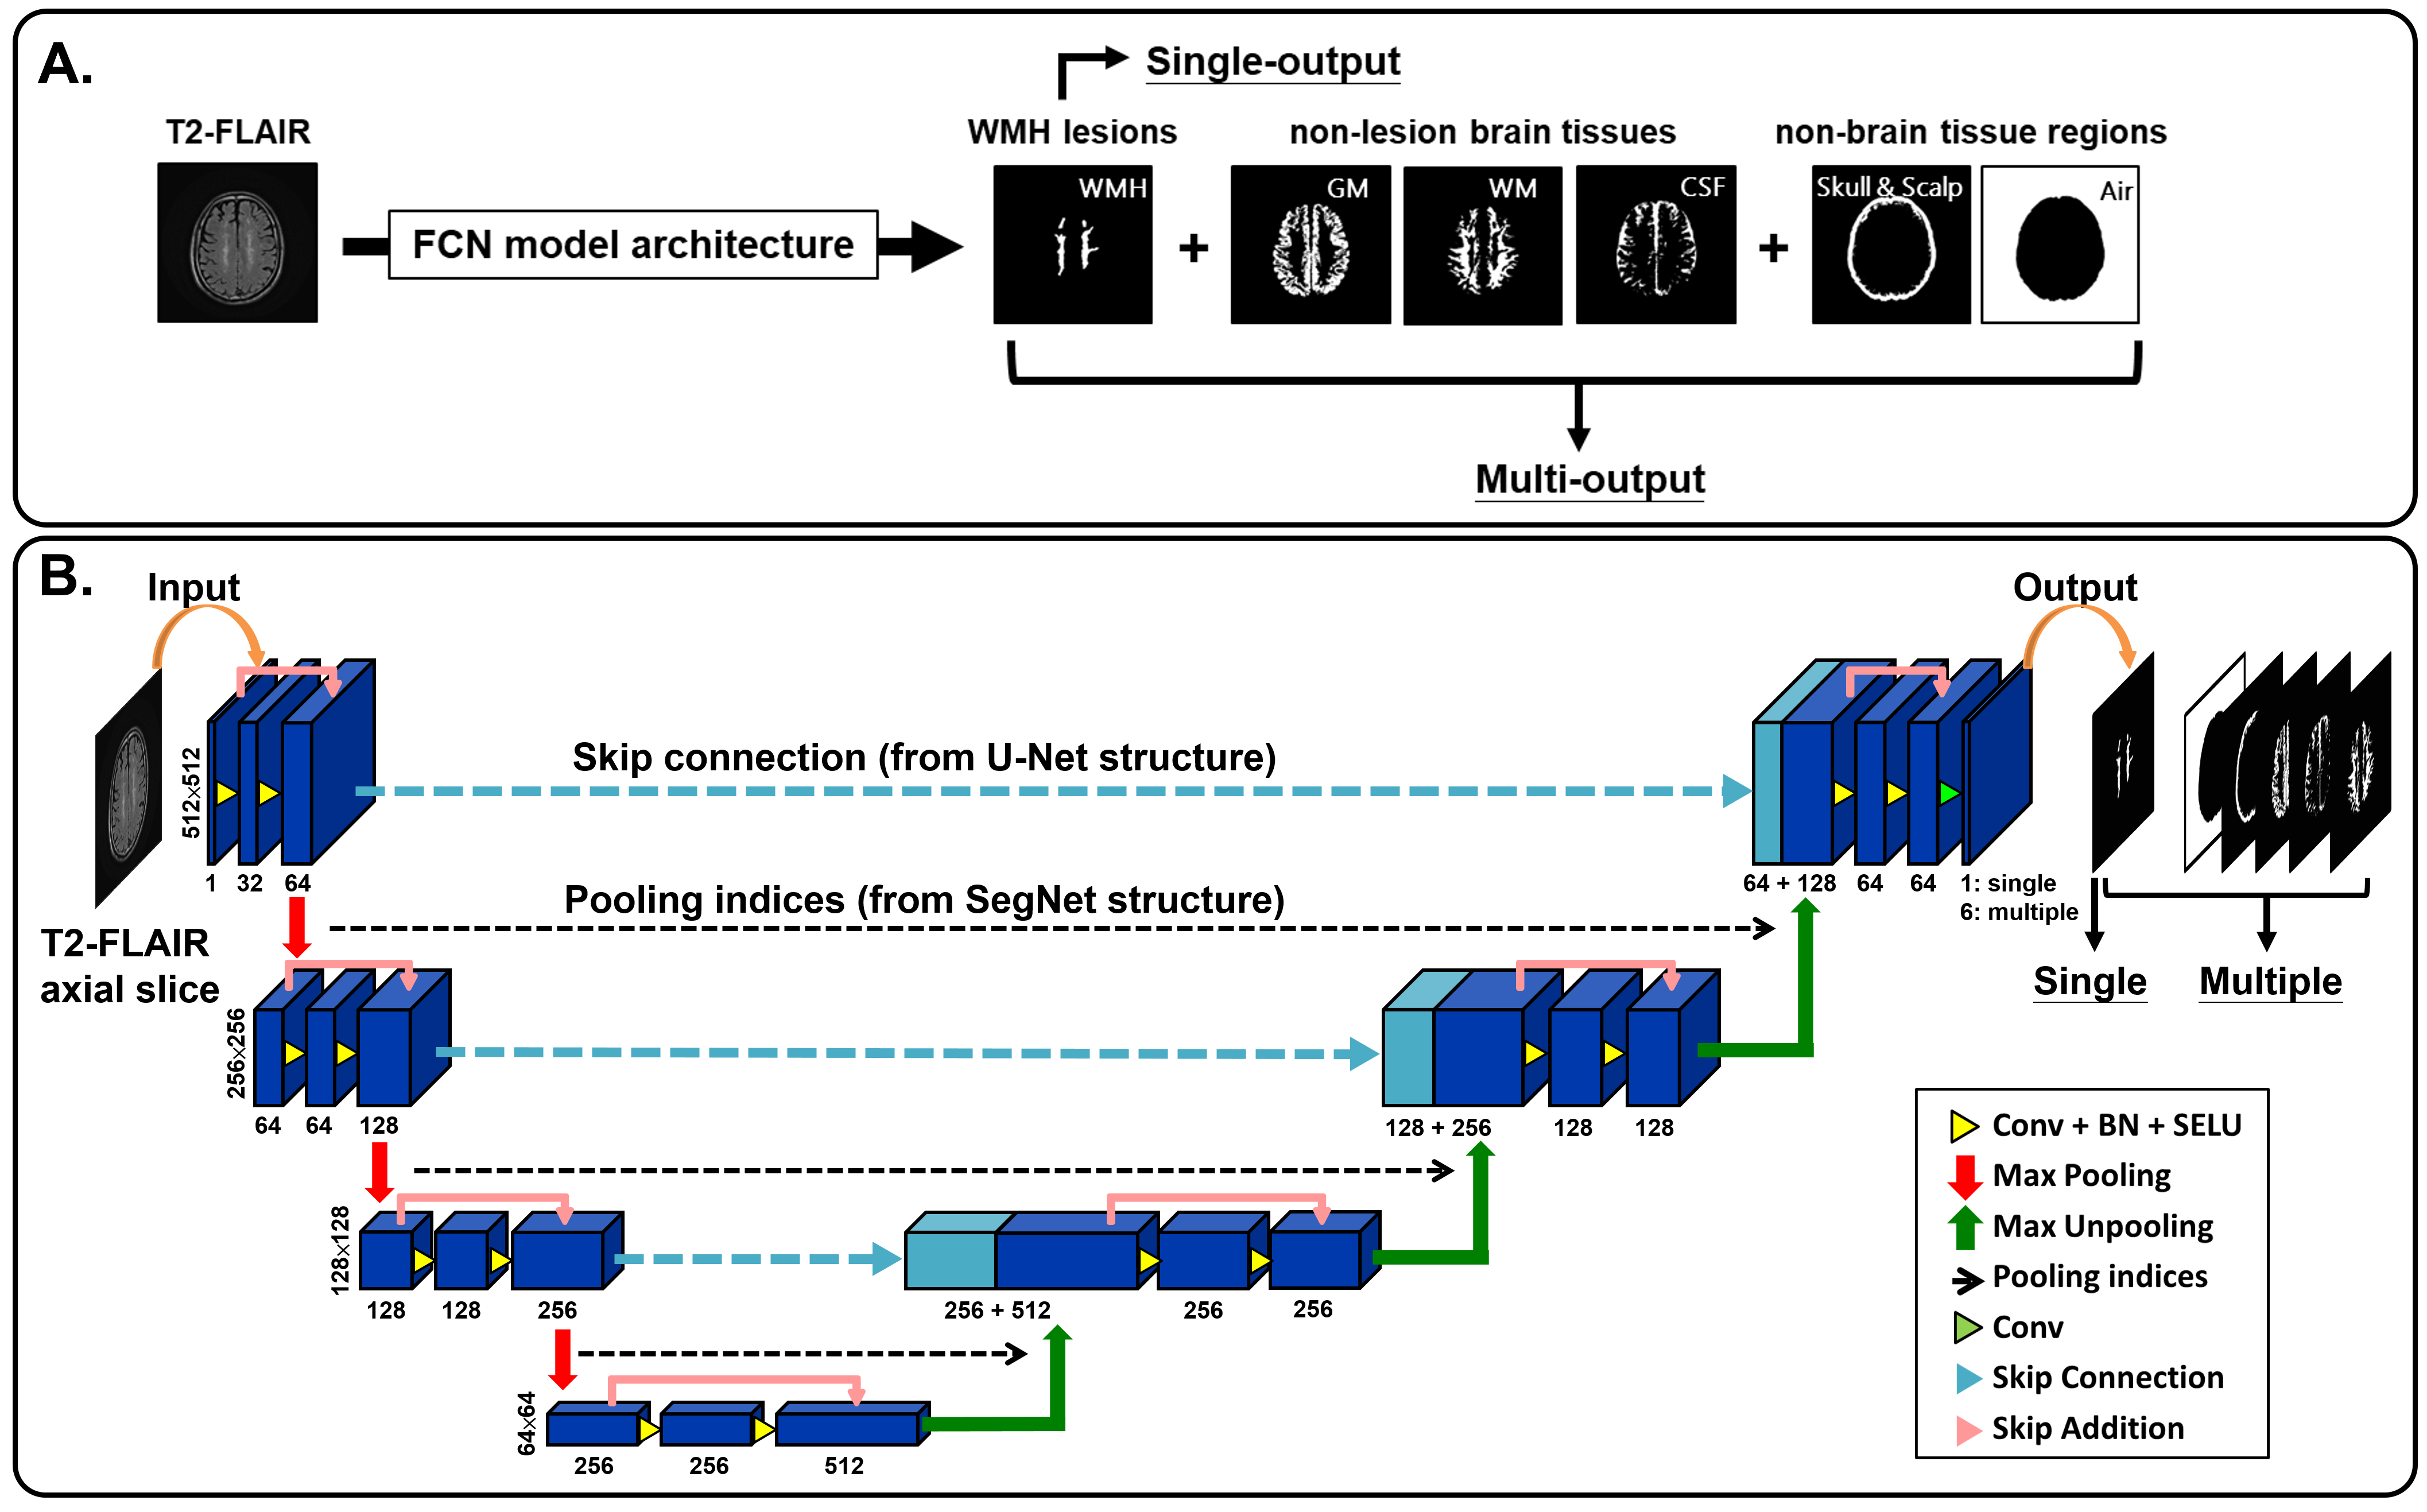
Figure 1. Network architectures
The T2-FLAIR axial slices are fed into the FCN architectures, which consists of a down-convolutional part that shrinks the spatial dimensions (encoding part), and up-convolutional part that expands the feature maps (decoding part). At the output layer, a 1×1 convolution is used to map each feature vector to 6 classes (WMH, WM, GM, CSF, scalp and skull, and air) for multi-class segmentation or one WMH lesion label for single-label segmentation.

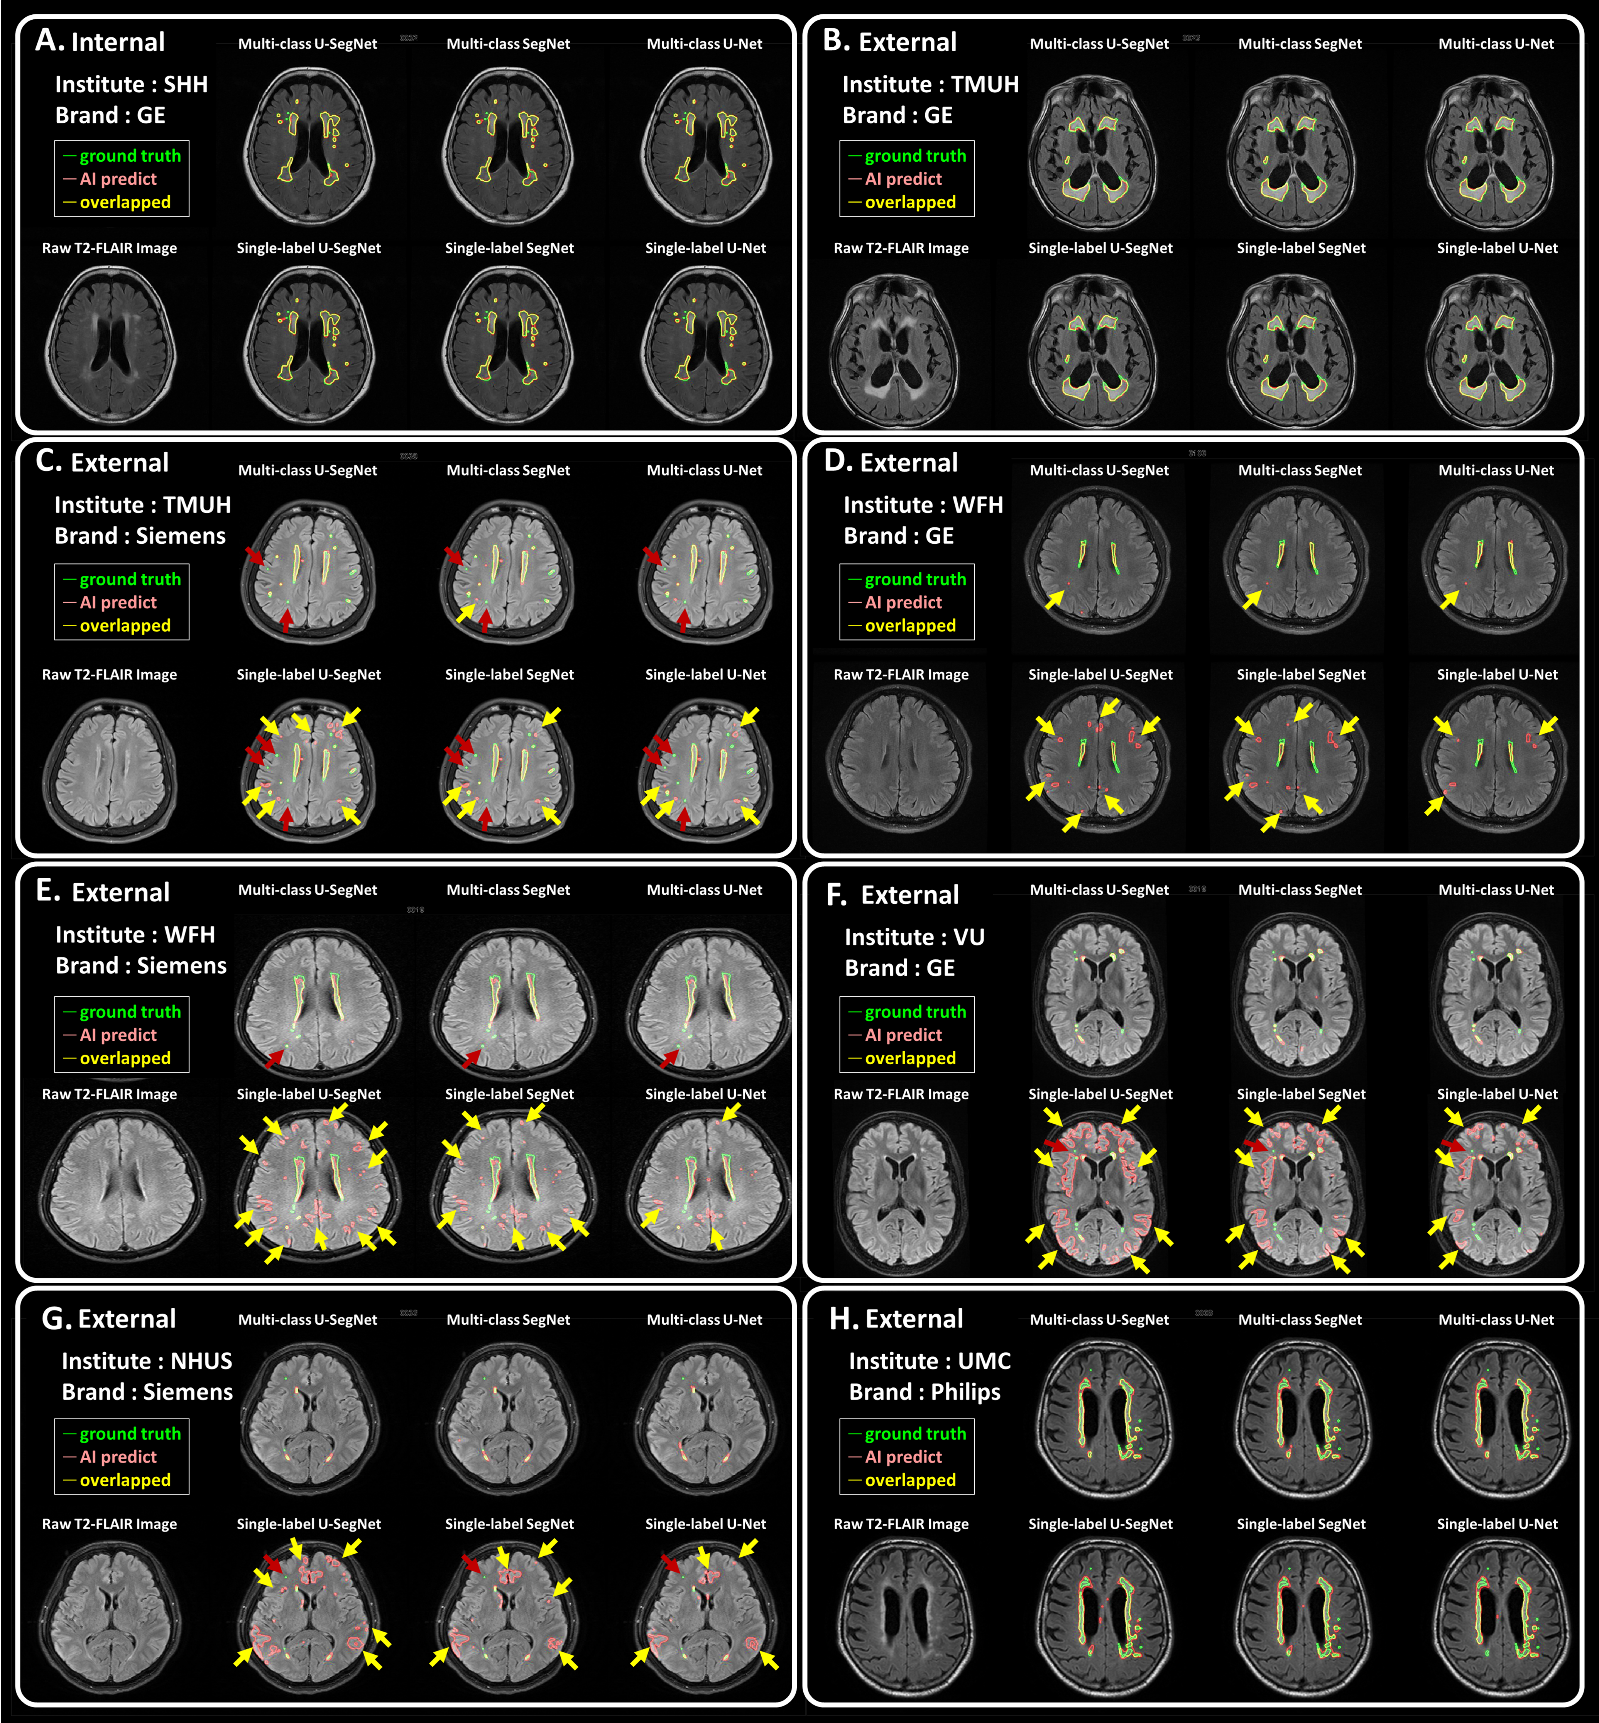
Figure 2. T2-FLAIR raw images and the segmentation results
Each panel shows an example axial slice and the prediction results from different model structures in the corresponding test set, respectively. Green line: the lesions marked by the physicians as the ground truth. Pink line: the lesion area segmented by the corresponding deep learning algorithm.Yellow line: the overlapped contour of the ground truth and model predicted lesions. The yellow arrows point out the false positives. The red arrows point out the false negatives.
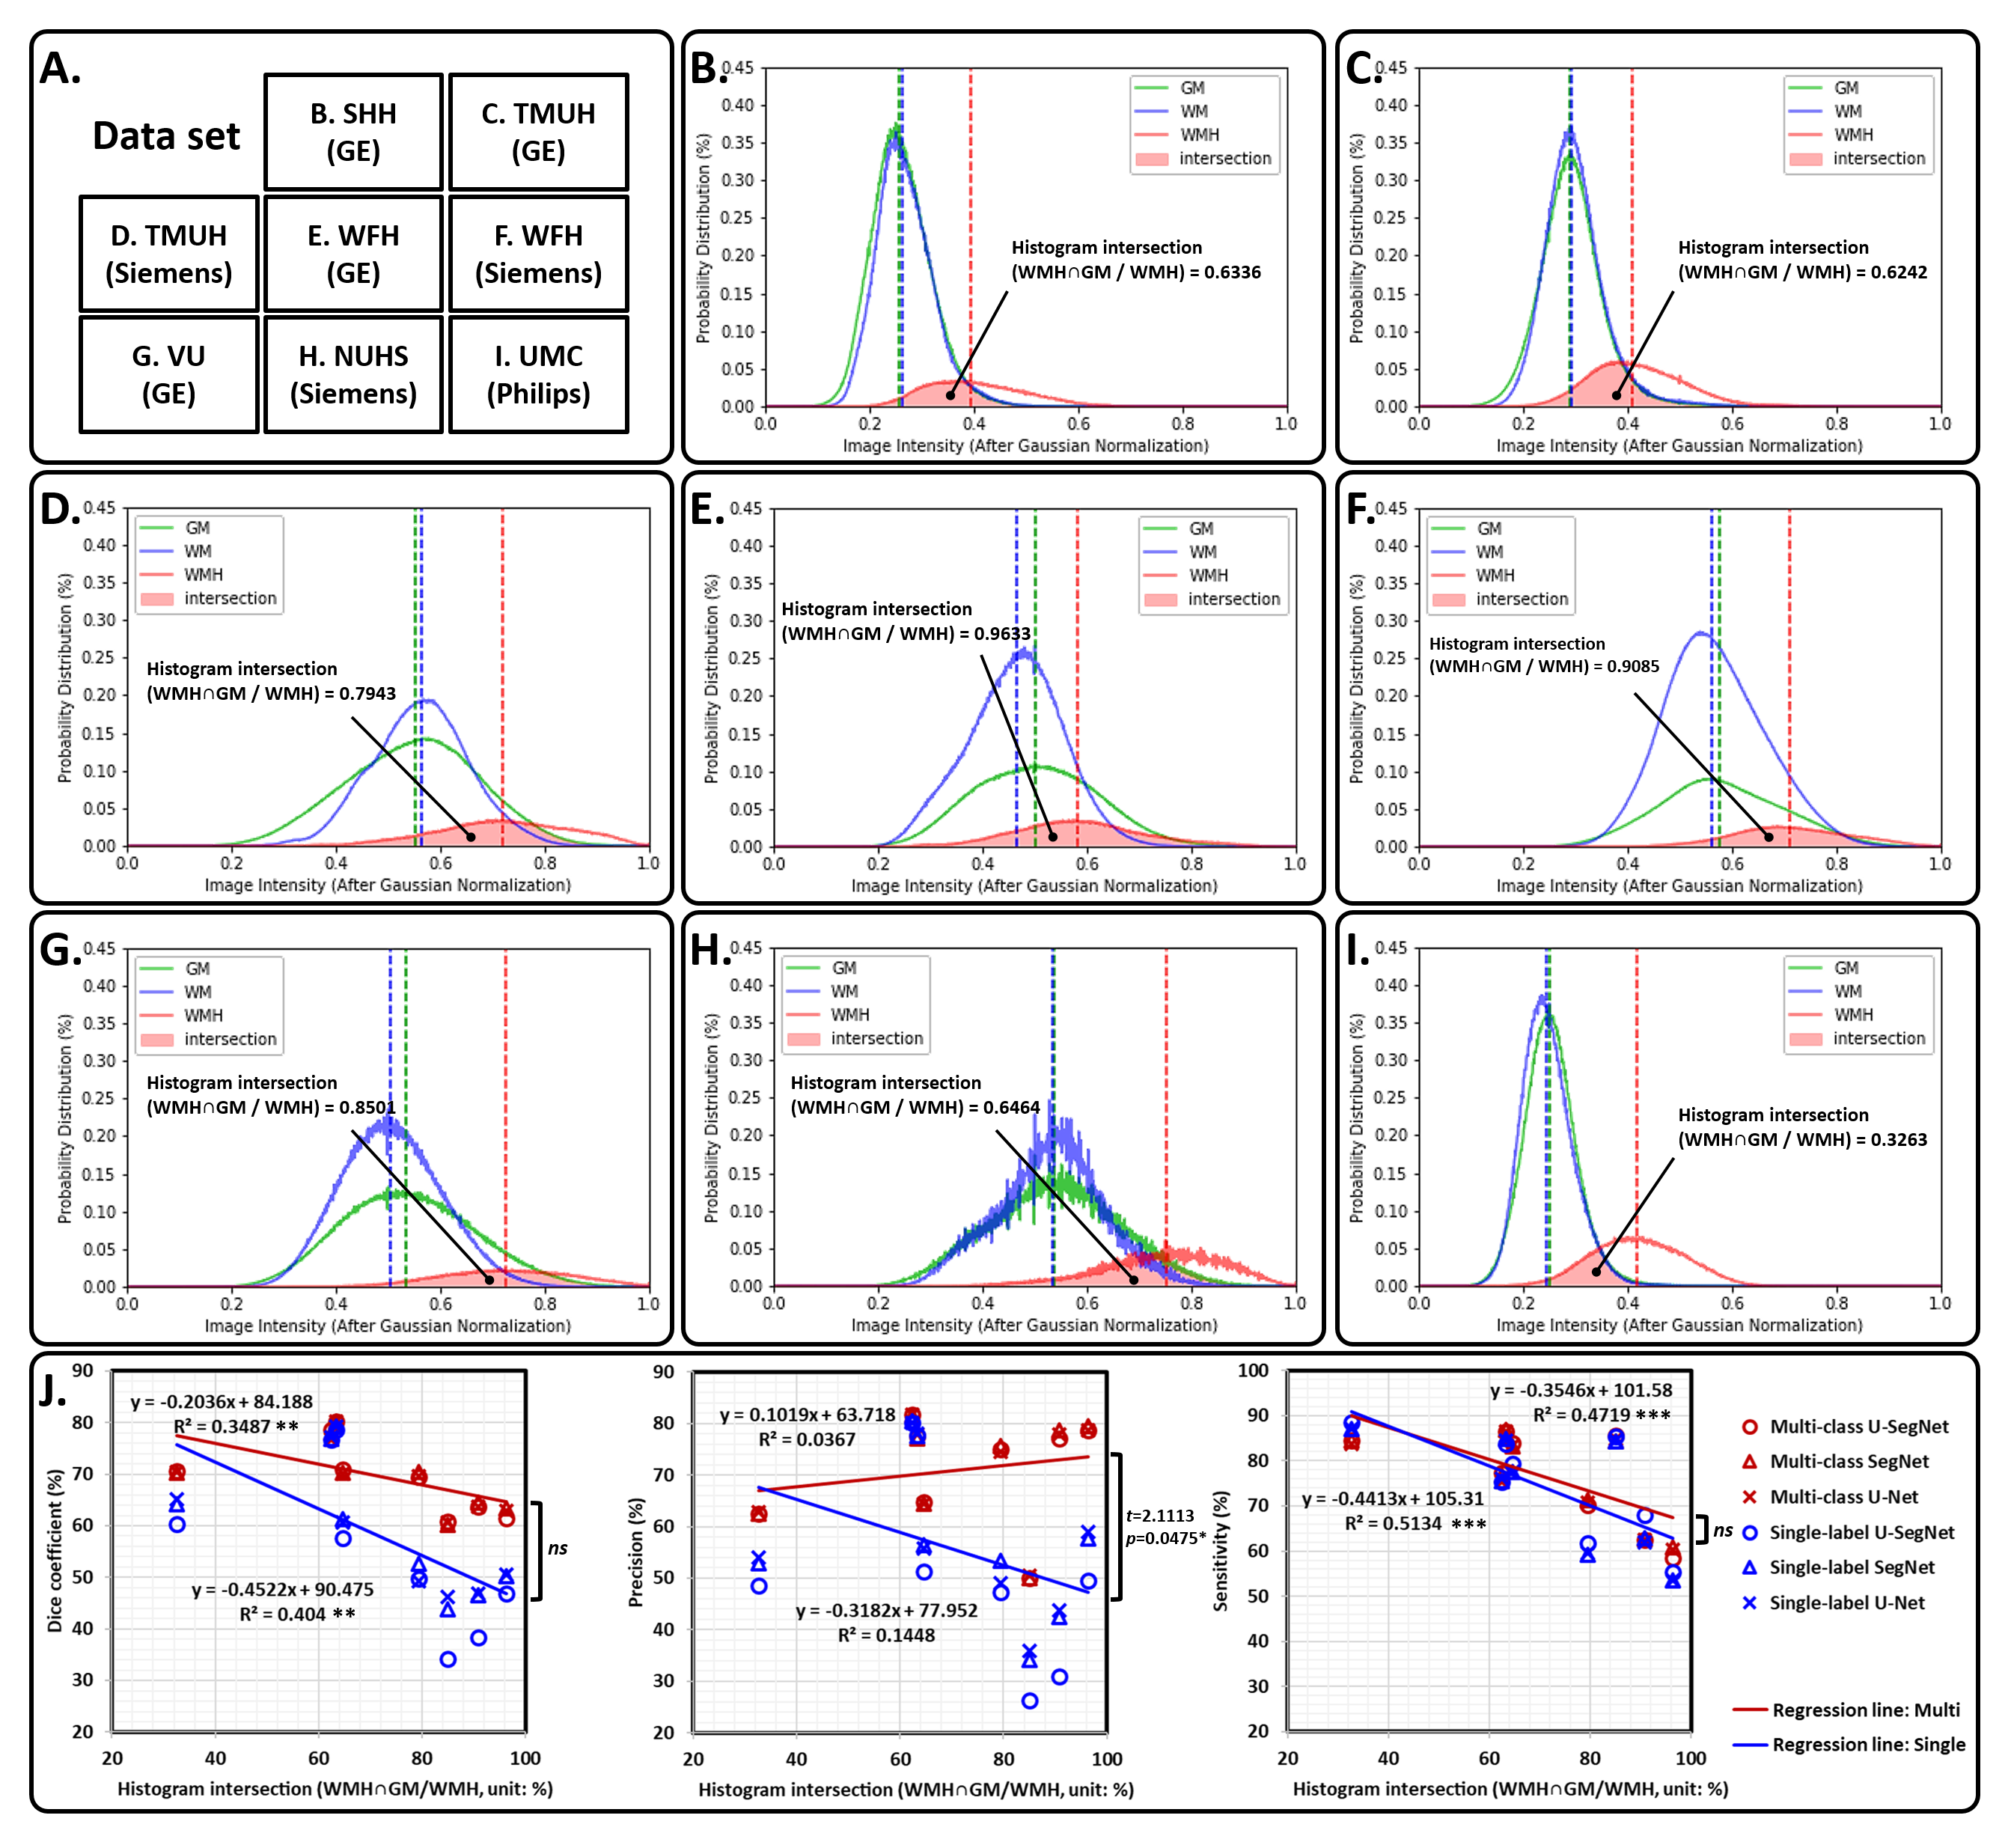
Figure 3. The image intensity distribution in each testing sets
For panel (A) to (H), the solid curve represents the image intensity distribution of each brain tissue type, such as GM (green), WM (blue), and WMH (red), in the different testing set. The area filled with transparent red represents the histogram intersection between WMH and GM. In panel (I), the histogram intersections between WMH and GM show significant negative correlation with model sensitivity in both multi-class (R2 = 0.4719, p = 0.0001) and single-label (R2 = 0.5134, p < 0.0001).
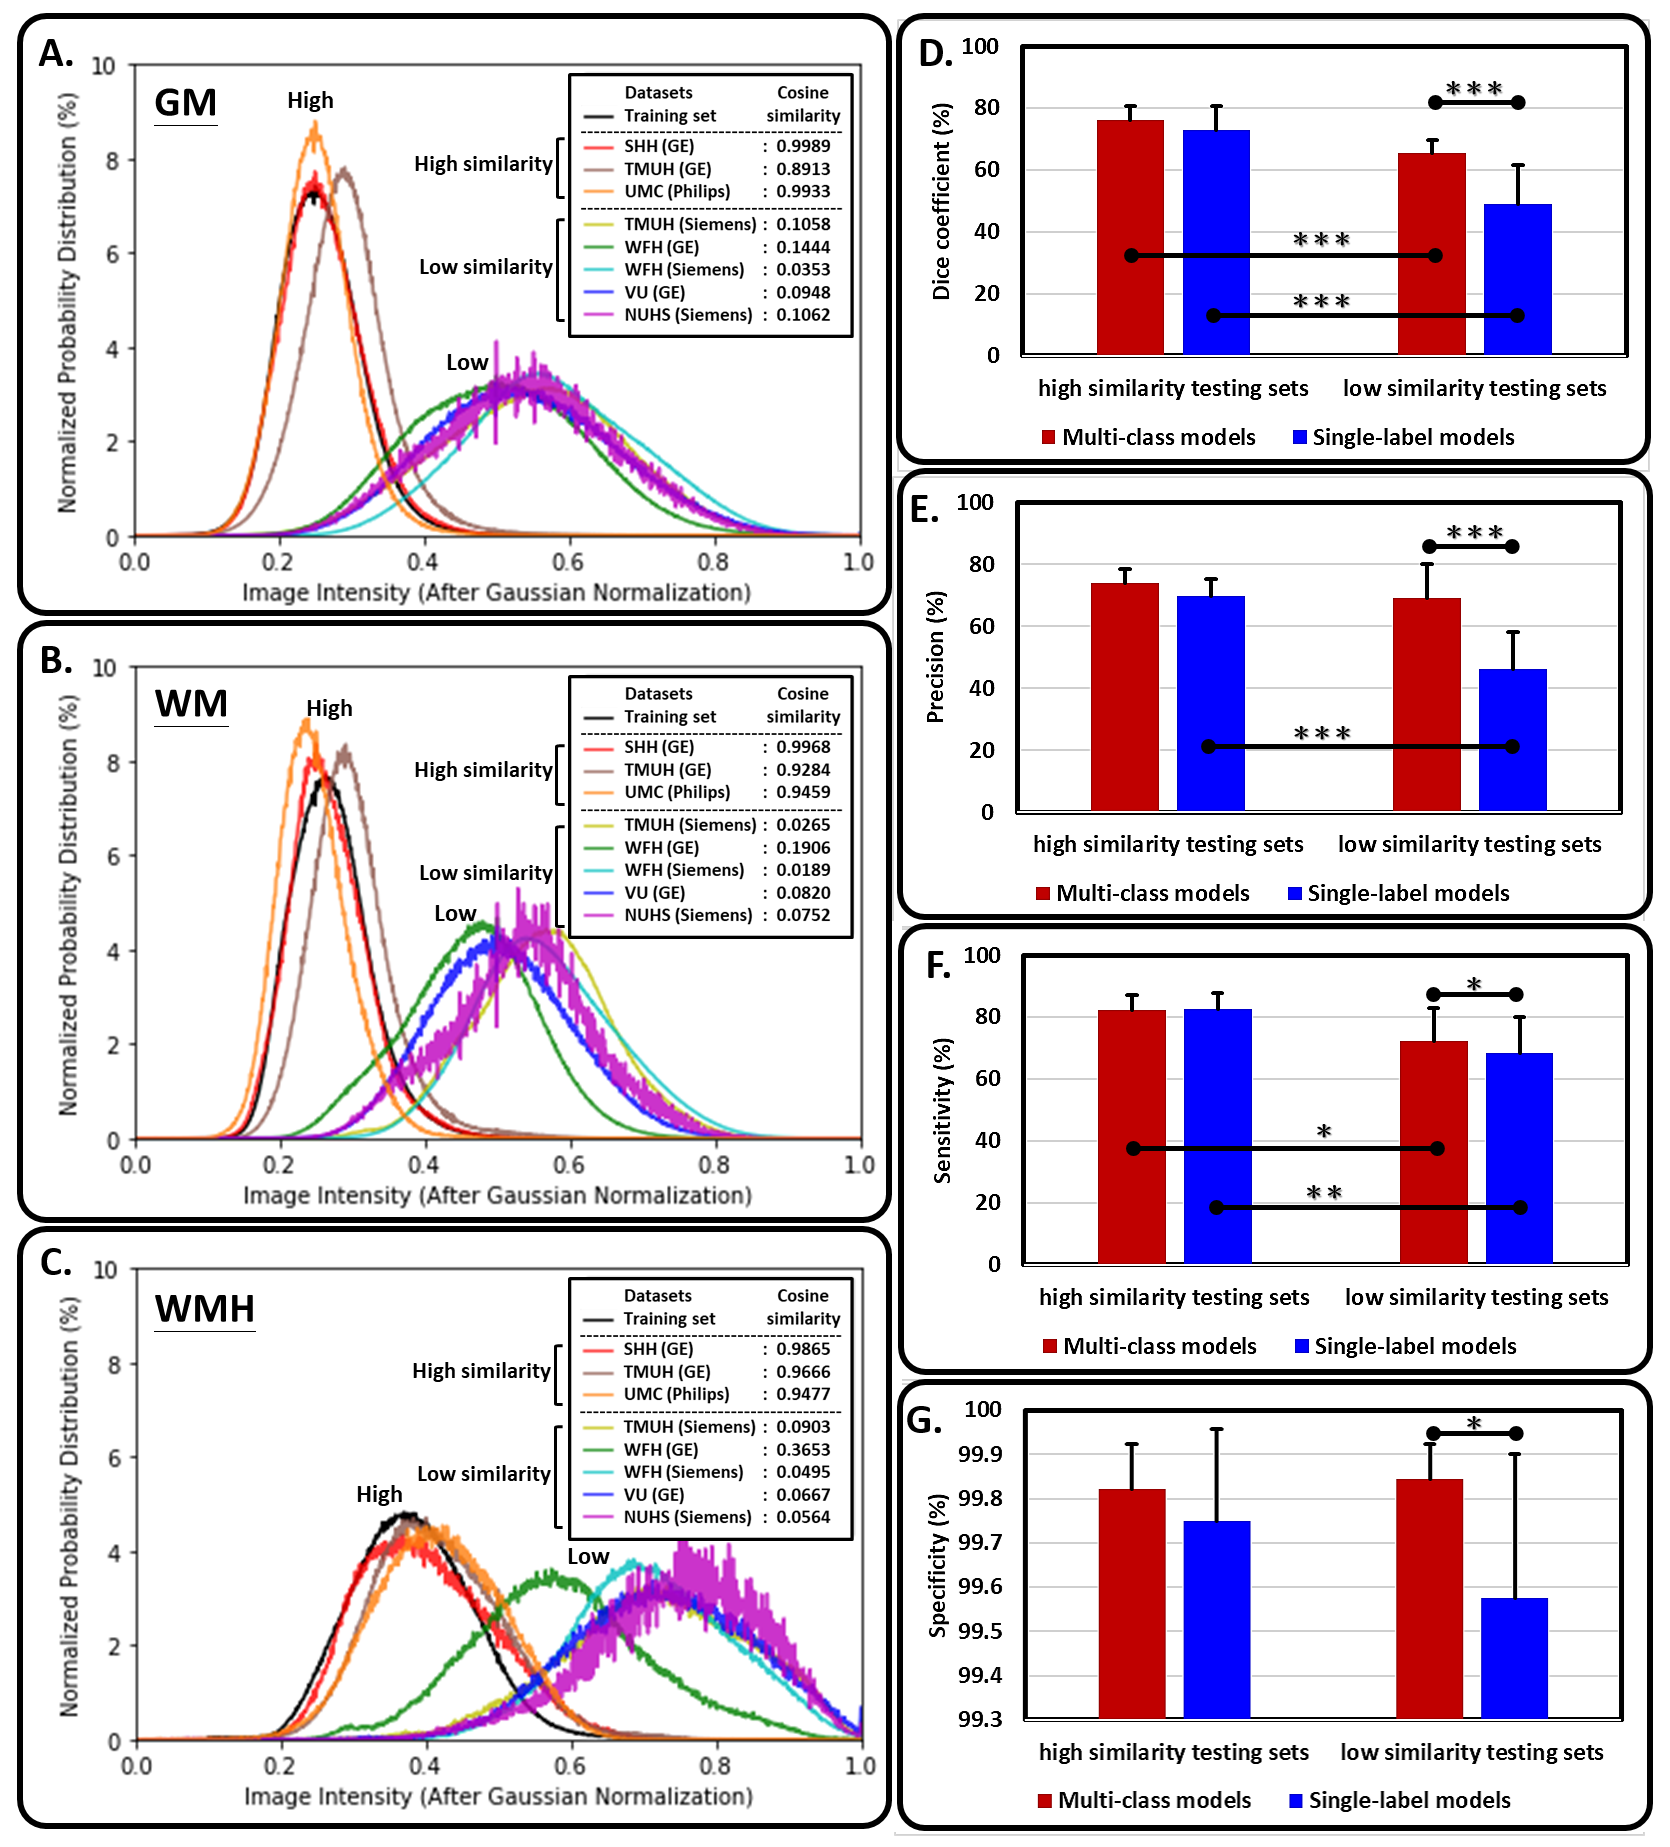
Figure 4. The image contrast similarity between training set and each testing set, and its relationship with the model performance.
The probability distributions of (A) GM, (B) WM, and (C) WMH in training set and all testing sets. The single- (blue bars) and multi-output (red bars) model performance, including (D) dice coefficient, (E) precision, (F) sensitivity, and (G) specificity, in the high and low similarity testing sets.