4327
Comparison of the image quality and ADC values on diffusion weighted imaging at both low and high b-values with gadoxetic acid-enhanced MR imaging1Radiology, West China Hospital, Sichuan University, Cheng Du, China, 2GE Healthcare Beijing China, Beijing, China, 3West China Hospital, Sichuan University, Cheng Du, China
Synopsis
Gd-EOB-DTPA has been widely used in liver MR imaging for the evaluation of hepatic lesion, whereas, the long intervals between the dynamic enhanced imaging and hepatobiliary phase imaging usually influence patient throughput. Notably, the adjustment of diffusion weighted imaging (DWI) sequence’s scanning order from pre-contrast to post-contrast is crucial to overcome this limitation. However, few studies have investigated the apparent diffusion coefficient (ADC) values that at low and high b values should be affected, respectively, thus, we aimed to prospectively determine whether DWI at both low and high b-values should be affected before and after gadoxetic acid-enhanced MR imaging.
Introduction
Liver cancer is the second most frequency cause of cancer-related deaths of men worldwide1,2. At present, Gd-EOB-DTPA has been widely used in liver MR imaging which enables not only the traditional arterial phase imaging of hepatic lesions but further provide the specific hepatobiliary phase. However, the hepatobiliary phase can be obtained about 20 minutes delay after the contrast agent injection, and patient throughput will be influenced if no sequences were scanned during the long period time. Evidence has shown that the adjustment of diffusion weighted imaging (DWI) sequence’s scanning order from pre-contrast to post-contrast may help to overcome this limitation3-5, they found that the acquisition and optimization of DWI during the interval between dynamic MRI and hepatobiliary imaging can be effective and time-saving without compromising contrast-to-noise ration (CNR) and apparent diffusion coefficient (ADC) values of focal hepatic lesions5. However, most of these reports just explored the fitting ADC values of both low and high b valve DWI, and few studies have investigated the ADC values that at low and high b values should be affected, respectively. Therefore, the purpose of this paper was to determine whether the DWI at both low and high b-values should be affected before and after Gd-EOB-DTPA enhancement.Methods
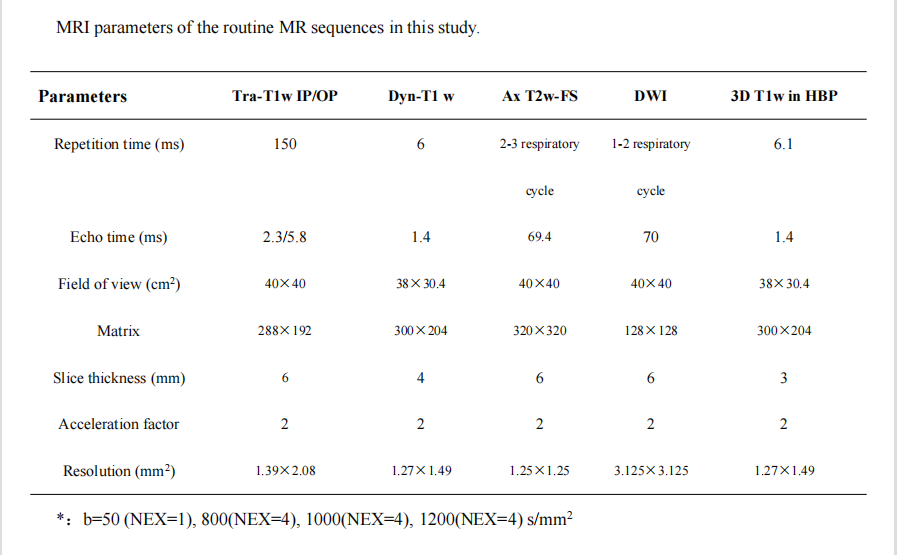
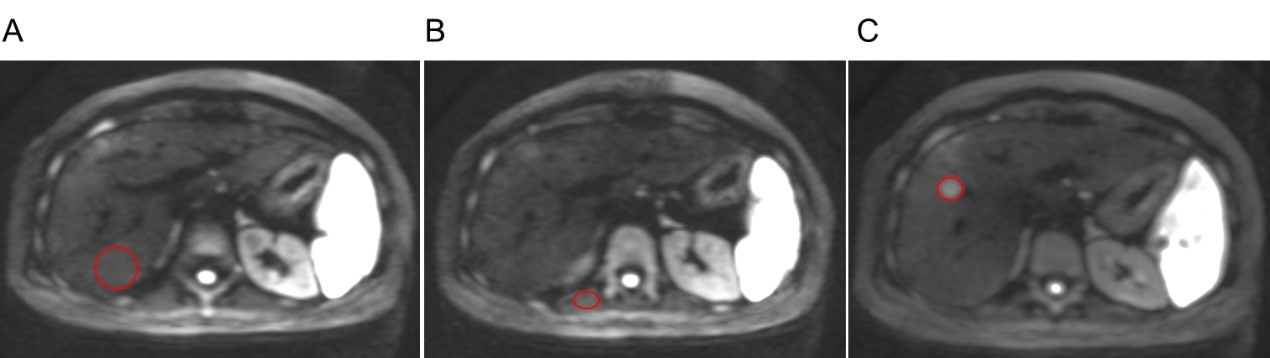
This prospective study was approved by the institutional review board, and written informed consent was obtained from all patients. From July to November 2019, prospectively acquired data of 73 patients with 97 focal hepatic lesions underwent gadoxetic acid-enhanced MR imaging were included. MR imaging was carried out by using a 3.0 T MR system (Discovery MR 750w, GE Healthcare, Milwaukee, USA). Routine liver MRI protocols include: T1-weighted imaging using in-phase and out-of-phase spoiled gradient echo (SPGR), dynamic T1-weighted imaging using 3-dimentional (3D) liver imaging with volume acceleration-flexible (LAVA-FLEX), T2-weighted imaging using fast spin echo (FSE) with PROPELLER technique and chemical-shift fat saturation, single-shot-fast-spin-echo with echo-planner-imaging (SSFSE-EPI) DWI with respiratory trigger (RT) and multi-b-value (b=0, 50, 800, 1000 and 1200 s/mm2), 3D T1WI LAVA-FLEX in hepatobiliary phase (HBP) were performed before and after injecting gadoxetic acid. Detailed information of the MR parameters was shown in Figure 1. All the patients underwent with multi-b-value DWI before and after contrast agent. The drawing methods of region of interests (ROIs) were shown in Figure 2. Two abdominal radiologists reviewed all MR images, and the contrast intensity ratio (CIR) value and ADC values at each value were calculated. The CIR of lesions at each b value images were calculated from the signal intensity (SI) by using the following equation: CIR= (SI(lesion) - SI(liver))/SI(muscle)4: Mann-Whitney U test was used to compare the CIR and ADC values of each group and the receiver operating characteristics (ROC) curves was used to determine the diagnostic performance.Results
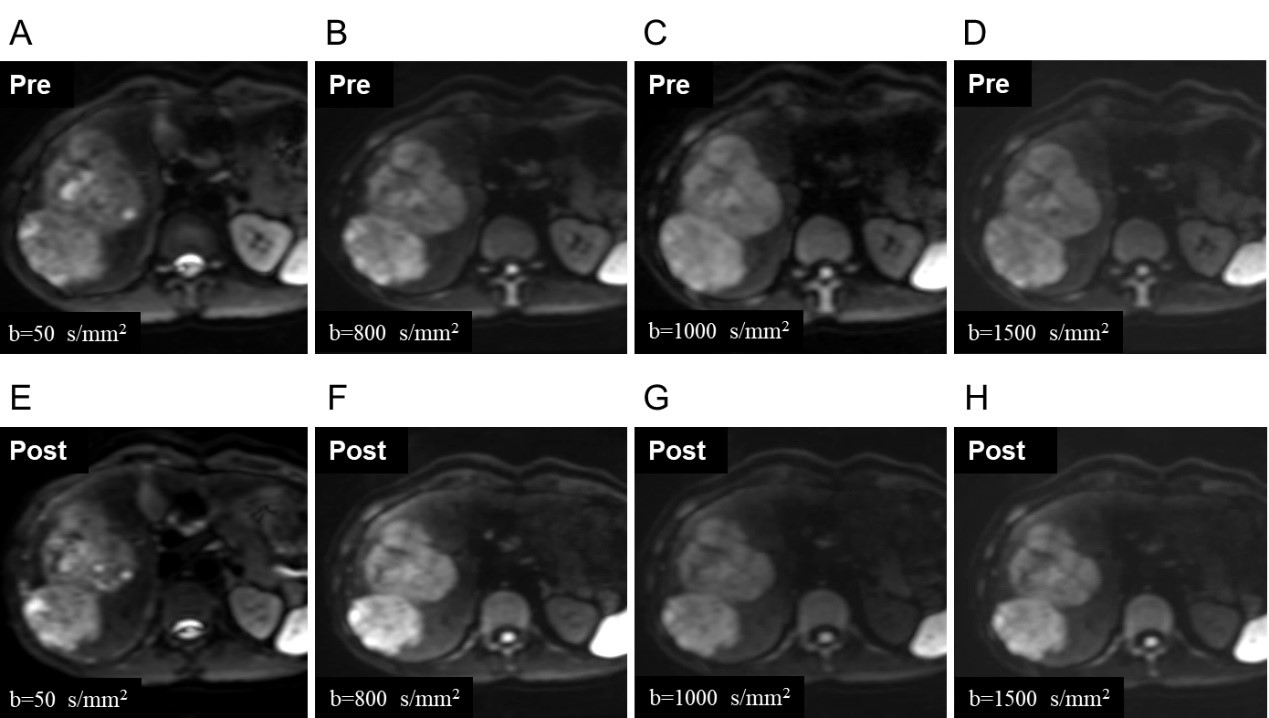
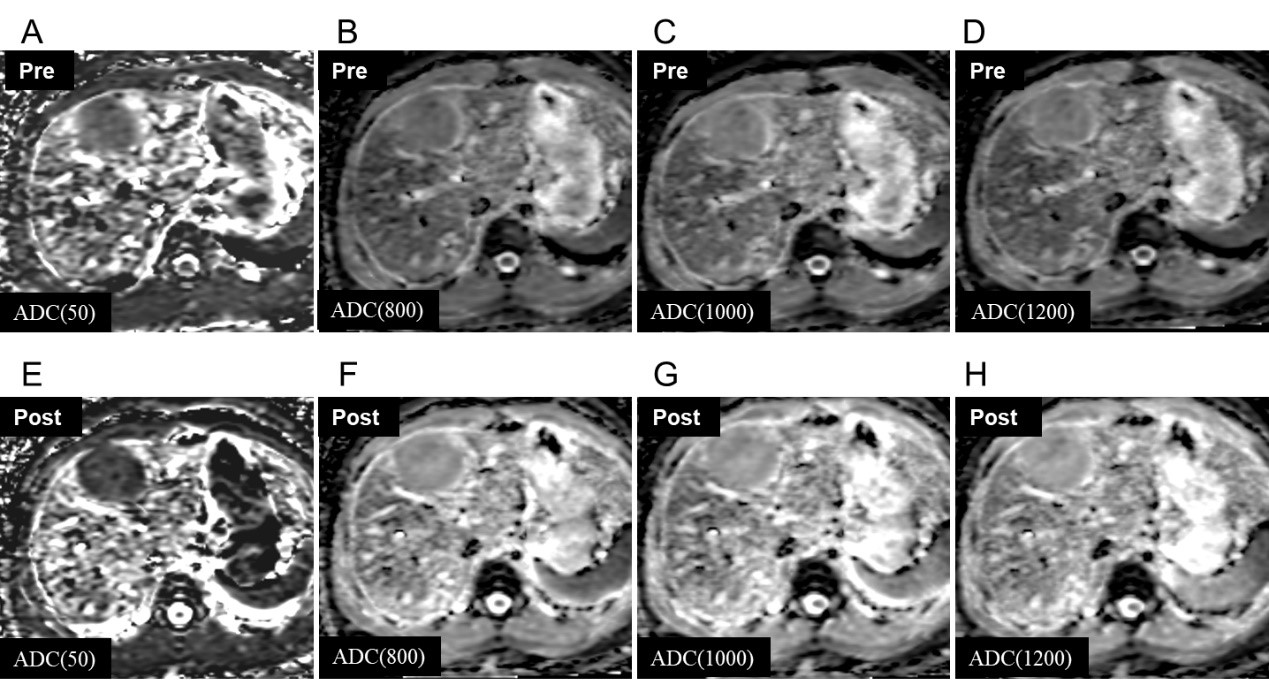
CIRs and ADC of focal hepatic lesions were comparable on pre- and post-contrast images at each b-value (all p>0.05) (Figure 3, Figure 4). The ADC of liver parenchymal on the post-contrast was lower than pre-contrast (all p<0.05). The ADCs of malignant lesion were smaller than benign lesion on DWI with high b-values (800, 1000, 1200 s/mm2) (all p<0.01), while no statistical difference was shown between ADC of malignant tumors and benign tumors at b-value=50 s/mm2 (p(pre) = 0.606; p(post) = 0.637). The b value of 1200 s/mm2 had the largest AUC value of 0.889 among 4 b-values of DWI with enhancement, and subsequent with the b value = 1000 (AUC=0.868), and 800 (AUC=0.866) s/mm2.Discussion
Our results indicated that DWI scanned between the interval of dynamic enhanced imaging and hepatobiliary phase imaging can save overall scanning time without influencing on CIRs, ADCs and diagnostic capabilities of hepatic lesions at both low and high b-value. The result showed that Gd-EOB-DTPA injection has no effect on the ADC value of focal hepatic lesions without uptake of contrast agents, which was similar to previous reports4,5,6,7. Unlike previous reports that only discussed one single ADC value, this study evaluated the ADCs at four b-values (50, 800, 1000, 1200 s/mm2). We also found that at the high b-value (800, 1000, 1200 s/mm2), the ADC values of malignant tumors (hepatocellular carcinomas(HCC) and metastases) were lower than benign lesions (cysts and hemangiomas) in both pre- and post-contrast images, which was similar with Choi’s report5. This study also found the diagnostic ability of ADCs at low b-value (50 s/mm2) DW images couldn’t distinguish the malignant lesion from benign lesions. It may related to the principle, in which the ADC maps obtained by low b-value DWI reflected more blood perfusion information than water molecule movement8. In addition, this study also compared the diagnostic ability of ADCs at different b-values and found that, among the high b-value DWI images, the ADC1200 had the largest AUC, although it was not statistically different from ADC1000 and ADC800. It may be related to the principle, in which the water molecular diffusion weight is heavier at higher b-value DWI9.Conclusions
Our study demonstrated that DWI acquisition can be performed between dynamic enhanced scans and delayed hepatobiliary scans to save overall scan time. Regardless of the high or the low b-value of DWI, the ADC values of the lesion were not affected by the injection of Gd-EOB-DTPA.Acknowledgements
No acknowledgement found.References
1. Alanazi SA, Alanazi F, Haq N, et al. Lipoproteins-nanocarriers as a Promising Approach for Targeting Liver Cancer: Present Status and Application Prospects. Curr Drug Deliv 2020.
2. Torre LA, Bray F, Siegel RL, et al. Global cancer statistics, 2012. CA Cancer J Clin 2015;65:87-108.
3. Cieszanowski A, Podgórska J, Rosiak G, et al. Gd-EOB-DTPA-Enhanced MR Imaging of the Liver: The Effect on T2 Relaxation Times and Apparent Diffusion Coefficient (ADC). Pol J Radiol 2016;81:103-9.
4. Muhi A, Ichikawa T, Motosugi U, et al. Diffusion- and T₂-weighted MR imaging of the liver: effect of intravenous administration of gadoxetic acid disodium. Magn Reson Med Sci 2012;11:185-91.
5. Choi JS, Kim MJ, Choi JY, et al. Diffusion-weighted MR imaging of liver on 3.0-Tesla system: effect of intravenous administration of gadoxetic acid disodium. Eur Radiol 2010;20:1052-60.
6. Song KD, Kim YK, Lee WJ, et al. Detection and characterization of small focal hepatic lesions (≤2.5 cm in diameter): a comparison of diffusion-weighted images before and after administration of gadoxetic acid disodium at 3.0T. Acta Radiol 2012;53:485-93.
7. Benndorf M, Schelhorn J, Dietzel M, et al. Diffusion weighted imaging of liver lesions suspect for metastases: Apparent diffusion coefficient (ADC) values and lesion contrast are independent from Gd-EOB-DTPA administration. Eur J Radiol 2012;81:e849-53.
8. Yamada I, Aung W, Himeno Y, et al. Diffusion coefficients in abdominal organs and hepatic lesions: evaluation with intravoxel incoherent motion echo-planar MR imaging. Radiology 1999;210:617-23.
9. Bammer R. Basic principles of diffusion-weighted imaging. Eur J Radiol 2003;45:169-84.
Figures