4325
An accelerated magnetic resonance imaging pulse sequence for 3D T1 mapping based on magnetization-prepared rapid gradient-echo (MPRAGE)1Faculty of Science and Engineering, University of Nottingham Ningbo China, Ningbo, China
Synopsis
Plenty of studies have reported correlations between the tissue pathological changes and abnormal T1 value. However, T1 mapping pulse sequences often suffer from the B1 inhomogeneity and long scan time. To improve the time efficiency without leading to the worse robustness to B1 inhomogeneity, we develop an accelerated MPRAGE-based 3D T1 mapping method by using SPGR steady state. Our proposed method is demonstrated in phantom experiments and the preliminary in-vivo brain scan.
Introduction
T1 relaxation time is one of the most important quantitative parameters in MRI. Many different MPRAGE-based T1 mapping techniques have been developed and investigated. MP2RAGE1, can perform T1 mapping with self-correction of receive magnetic field ( B1- ) and a first-order correction of transmit magnetic field ( B1+ ) by two T1-weighted images. However, imperfect inversion recovery and a small amount of B1 error still degrade the accuracy of T1 measurement2,3. Liu et al.4 proposed 3-TI MPRAGE to estimate T1 accurately from several T1-weighted images by varying the inversion time based on a 3D MPRAGE sequence while keeping the sum of the inversion time and time recovery constant, which results in a lot of waiting time for the recovery of the longitudinal magnetization3. In this study, by using SPGR steady state, we develop a modified 3-TI MPRAGE pulse sequence for 3D T1 mapping which does not need B1 correction and can significantly reduce the imaging time. We demonstrate the feasibility of the proposed T1 mapping method in phantoms and healthy human subjects.Methods
In our approach, the spoiled gradient echo (SPGR) sequence is implemented at the beginning and in the following data acquisitions to achieve the steady state5, which will be used as the reference point before every inversion pulse cycle. The proposed MRI pulse sequence is shown in Figure 1. At the beginning, sufficient dummy scans are implemented once to achieve the steady-state condition as the reference point. T1-weighting preparation block consists of an adiabatic inversion pulse and spoiler gradients followed with a variable inversion time delay (TI). After the center-out SPGR acquisition, the steady-state preparation block 2 is optional to make sure the steady-state SPGR condition is fulfilled at the end of every inversion pulse cycle. These blocks are repeated Ny (number of 2D phase encoding) times like 3D MPRAGE to produce one T1-weighted image. The center-out SPGR sequence in the slice direction (3D) phase encoding direction is used to sample the 3D images. Since the inversion time is primarily defined by the center of k-space, the measured signal $$$S$$$can be expressed by: $$ S = a + be^{-TI/T_{1}},$$ where $$$a = M_{0} sin(\theta)e^{-TI/T_{2}^{*}}$$$ and $$$b = -M_0(1+\frac{1-e^{-TR/T_1}}{1-cos(\theta)e^{-{TR}/T_1} } )sin(\theta)e^{-TI/T_{2}^{*}}$$$ with $$$M_{0}$$$ represents the thermal equilibrium magnetization, $$$\theta$$$ is the flip angle. Three T1-weighted images are acquired with different inversion times to estimate T1 using a reduced-dimension nonlinear least square (RD-NLS)6 fit. Five water-containing tubes (diameter 2.5 cm, height 10 cm) doped with Gdcl and agarose were used to perform phantom T1 mapping studies. All scans were performed at a 1.5 T scanner (Superscan-1.5 T, XGY Medical Equipment, Ningbo, China) with an 8-channel head coil. For the phantom experiments, IRSE method was implemented as a T1 mapping reference: TR/TE = 1550/10 ms, slice thickness = 4 mm, TI = [30 530 1030 1530] ms, with the resolution of 1.27×1.27 mm2. The scan time was 23.5 mins per slice. The parameters of the proposed method were: TR/TE = 5.8/2.5 ms, TI = [6 686 1506] ms, with the resolution of 1.27×1.27×2.81 mm3. The scan time of the proposed method was 9.1 mins. Two healthy volunteers (Male, Age: 26, 33) were scanned by the proposed T1 protocol, with all parameters same as these used in the phantom study. The study was approved by the local ethics committee, and written informed consent was obtained from both subjects.Results
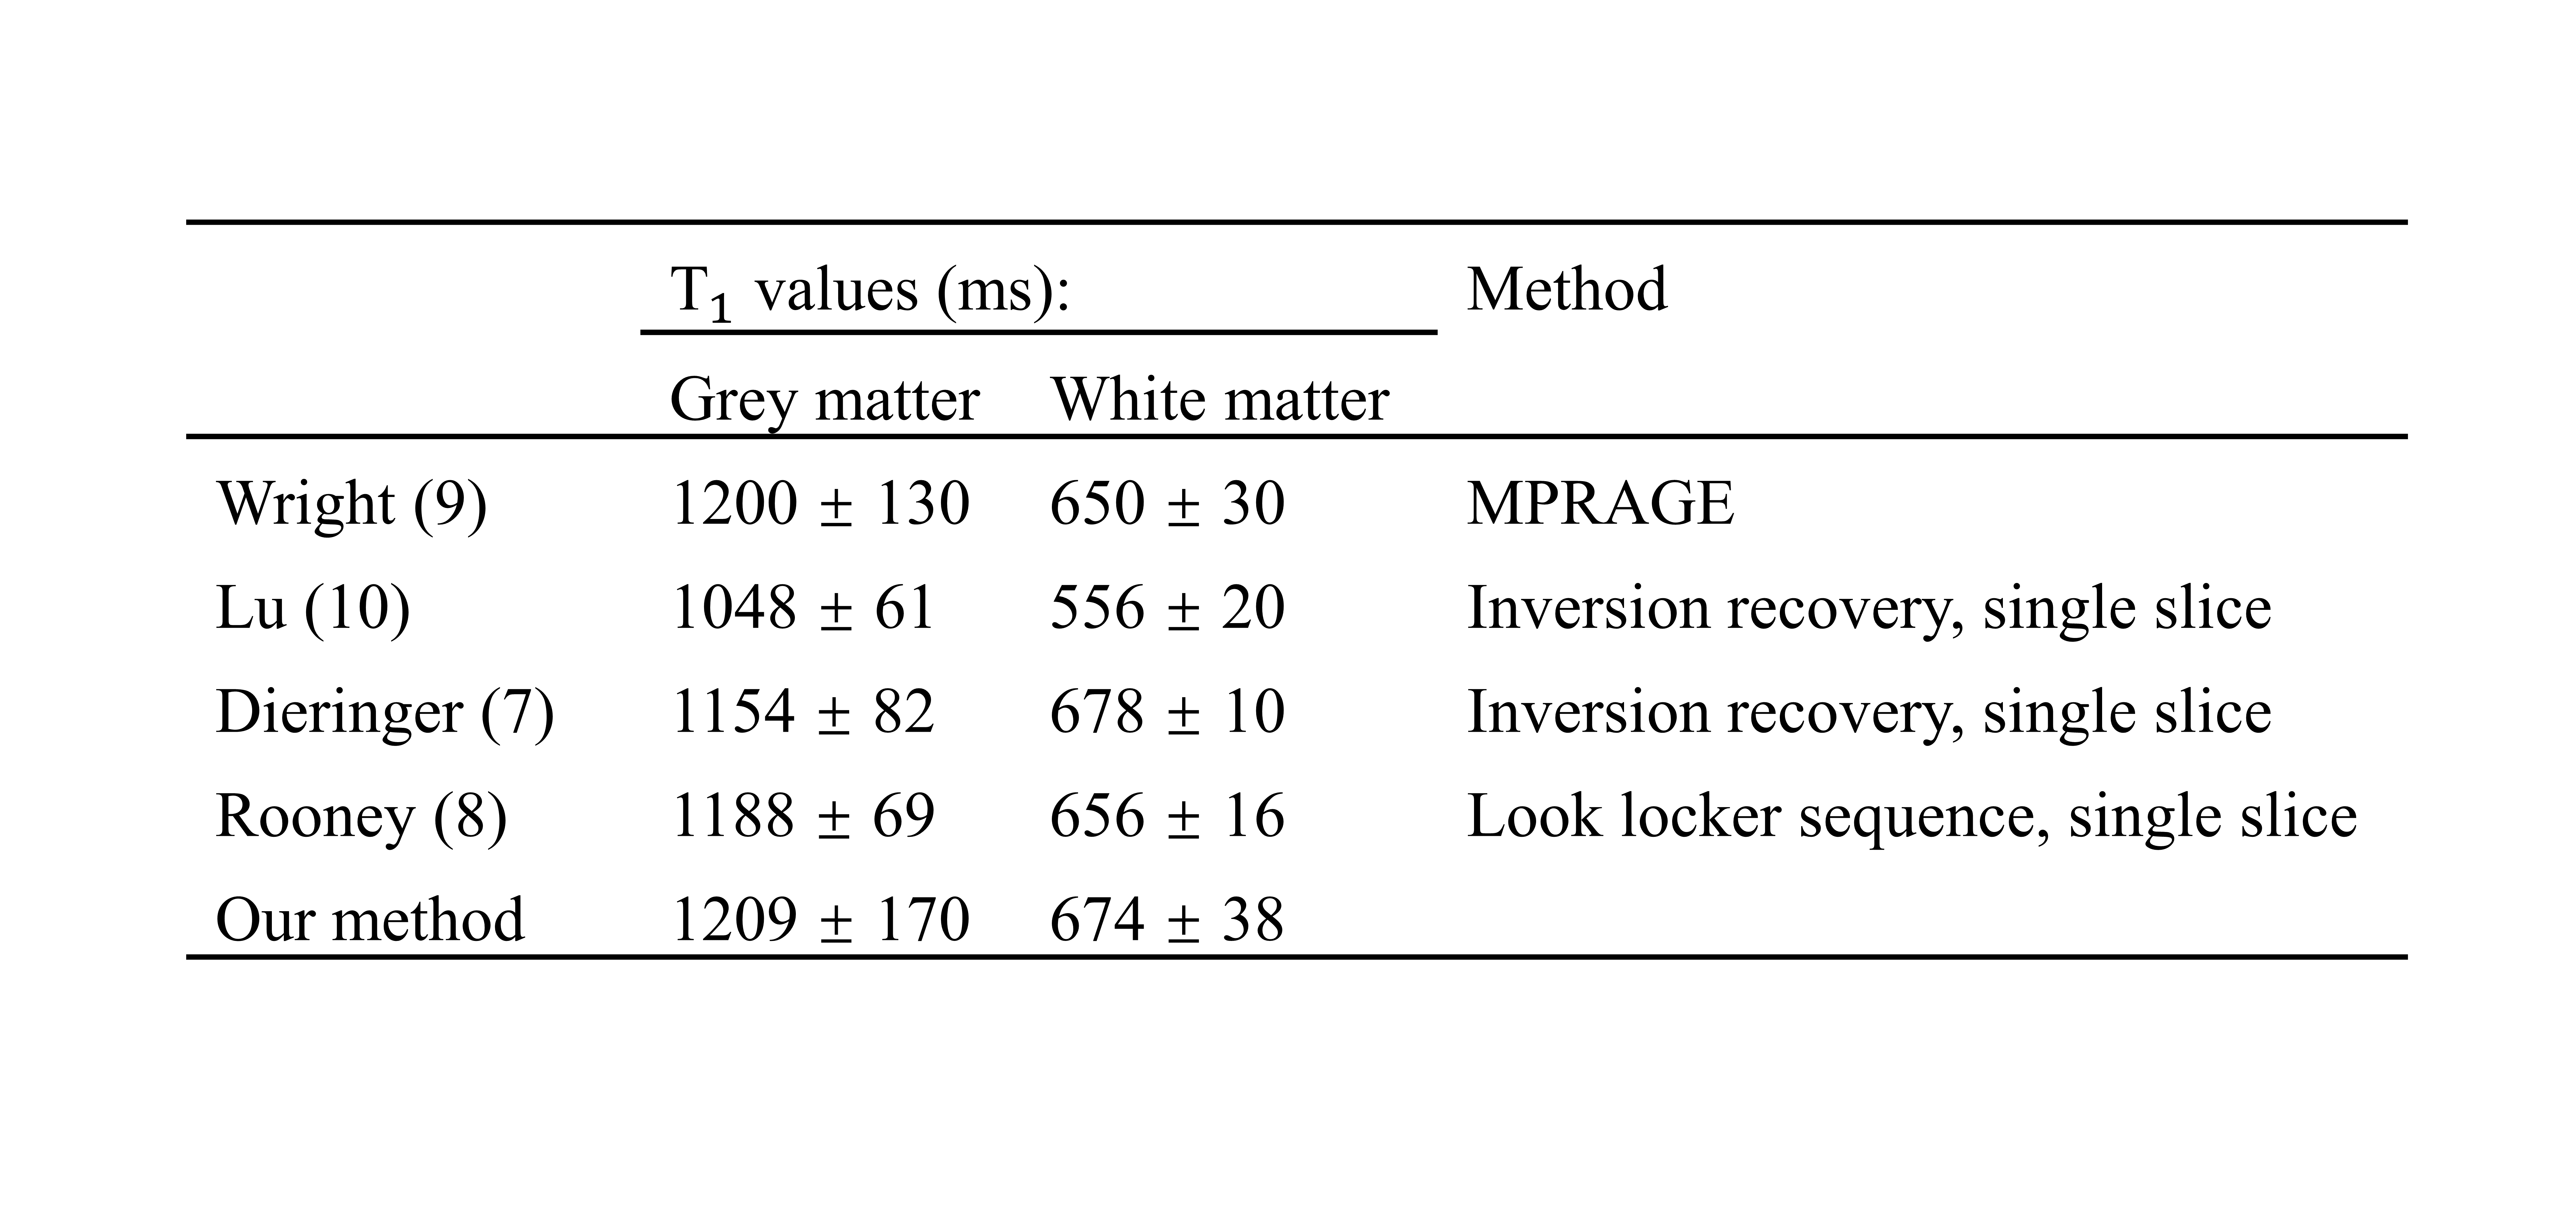
Figure 2 shows the histograms of T1 maps obtained for 5 phantoms and Table 1 presents the corresponding T1 values. Linear regression analysis indicated that the T1 measurements from both methods are highly similar with a very small relative difference (0.41% ± 0.58%, r=0.9999, P<1E-5). Figure 3 shows T1 maps of one example slice for each subject with cerebrospinal fluid (CSF) filtered out. The results from an ROI analysis on the two healthy subjects were shown in Table 2 compared with T1 values reported in the literature.Discussion
As demonstrated in the phantom experiments, the proposed method achieves similar accuracy, but less precision compared with IRSE method. In vivo brain analysis, T1 values of the white matter and grey matter were found to be 674 ± 38 and 1209 ± 170 ms, which are in close agreement with the T1 values reported at 1.5 T7-10. Our method has two advantages over other MPRAGE based T1 mapping methods. Prior knowledge of flip angle is not required in our method compared with MP2RAGE, avoiding the additional B1 correction. Compared with 3-TI MRRGAE, our method saves about 50% of the time because no recovery time is needed for each inversion cycle. Preliminary results suggest that the proposed method can achieve similar time efficiency as MP2RAGE, much faster than 3-TI MPRAGE.Conclusion
In this study, we proposed an accelerated MPRAGE-based 3D T1 mapping method by using SPGR steady state. Furthermore, we demonstrated the feasibility of the proposed method in phantom and human experiments, which estimated T1 values comparable to reported literature values.Acknowledgements
No acknowledgement found.
References
1. Marques JP, Kober T, Krueger G, van der Zwaag W, Van de Moortele P-F, Gruetter R. MP2RAGE, a self bias-field corrected sequence for improved segmentation and T1-mapping at high field. NeuroImage 2010;49:1271-1281.
2. Marques JP, Gruetter R. New developments and applications of the MP2RAGE sequence--focusing the contrast and high spatial resolution R1 mapping. PLoS One 2013;8:e69294.
3. Hung W, Chen P, Chuang T, Chang H, Wu M. High resolution volumetric T1 mapping using a novel MP3RAGE method. International Society for Magnetic Resonance in Medicine Annual Meeting 2013:2353.
4. Liu JV, Bock NA, Silva AC. Rapid high-resolution three-dimensional mapping of T1 and age-dependent variations in the non-human primate brain using magnetization-prepared rapid gradient-echo (MPRAGE) sequence. NeuroImage 2011;56:1154-1163.
5. Zur Y, Stokar S, Bendel P. An analysis of fast imaging sequences with steady‐state transverse magnetization refocusing. Magn Reson Med 1988;6(2):175-193.
6. Barral JK, Gudmundson E, Stikov N, Etezadi-Amoli M, Stoica P, Nishimura DG. A robust methodology for in vivo T1 mapping. Magn Reson Med 2010;64:1057-1067.
7. Dieringer MA, Deimling M, Santoro D, Wuerfel J, Madai VI, Sobesky J, von Knobelsdorff-Brenkenhoff F, Schulz-Menger J, Niendorf T. Rapid parametric mapping of the longitudinal relaxation time T1 using two-dimensional variable flip angle magnetic resonance imaging at 1.5 Tesla, 3 Tesla, and 7 Tesla. PLoS One 2014;9:e91318.
8. Rooney WD, Johnson G, Li X, Cohen ER, Kim SG, Ugurbil K, Springer CS, Jr. Magnetic field and tissue dependencies of human brain longitudinal 1H2O relaxation in vivo. Magn Reson Med 2007;57:308-318.
9. Wright PJ, Mougin OE, Totman JJ, Peters AM, Brookes MJ, Coxon R, Morris PE, Clemence M, Francis ST, Bowtell RW. Water proton T 1 measurements in brain tissue at 7, 3, and 1.5 T using IR-EPI, IR-TSE, and MPRAGE: results and optimization. Magnetic Resonance Materials in Physics, Biology and Medicine 2008;21(1):121-130.
10. Lu H, Nagae-Poetscher LM, Golay X, Lin D, Pomper M, van Zijl PC. Routine clinical brain MRI sequences for use at 3.0 Tesla. J Magn Reson Imaging 2005;22:13-22.
Figures