4323
Dynamic quantitative T1 mapping (dyQT1) series for quantitative DCE imaging using variable flip angle method1MR Collaborations, Siemens Healthineers Ltd., Shanghai, China, 2Institute of Diagnostic and Interventional Radiology, Shanghai Jiao Tong University Affiliated Sixth People's Hospital, Shanghai, China, 3MR Application Development, Siemens Shenzhen Magnetic Resonance Ltd., Shenzhen, China
Synopsis
In this work, a new acquisition scheme is proposed for directly measuring the continuous quantitative T1 changes during the contrast enhancement. By alternatively changing the flip angles from phase to phase, the temporal resolution of T1 mapping could be the same as conventional DCE (conv-DCE) imaging, i.e., 4.36 s in our experiments. The dynamic quantitative T1 mapping (dyQT1) DCE method were validated on animal study (rabbit with VX2 tumor), and compared with conv-DCE. The preliminary results showed dyQT1-DCE was more time efficient without native T1 scans and higher sensitivity in the detection of tumor than conv-DCE.
Introduction
Quantitative dynamic contrast enhanced (DCE) imaging measures pharmacokinetic parameters (i.e., the volume transfer constant (Ktrans)) using continuous T1w image series [1]. It is under the hypothesis that the concentration of contrast agent is proportional to image intensity [1]. The sensitivity of image intensity to the perfusion of contrast agent could be influenced by imaging parameters including repetition time, flip angle, echo time, and native T1 values as well [2,3]. The proposed variable flip angle DCE method aims to directly measure the quantitative dynamic T1 map series, such that the concentration of contrast agent is directly derived from the dynamic T1 value, instead of from the image intensity of T1w images and a pre-contrast T1 map in conventional DCE.Purpose
To propose a dynamic T1 mapping method in quantitative DCE imaging using dynamic variable flip angle way and validate its application in rabbits with VX2 tumor.Methods
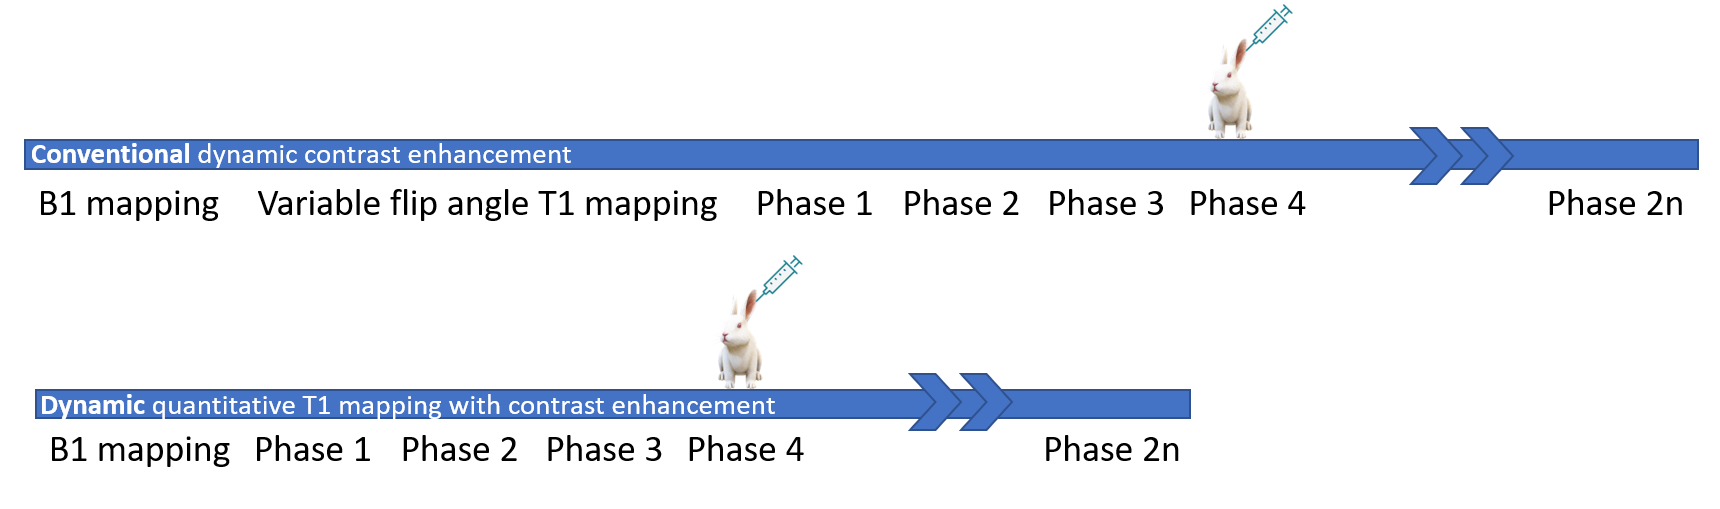
The diagrams of the prototype dyQT1-DCE and the conv-DCE sequence are shown in Fig.1. The excitation flip angle changed alternatively from 3° to 16° from phase to phase for dyQT1-DCE. Besides, there is no need to acquire additional native T1 map before the contrast injection in the proposed method. The DCE experiments were performed on a 3T MRI system (MAGNETOM Prisma, Siemens Healthcare, Erlangen, Germany) using an 18-ch body coil and spinal coil: TR = 4.3 ms; TE = 1.37 ms; in-plane resolution = 1.25 x 1.25 mm2; slice thickness = 3 mm; temporal resolution = 4.36 s/phase; and number of phases = 64. All the parameters in conv-DCE were kept in consistency with dyQT1-DCE except for the use of constant flip angle from phase to phase. Quantitative Ktrans values were generated offline using extended Tofts model [4] and Parker’s AIF model [5] based on MATLAB (v2017A, Natick, MA, USA).The rabbits (4 males) were scanned 4 times every 7 days at day 7, 14, 21, and 28 after the VX2 tumor cell was inserted. To ensure the metabolism of contrast agent, the conv-DCE and dyQT1-DCE were performed on the same rabbit in a time interval of 24h.
Results
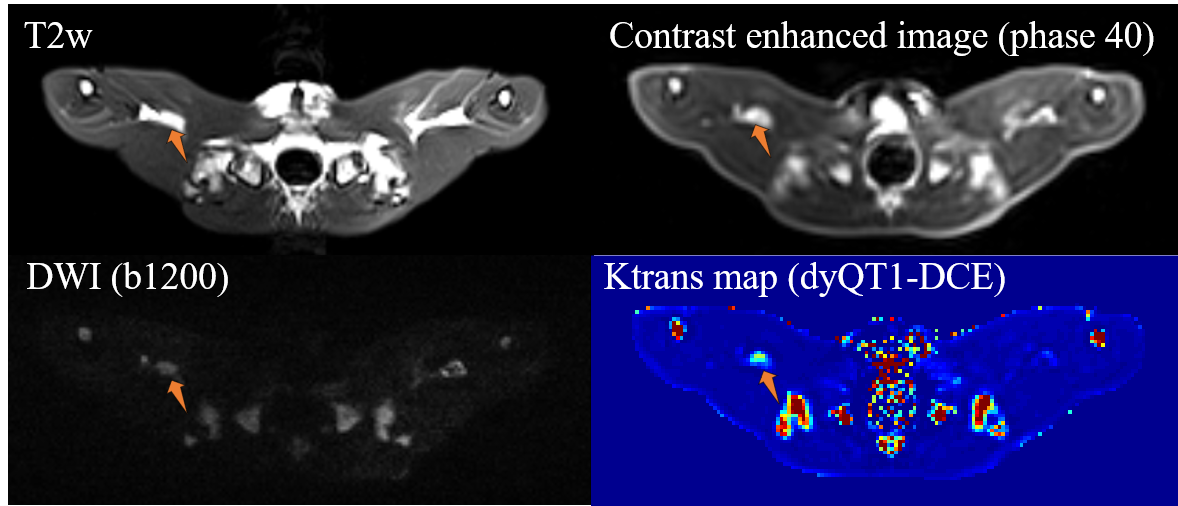
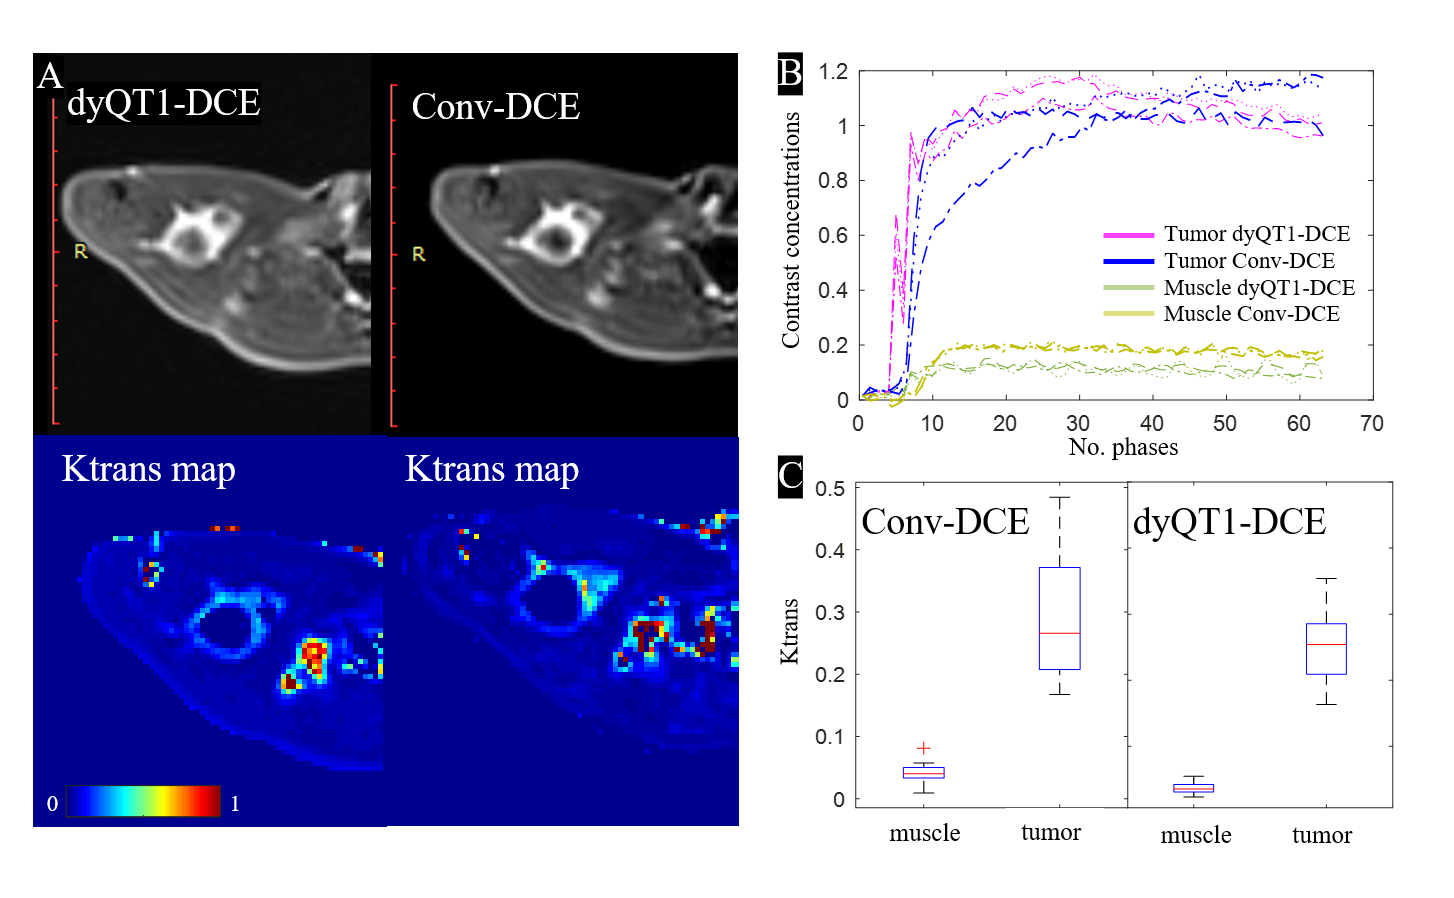
Fig. 2 shows an example of dyQT1-DCE for the early detection of the tumor in the multi-contrast images: T2w image, DCE image, DWI, and Ktrans map.Fig. 3 shows the comparison of quantitative DCE between the dyQT1-DCE (acquired at day 14) and conv-DCE (acquired at day 15) on the same rabbit. The contrast concentration changes derived from dyQT1-DCE (subfigure B, purple plots) shows a strong variation at the beginning of contrast injection. Muscles had much lower contrast loading than tumor in both methods. Subfigure C shows the variation of Ktrans in conv-DCE is higher than dyQT1-DCE.
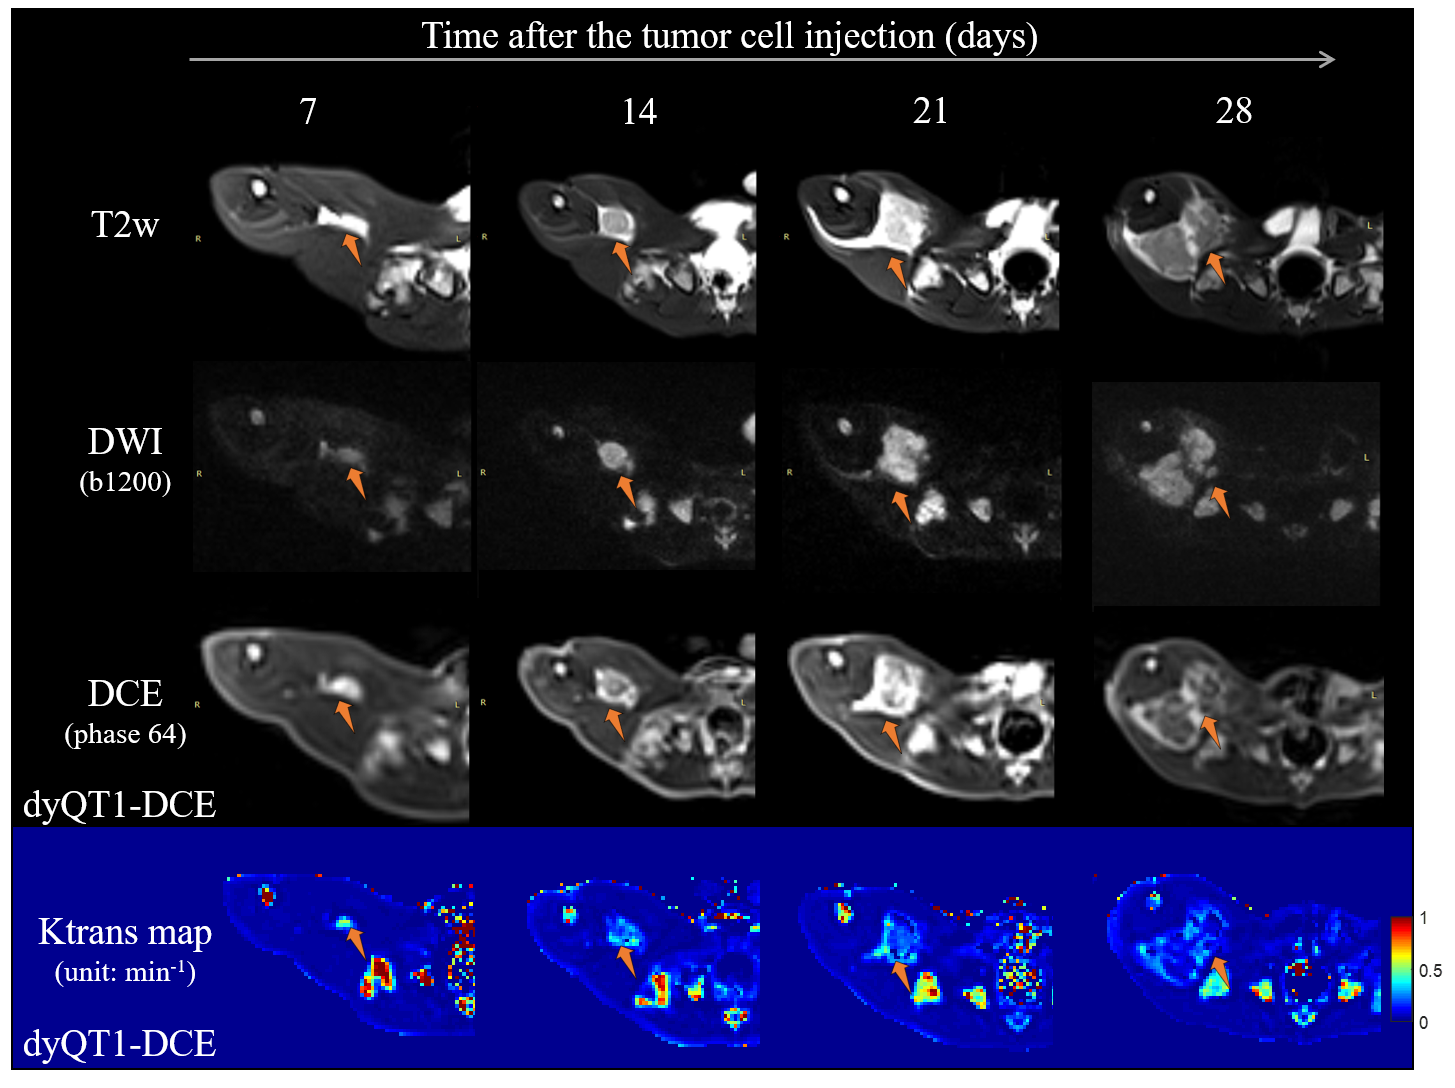
Fig. 4 shows the longitudinal development of tumor on a rabbit in T2w image, DWI, DCE image, and quantitative Ktrans map.
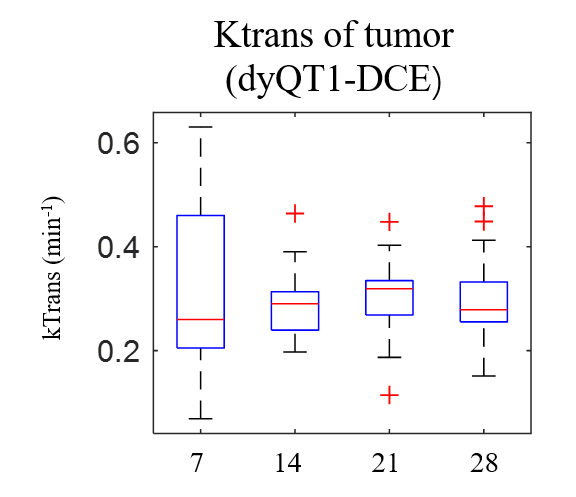
Fig. 5 shows the box plot of the Ktran changes (derived from dyQT1-DCE) at different scan time from tumor. ROIs were chosen on the tumor based on the Ktrans map. The average Ktrans values show an increase from beginning to 3 weeks and then decrease at the last week.
Discussions
In this work, a quantitative dynamic T1 mapping method was proposed for DCE imaging. We have validated its performance on animal study and compared with conventional DCE.The dyT1-DCE directly measured the T1 mapping series during and after the contrast injection. The T1 maps were derived from the two adjacent variable flip angle T1w images. At the beginning of contrast injection there is a quick change in the T1 value, especially in the tumor area, as can be noticed in Fig.3B. The results in Fig.3C show that Ktrans variations in tumor and muscle are smaller with dyT1-DCE than with conv-DCE, indicating that dyT1-DCE could possibly perform better than conv-DCE in terms of higher sensitivity to tumor permeability changes.
Since the first imaging point was at 7 days after the VX2 tumor cell injection, 3 of the rabbits showed large tumor size with the diameter of more than 1cm. The grew rate of tumor differed from different rabbits, which suggested to have a continuous imaging after the tumor injection in the future studies.
Conclusion
A quantitative dynamic T1 mapping technique is proposed to characterize the tumor response in dynamic contrast enhanced imaging. The preliminary results show that the proposed method provides comparable Ktrans estimations to the conventional DCE method, with smaller variation and shorter scan time.Acknowledgements
No acknowledgement found.References
1. Khalifa F, Soliman A, El-Baz A, Abou El-Ghar M, El-Diasty T, Gimel'farb G, Ouseph R, Dwyer AC. Models and methods for analyzing DCE-MRI: a review. Med Phys. 2014 Dec;41(12):124301. doi: 10.1118/1.4898202.
2. Tsai WC, Kao KJ, Chang KM, Hung CF, Yang Q, Lin CE, Chen CM. B1 Field Correction of T1 Estimation Should Be Considered for Breast Dynamic Contrast-enhanced MR Imaging Even at 1.5 T. Radiology. 2017 Jan;282(1):55-62. doi: 10.1148/radiol.2016160062.
3. Wang P, Xue Y, Zhao X, Yu J, Rosen M, Song HK. Effects of flip angle uncertainty and noise on the accuracy of DCE-MRI metrics: comparison between standard concentration-based and signal difference methods. Magn Reson Imaging. 2015 Jan;33(1):166-73. doi: 10.1016/j.mri.2014.10.005. Epub 2014 Oct 13. PMID: 25311569.
4. Chen H, Li F, Zhao X, Yuan C, Rutt B, Kerwin WS. Extended graphical model for analysis of dynamic contrast-enhanced MRI. Magn Reson Med. 2011 Sep;66(3):868-78. doi: 10.1002/mrm.22819.
5. Parker GJ, Roberts C, Macdonald A, Buonaccorsi GA, Cheung S, Buckley DL, Jackson A, Watson Y, Davies K, Jayson GC. Experimentally-derived functional form for a population-averaged high-temporal-resolution arterial input function for dynamic contrast-enhanced MRI. Magn Reson Med. 2006 Nov;56(5):993-1000. doi: 10.1002/mrm.21066.
Figures