4317
3D diffusion MRI with Twin-navigator-based GRASE for comparison of fiber-tracking using 2D and 3D sequences in human whole brain1Key Laboratory for Biomedical Engineering of Ministry of Education, Department of Biomedical Engineering, College of Biomedical Engineering & Instrument Science, Zhejiang University, Hangzhou, China, 2MR Collaboration, Siemens Healthineers Ltd., Shanghai, China
Synopsis
3D pulse sequences enable high-resolution acquisition with high SNR and ideal slice profiles, which however, is particularly difficult for diffusion MRI (dMRI) due to the additional phase errors from diffusion encoding. Here we proposed a twin-navigator based 3D diffusion-weighted gradient spin-echo (DW-GRASE) sequence to correct the phase errors between shots for human whole-brain acquisition. Moreover, we tested whether acquisitions may impact the fiber-tracking results by comparing the 3D-GRASE with 2D-EPI using the fixel-based analysis, which indicated a significant difference between the 3D and 2D sequences in several microstructural parameters of the long cerebrospinal tract and splenium of corpus callous.
Introduction
3D pulse sequences enable high-resolution acquisition with high SNR and ideal slice profiles, which however, is particularly difficult for diffusion MRI (dMRI) due to the additional phase errors from diffusion encoding. Previous attempts include 3D SSFP1, 2, and 3D EPI3, 4, which however, are subject to limitations such as un-definable b-value and sensitivity to motion. 3D gradient spin-echo sequence combines the strength of spin-echo and EPI and has shown advantages in high-resolution MRI5, 6. Here we proposed the 3D diffusion-weighted gradient spin-echo (DW-GRASE) sequence equipped with a twin-navigator technique, and tested its performance in terms of SNR and phase-correction on a clinical 3T system.Moreover, due to the difficulty in 3D dMRI acquisition, previous studies commonly performed fiber tracking with 2D-EPI-based multislice acquisition, which is known to have limited resolution along the slice-selection direction given the imperfect slice profiles3. This may lead to a bias in fiber tracking along the in-plane and through-plane directions. Therefore, we tested whether there is a statistical difference between the 2D-EPI and 3D-GRASE based dMRI in fiber tracking utilizing the fixel-based analysis (FBA) pipeline in the human brain.
Methods
Pulse sequence: Figure 1 shows the twin-navigator based 3D DW-GRASE sequence, which consisted of five modules: global saturation, diffusion preparation with a motion-insensitive oscillating encoding, fat saturation, 3D GRASE readout, and twin-navigator readout. GRAPPA acceleration was achieved in the EPI phase-encoding direction and a twin-navigator was applied in the turbo-echo direction to track the phase errors of the odd and even echoes separately due to the phase oscillation between them7.Data acquisition: Seven healthy volunteers (male, 20-25 years old) were enrolled with IRB approval. All scans were performed on a 3T Siemens scanner (MAGNETOM Prisma, Siemens Healthcare, Erlangen, Germany) with a 64-channel head coil. dMRI data were acquired using the 3D-GRASE and 2D-EPI sequences. The 3D sequence parameters were: TR/TE1 (TE of the diffusion module)/TE2 (TE of the GRASE module) = 2500/106.26/43.92 ms, NEPI = 109, GRAPPA factor =2, NTSE = 4, and 18 shots along spin-echo encoding direction. The 2D-EPI were acquired with TR/TE = 15000/152 ms and NEPI = 110. The other parameters were kept the same between the two sequences: oscillating frequency = 20 Hz (1 cycle), FOV = 220 × 220 mm2, voxel size = 2 × 2 × 2 mm3, b = 800 and 1500 s/mm2 with 30 directions (one average for 3D-GRASE, 2 averages for 2D-EPI), b = 0 s/mm² with 4 averages, GRAPPA acceleration factor = 2.
Data analysis: The K-space data were reconstructed by GRAPPA reconstruction8 and twin-navigator-based phase-correction7. The images were processed with Gibbs ring removal, eddy current correction, image registration, bias field correction, Fiber Orientation Distribution (FOD) estimation, fiber tracking, and FBA using MRtrix (https://www.mrtrix.org). The SNR was calculated in the regions-of-interest (ROIs) including the frontal white matter (WM), basal ganglia (BG), thalamus, and posterior WM that were manually delineated on b0 images (Figure 3). The differences in fiber-density (FD), fiber bundle cross-section (FC), and fiber density and cross-section (FDC) between the 2D-EPI sequence and 3D-GRASE sequence were assessed by paired t-tests with permutation test using the FBA pipeline9 in MRtrix.
Results
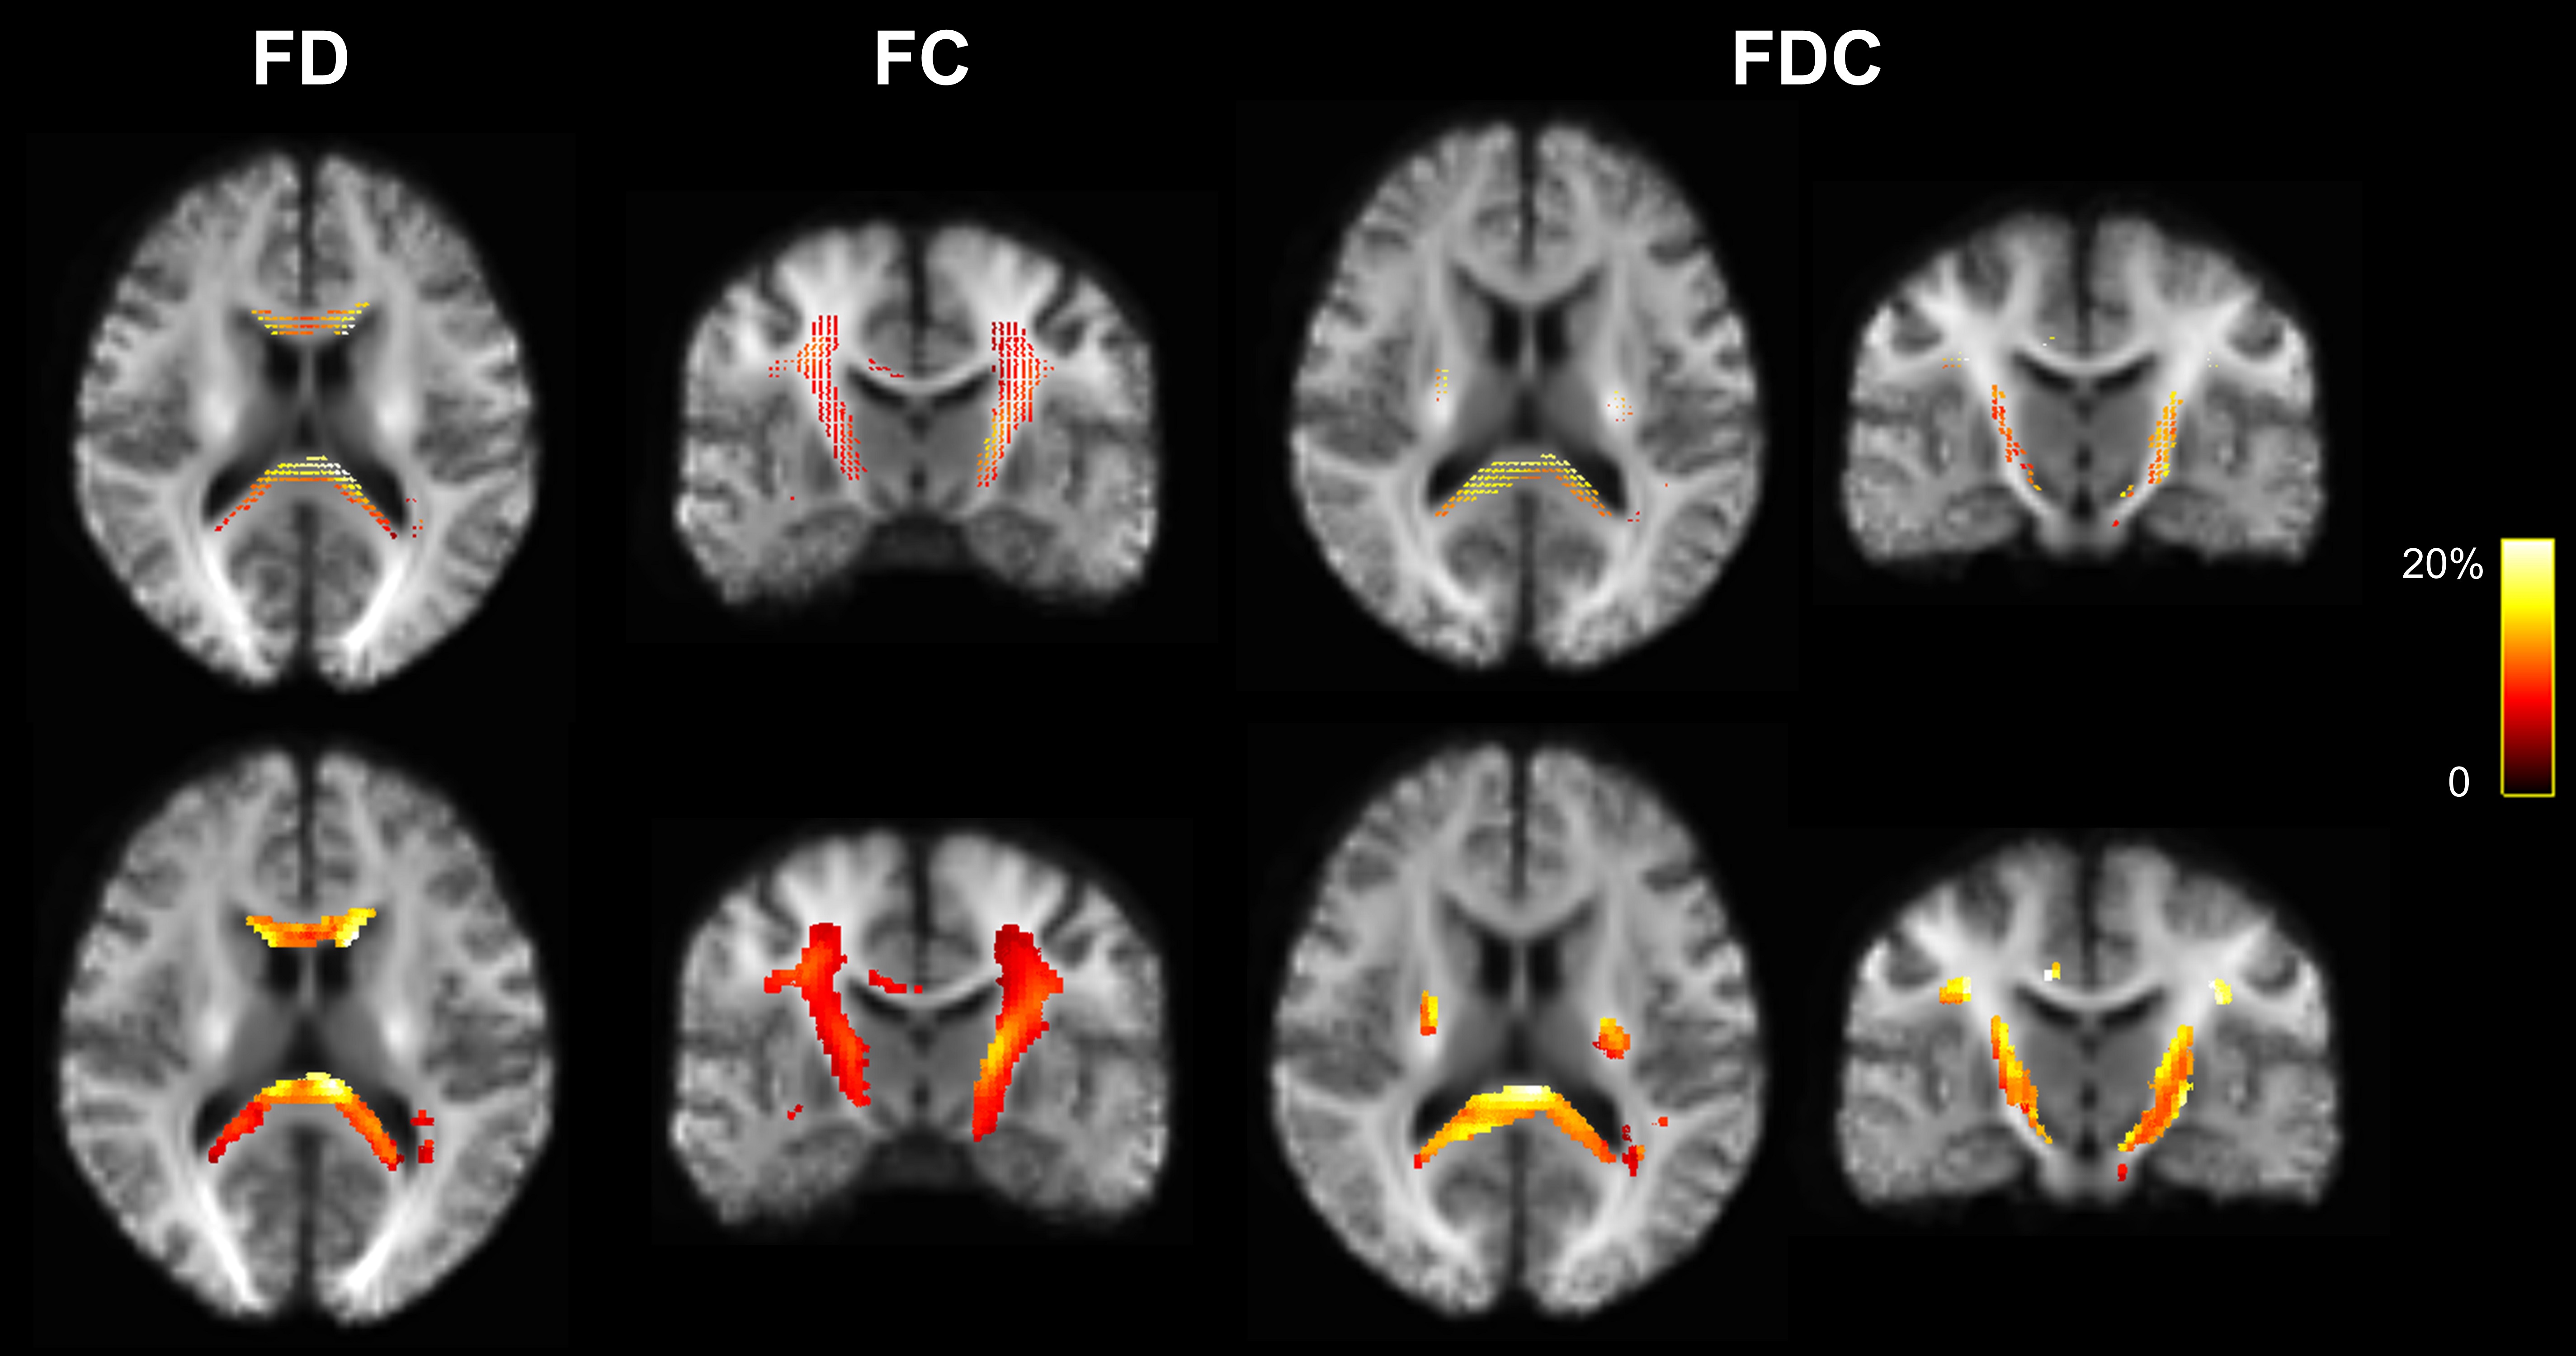
Figure 2 shows the diffusion-weighted images (DWI) acquired by twin-navigator based 3D-GRASE sequence at b-value of 800 and 1500 s/mm2 in axial, coronal, and sagittal views, before and after navigator-based phase correction. The result indicated that the navigators were effective in correcting phase errors in all DWI. Pairwise comparisons of SNR between the 2D-EPI and 3D-GRASE sequences in b0 and DWI are summarized in Figure 3, which demonstrated in all ROIs, the SNR of the GRASE sequence was significantly (p<0.001) higher than the EPI sequence by more than two-folds.Figure 4 shows the whole-brain probabilistic fiber-tracking results generated from the 2D-EPI and 3D-GRASE DWI data in axial, coronal, and sagittal views, indicating that the fibers tracked from 3D data had a higher density than those from 2D data (golden arrows). Comparing the microstructural parameters between the 2D and 3D sequences using the whole-brain FBA, we found a significant (p<0.05) difference in FD in the splenium of corpus callosum (SCC) and FC in the Cortico-spinal Tract (CST). Both regions showed significant sequence difference (p<0.05) in FDC (Figure 5).
Discussion and Conclusion
In this work, we proposed a twin-navigator based 3D-GRASE sequence on a clinical 3T system and compared fiber-tracking and microstructural parameters obtained from the 3D and 2D dMRI sequences in the human brain. The proposed sequence effectively corrected the inter-shot phase errors to enable the 3D dMRI acquisition of the whole-brain and considerably improved SNR compared to 2D-EPI. Besides, the current sequence is equipped with parallel acceleration to reduce the TE and improve the PSF profile.We further identified significant differences between 2D and 3D sequences in terms of the microstructural parameters in SCC and CST. CST mainly runs in the superior-inferior direction (slice-selection direction), and thereby, the sequence-induced difference in CST may indicate the slice profile in 2D-EPI may cause bias in fiber estimation3. SCC mainly runs within the 2D plane, and the sequence difference may be related to the higher SNR in 3D-GRASE.
Acknowledgements
This work is supported by the Ministry of Science and Technology of the People’s Republic of China (2018YFE0114600), the National Natural Science Foundation of China (61801424, 81971606, 82122032), and the Science and Technology Department of Zhejiang Province (202006140).
References
1. McNab JA, Jbabdi S, Deoni SC, et al. High resolution diffusion-weighted imaging in fixed human brain using diffusion-weighted steady state free precession. Neuroimage 2009;46(3):775-785.
2. Gao Y, Zhou Z, Han F, et al. 3D isotropic resolution diffusion‐prepared magnitude‐stabilized bSSFP imaging with high geometric fidelity at 1.5 Tesla. Medical physics 2020;47(8):3511-3519.
3. Engström M, Skare S. Diffusion‐weighted 3D multislab echo planar imaging for high signal‐to‐noise ratio efficiency and isotropic image resolution. Magnetic resonance in medicine 2013;70(6):1507-1514.
4. Engström M, Mårtensson M, Avventi E, et al. On the signal‐to‐noise ratio efficiency and slab‐banding artifacts in three‐dimensional multislab diffusion‐weighted echo‐planar imaging. Magnetic resonance in medicine 2015;73(2):718-725.
5. Kemper VG, De Martino F, Yacoub E, et al. Variable flip angle 3D‐GRASE for high resolution fMRI at 7 tesla. Magnetic resonance in medicine 2016;76(3):897-904.
6. Kemper VG, De Martino F, Vu AT, et al. Sub-millimeter T2 weighted fMRI at 7 T: comparison of 3D-GRASE and 2D SE-EPI. Frontiers in neuroscience 2015;9:163.
7. Mori S, Van Zijl PC. A motion correction scheme by twin‐echo navigation for diffusion‐weighted magnetic resonance imaging with multiple RF echo acquisition. Magnetic resonance in medicine 1998;40(4):511-516.
8. Qu P, Wang C, Shen GX. Discrepancy‐based adaptive regularization for GRAPPA reconstruction. Journal of Magnetic Resonance Imaging: An Official Journal of the International Society for Magnetic Resonance in Medicine 2006;24(1):248-255.
9. Raffelt DA, Tournier J-D, Smith RE, et al. Investigating white matter fibre density and morphology using fixel-based analysis. Neuroimage 2017;144:58-73.
Figures