4316
Comparison of multi-echo MRS and radial TSE sequences in patients with HCC1The First Affiliated Hospital of Guangxi Medical University, Nanning, China, 2MR Scientific Marketing, Siemens Healthineers, Wuhan, China, 3Siemens Medical Solutions, Los Angeles, CA, United States
Synopsis
Multi-echo MRS (HISTO) and a novel radial TSE (RadTSE) sequence were compared in patients with hepatic cellular cancer (HCC). Results showed that T2 from RadTSE with fat saturation had a good consistency with that from HISTO. The difference in T2 between RadTSE without and with FS showed excellent correlation with fat fraction from HISTO. Radial TSE and multi-echo MRS sequences may have similar value in terms of quantitative imaging of the liver.
Introduction
Many hepatic cellular cancer (HCC) patients have a background of diffuse liver disease of which liver fat, iron, and combined overload are common manifestations and may cause fibrosis, cirrhosis. A variety of quantitative MR imaging techniques can be used to non-invasively evaluate the above pathological changes, providing valuable information for the clinical diagnosis and treatment of HCC patients. Multi-echo magnetic resonance spectroscopy (MRS) sequences have proven to be valuable tools for the evaluation of steatosis and iron overload in the liver1,2. T2 relaxation time has also been reported for detection and staging of liver fbrosis3,4. But there is no literature to compare them together. The purpose of this study was to prospectively evaluate a new radial turbo spin echo (TSE) sequence for the assessment of hepatic fibrosis and steatosis in comparison with multi-echo MRS in a group of HCC cases.Methods
This study included 40 patients (12 female, age 58 +/- 15 years) with hepatic cellular cancer (HCC) who underwent magnetic resonance imaging (MRI) including multi-echo MRS (HISTO)5 and a prototype radial TSE sequence with echo-sharing reconstruction and T2 mapping6 before surgery on a 3T system (MAGNETOM Prisma, Siemens Healthcare, Erlangen, Germany). The HISTO sequence was executed with TE =12/24/36/48/72ms, TR=3000ms, bandwidth=1200Hz, averages=1, voxel size=2×2×2cm³, breath-hold and acquisition time=15sec. The spectroscopy voxel was positioned using three-plane localizers to avoid the main vessels. The Radial_TSE sequence was executed twice, with and without fat saturation (FS), all other parameters remained the same: TR/TE1 = 3000/9ms, FOV =380×380mm², scan matrix=320×320, voxel size=1.2×1.2×4.0mm3, slices=38, trajectory=radial, radial views=360, free breathing and acquisition time = 2min18sec. T2 parametric maps and synthetic T2W images were generated inline after data acquisition. Fat fraction (HISTO_FF) and HISTO_R2_water values were calculated inline from HISTO, while HISTO_T2_water was manually calculated as HISTO_T2_water = 1/HISTO_R2_water. RadTSE_T2 (without fat saturation) and RadTSE_FS_T2 (with fat saturation) values were obtained from two different T2 parametric maps with the ROI drawn in the same position as the voxel from HISTO(Figure 1), and their difference RadTSE_ΔT2 = RadTSE_T2 - RadTSE_FS_T2 was calculated. All patients underwent surgical resection of partial liver tissue within 5 days after examination and were pathologically confirmed to have different degrees of liver fibrosis and steatosis. Statistical analyses were performed using MedCalc Software (MedCalc Software Ltd, Belgium). Paired t-test, Pearson coefficient, and Bland-Altman analysis were used to assess the difference, correlation, and agreement between RadTSE and HISTO sequences. p <0.05 was considered statically significant.Results
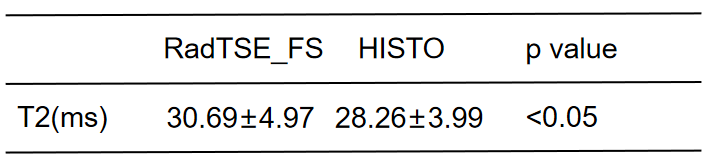
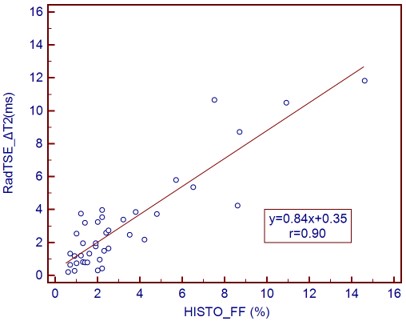
As shown in Figure 1, the RadTSE sequence had good image quality using free breathing. Figure 2 shows the moderate and high correlations of T2 values between the RadTSE (r=0.54, p<0.05) and RadTSE_FS (r=0.69, p<0.05) and HISTO sequences, and good agreement (difference value T2=2.5ms) of T2 values between the RadTSE_FS and HISTO sequences. Table 1 shows T2 values were significantly higher for RadTSE_FS (30.59±4.89 ms) compared with HISTO (28.26±3.99 ms) (p<0.05). Figure 3 shows RadTSE ΔT2 had excellent correlation with HISTO_FF.Discussion
This study showed that RadTSE_FS_T2 had a better correlation with HISTO_T2_water than RadTSE_T2. The reasons may be that both RadTSE_FS_T2 and HISTO_T2_water exclude the influence of fat signals in their calculations. Although RadTSE_FS_T2 was larger than HISTO_T2_water, the difference of 2.5ms was small. This suggests that RadTSE_FS_T2 may be interchangeable with HISTO_T2_water in quantitative assessment of liver iron deposition or fibrosis. In addition, RadTSE_FS sequence can be excuted with free-breathing and can quantify the whole liver, whereas HISTO requires breath-holding and can only measure parts of the liver. Takeshi et al7. proposed that the T2W image with FS can be considered water only, whereas the T2W image without FS is the water-plus-fat. The fat fraction can be calculated from T2W images with and without FS using a specific equation. In this study, we found that the RadTSE_FS_T2 was lower than that of RadTSE_T2 and their difference had excellent correlation with HISTO_FF. This finding indicates RadTSE ΔT2 may be a indicator for hepatic steatosis quantification. However, the underlying reason behind this is unclear and require further investigation.Conclusions
Radial TSE and multi-echo MRS sequences may have similar value for the simultaneous evaluation of fibrosis and steatosis in liver with free breathing.Acknowledgements
Thank Dr. Stephan Kannengiesser(Application Predevelopment, Siemens Healthcare GmbH, Erlangen, Germany) for his precious comments during the revision of this abstract.References
[1] Puneet S, Maria A, Philippe GJ, et al. Measurement of liver fat fraction and iron with MRI and MR spectroscopy techniques[J]. Diagnostic & Interventional Radiology, 2014, 20:17-26.
[2] Zhan C, Olsen S, Zhang H, et al. Detection of hepatic steatosis and iron content at 3 Tesla: comparison of two-point Dixon, quantitative multi-echo Dixon, and MR spectroscopy [J]. 2019.
[3] Guimaraes A R , Siqueira L , Uppal R , et al. T2 relaxation time is related to liver fibrosis severity[J]. Quantitative Imaging in Medicine & Surgery, 2016, 6(2):103.
[4] Hoffman D H , Ayoola A , Nickel D , et al. T1 mapping, T2 mapping and MR elastography of the liver for detection and staging of liver fibrosis[J]. Abdominal Radiology, 2020, 45(3):692-700.
[5] Pineda N, Sharma P, Xu Q, et al. Measurement of hepatic lipid: high-speed T2-corrected multiecho acquisition at 1H MR spectroscopy--a rapid and accurate technique [J]. Radiology, 2009, 252(2):568.
[6] Altbach MI, Bilgin A, Li Z, et al., Processing of radial fast spin-echo data for obtaining T2 estimates from a single k-space data set. MRM 2005; 54:549-59.
[7] Yokoo T , Browning J D . Fat and Iron Quantification in the Liver: Past, Present, and Future[J]. Topics in magnetic resonance imaging: TMRI, 2014, 23(2).
Figures