4314
Compressed SVD for L+S Matrix Decomposition Model to Reconstruct Undersampled Dynamic MRI1Electrical and Computer Engineering, COMSATS University Islamabad, Islamabad, Pakistan, 2Electrical Engineering, University of the Poonch Rawalakot, Rawalakot, Pakistan, 3Service of Radiology and Faculty of Medicine, University of Geneva University Switzerland, Geneva, Swaziland
Synopsis
The Low rank and Sparse (L+S) matrix decomposition model has been proposed in literature to reconstruct the undersampled dynamic MRI data. The limitations of L+S method include an effective separation of the low-rank and sparse components from the acquired dynamic MRI data; also the algorithm is computationally expensive. In this paper, Compressed Singular Value Decomposition (cSVD) is employed in L+S method. The results show that the proposed method provides effective separation of the L and S components as well as considerably reduces the computation time.
INTRODUCTION
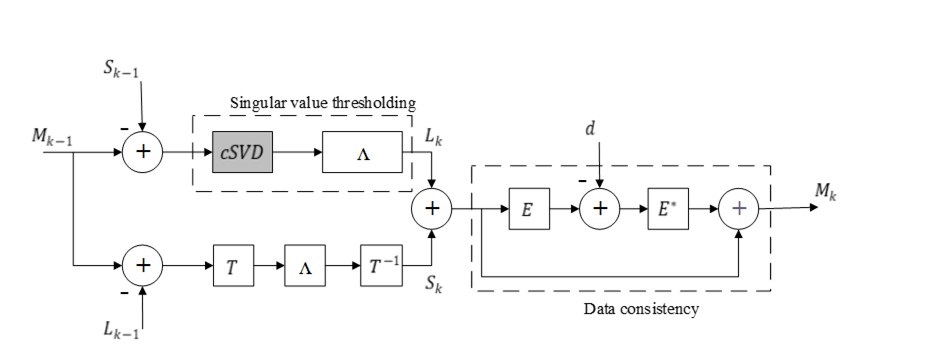
Dynamic Magnetic Resonance Imaging (MRI) is beneficial for the analysis of anatomical and functional variations of internal body structure. The scan time of dynamic MRI is long which leads to patient discomfort. Parallel Imaging (PI) is a robust method to accelerate MRI by acquiring fewer k-space lines. Undersampling leads to artifacts in the MR image1. The Compressed Sensing (CS) has been used to remove undersampling artifacts subject to the conditions that the acquired data must be sparse, the artifacts must be incoherent and iterative reconstruction be used to find the solution image2. However, CS is computationally expensive, and the acceleration rate is limited by the number of sparse coefficients3. A significant increase in the acceleration rate has been achieved in literature by combining CS and PI3. However, the acceleration rate is still limited by the number of receiver coils4.In Dynamic MRI, the L+S decomposition model enables the suppression of background information which tends to increase the acceleration factor4. The expression for L+S decomposition model4 is:$$ \begin{equation}\text{min}\left(L,S\right)\frac{1}{2}\parallel E(L+S)-d\parallel_{2}+\lambda_{L}\parallel L\parallel_{*}+\lambda_{S}\parallel TS\parallel_{1}\end{equation}$$
One main challenge in the L+S approach is to effectively separate the L and S components in dynamic MRI data. In literature, the L+S method uses conventional SVD4 to decompose both the L and S components however, it adds small contamination from the dynamic features (S) into the background component (L); further, it is also computationally expensive4. Compressed Singular Value Decomposition (cSVD)5 is a contemporary approach that can be used as part of the L+S decomposition model instead of conventional SVD for the separation of the background and dynamic information in dynamic MRI and is expected to considerably reduce the computation time5.
METHODS
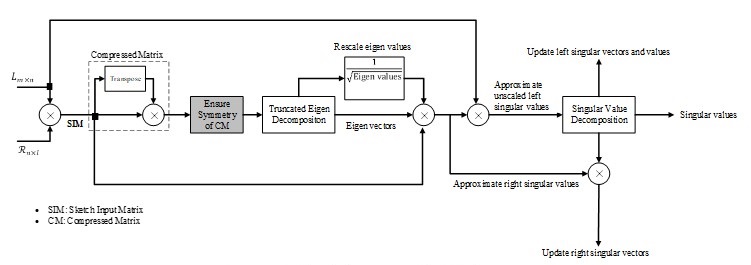
In this paper, we propose to use cSVD as part of L+S decomposition model4 to separate the L and S components in dynamic MRI as shown in Figure 1.In the proposed method, to obtain the low-rank SVD approximation of data matrix MεLmxn with a target rank k with a random test matrix (R) is generated by:
$$\begin{equation*}R=\text{rand}(n,l), ~~\text{Where} ~l=k+\text{constant} \end{equation*}$$
The random test matrix is used to sketch the low-rank matrix (L) and the resulting matrix is compressed into an extremely small matrix (named as ‘Compressed matrix’ in Figure 2). The restricted isometry property is applied to ensure symmetry between the data points in the compressed matrix6. Eigen decomposition is applied to the compressed matrix to first approximate and then update the right and left singular values according to the target rank k. The whole process of cSVD is shown in Figure 2.
RESULTS ANS DISCUSSION
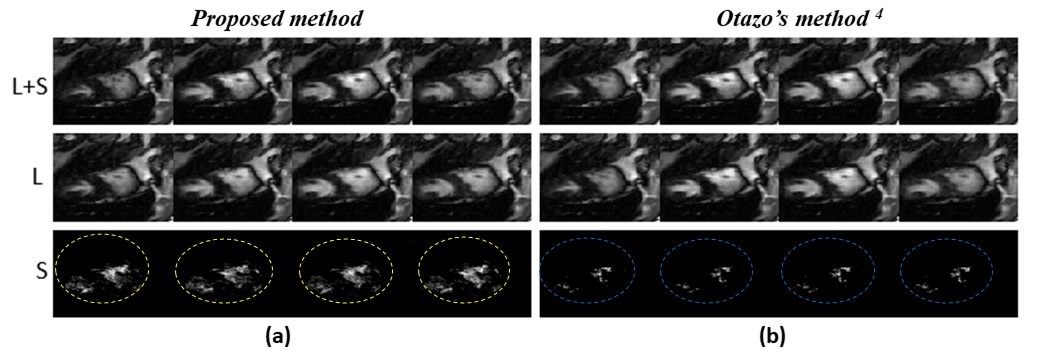
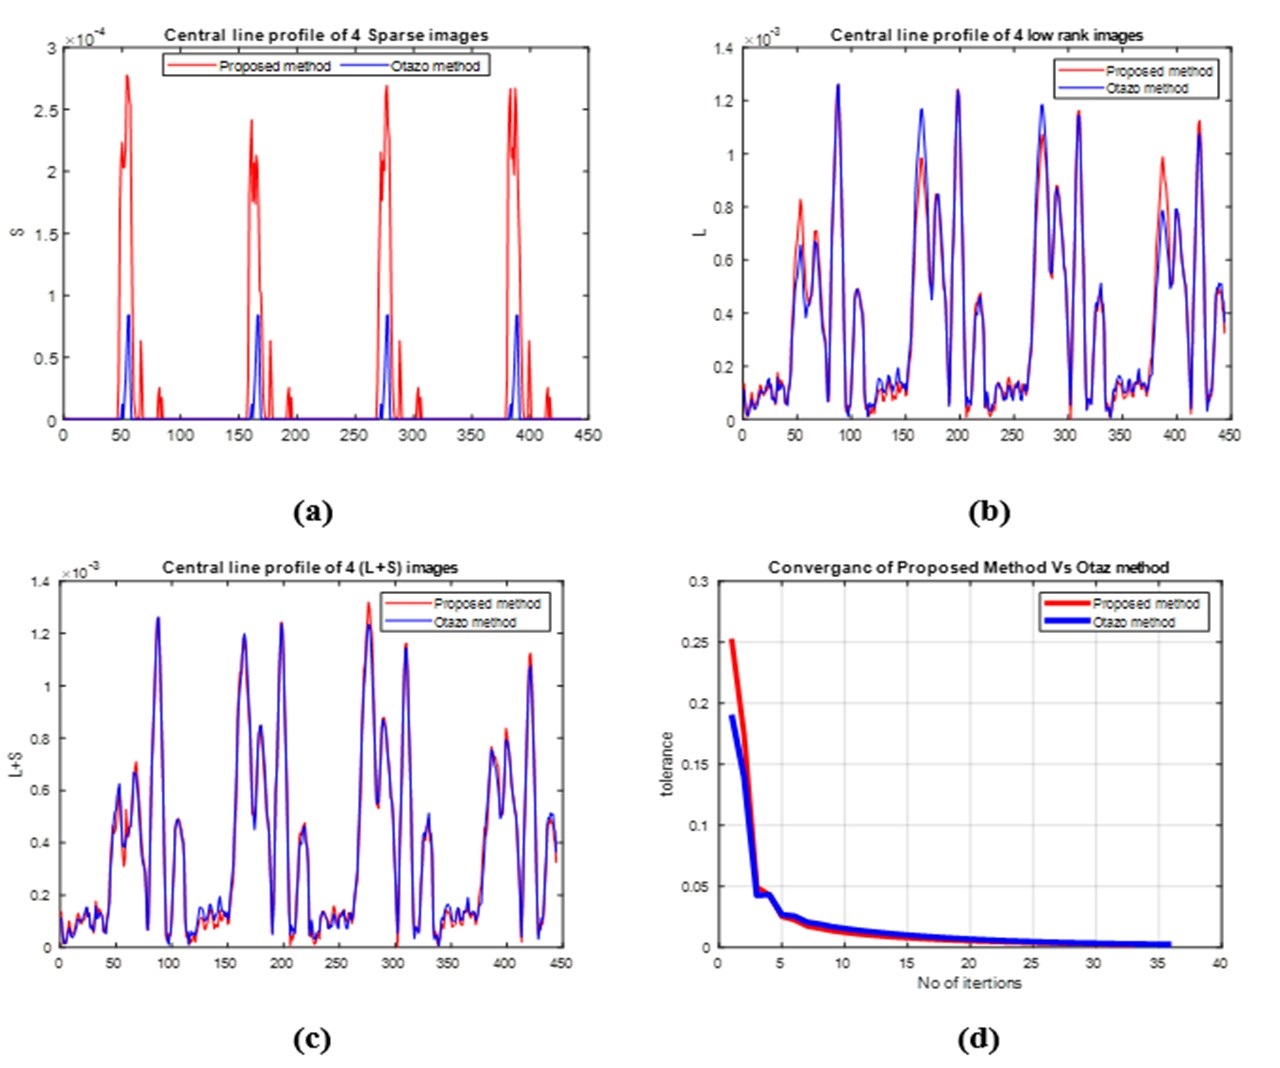
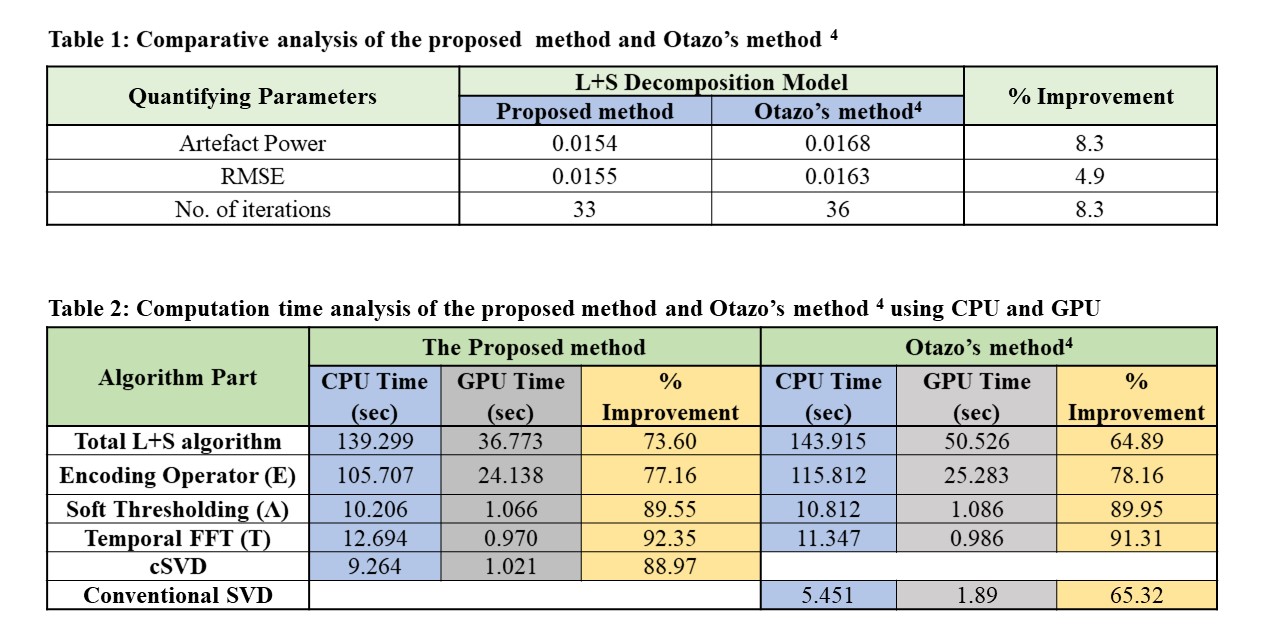
The experiments are performed on two data sets, one is cardiac cine MRI data acquired with 3T Scanner at Case Western Reserve University USA and the other is cardiac perfusion MRI data available publically4. Both of these data sets were retrospectively undersampled at Acceleration Factors (AF) of 6 & 8. The results are compared with Otazo’s method4. For a fair comparison between the proposed method and Otazo’s method4, simulations are performed by setting the same values of all the parameters on the same machine i.e. Intel(R) Core (TM) i7-4790, having 3.60GHz frequency and 16GB RAM. Further, to assess the parallel nature of the proposed method, simulations on GPU are performed using MATLAB’s parallel computing toolbox on NVIDIA GeForce GTX 780M, with 11230 MB memory and 2304 cores with clock frequency 862 MHz. Figure 3 shows the reconstruction results of four different frames (out of 11) of cardiac cine data at AF=8. Central line profiles of the same frames are shown in Figure 4 (a-c). The convergence graph is shown in Figure 4 (d) depicts the number of iterations required to meet the stopping criterion for both the proposed and Otazo’s methods4. Table 1 provides a comparison of the proposed method and Otazo’s method4 in terms of quantifying parameters. Table 2 provides a comparison of the reconstruction times for the CPU and GPU implementation of the proposed and Otazo’s methods4.Table 2 shows the overall reconstruction time of the L+S algorithm as well as computation times of the prominent functions in the L+S algorithm (shown in Figure 1). The reduced computation time by using GPU depicts that the proposed method is highly parallelizable as compared to Otazo’s method4. The results show an improved performance of the proposed method in terms of efficient MR image reconstruction, fast convergence, and more parallelism as compared to Otazo’s method4.
CONCLUSION
The proposed method demonstrates robust separation of data-matrix into low-rank and sparse components. The proposed method is computationally efficient to estimate the low-rank SVD of the large matrix from a small, compressed set of measurements. The proposed method is highly parallelizable and can achieve further speed-up on GPUs using memory optimization.Acknowledgements
I would like to thank Higher Education Commission (HEC), Pakistan for providing me with funds for research work. I am also thankful to Medical Image Processing Research Group(MIPRG) COMSATS University Islamabad Pakistan, for providing me the excellent environment and computational resources for research work.
References
1. Larkman, D.J. and R.G. Nunes, Parallel magnetic resonance imaging. Physics in Medicine & Biology, 2007. 52(7): p. R15.
2. Lustig, M., D. Donoho, and J.M. Pauly, Sparse MRI: The application of compressed sensing for rapid MR imaging. Magnetic Resonance in Medicine: An Official Journal of the International Society for Magnetic Resonance in Medicine, 2007. 58(6): p. 1182-1195.
3. Otazo, R., et al., Combination of compressed sensing and parallel imaging for highly accelerated first‐pass cardiac perfusion MRI. Magnetic resonance in medicine, 2010. 64(3): p. 767-776.
4. Otazo, R., E. Candes, and D.K. Sodickson, Low‐rank plus sparse matrix decomposition for accelerated dynamic MRI with separation of background and dynamic components. Magnetic resonance in medicine, 2015. 73(3): p. 1125-1136.
5. Benjamin Erichson, N., S.L. Brunton, and J. Nathan Kutz. Compressed singular value decomposition for image and video processing. in Proceedings of the IEEE International Conference on Computer Vision Workshops. 2017.
6. Candes, E.J., J.K. Romberg, and T. Tao, Stable signal recovery from incomplete and inaccurate measurements. Communications on Pure and Applied Mathematics: A Journal Issued by the Courant Institute of Mathematical Sciences, 2006. 59(8): p. 1207-1223.
Figures