4310
Identification of NF2 loss in meningiomas using 1H-MRS at 3T1Institute of Biomedical Engineering, Bogazici University, İstanbul, Turkey, 2Institute of Biomedical Engineering, Bogazici University, Istanbul, Turkey, 3Health Institutes of Turkey, İstanbul, Turkey, 4Department of Medical Pathology, Acıbadem Mehmet Ali Aydınlar University, İstanbul, Turkey, 5Center for Neuroradiological Applications and Reseach, Acıbadem Mehmet Ali Aydınlar University, İstanbul, Turkey, 6Department of Medical Engineering, Acıbadem Mehmet Ali Aydınlar University, İstanbul, Turkey, 7Department of Neurosurgery, Acıbadem Mehmet Ali Aydınlar University, İstanbul, Turkey, 8Department of Radiology, Acıbadem Mehmet Ali Aydınlar University, İstanbul, Turkey
Synopsis
Loss of neurofibromatosis 2 (NF2-L) is a well-known genetic alteration of meningiomas and causes meningiomas to evolve into more aggressive and infiltrating form. This study aims to investigate single-voxel proton magnetic resonance spectroscopy (1H-MRS) correlations of NF2-L in meningiomas and to develop machine learning and deep learning models to identify NF2-L in meningiomas. NF2-L meningiomas had significantly higher Ins, Lac, and Ins+Glyc, and lower tNAA than tumors with no copy number loss. While a subspace discriminant model achieved a classification accuracy of 77.25%, a 1D-CNN model obtained a classifcation accuracy of 88.9% for identifying NF2-L meningiomas.
Introduction
Neurofibromatosis 2 is known as a tumor suppressor gene on chromosome 22 and an alteration of this gene might cause inactivation of the gene and tumor formation [1]. NF2 loss (NF2-L) is a well-known genetic alteration of meningiomas seen in 40% to 60% of meningiomas [2]. Previous studies have shown that NF2-L meningiomas have evolved into more aggressive and infiltrating forms [3-5]. Preoperative and noninvasive detection of NF2-L might be a valuable adjunct to meningioma management. This study aims to look at correlates of NF2-L in meningiomas and single-voxel proton magnetic resonance spectroscopy (1H-MRS) findings and to develop machine learning and deep learning models to identify NF2-L in meningiomas.Methods
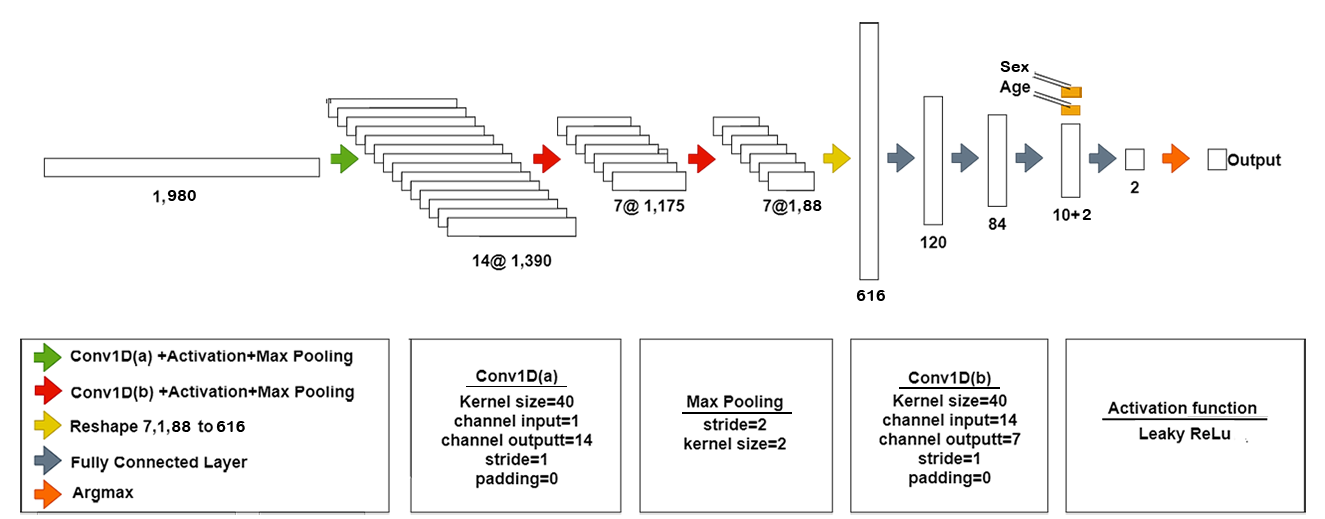
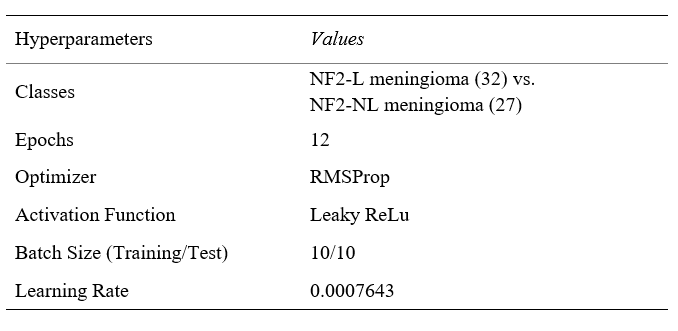
Fifty-nine surgically treated meningioma patients (17 men/42 women, mean age: 52.22±14.14 years, range: 18-80 years) were included in this study. Histopathologically, 21 patients were grade I, 36 patients were grade II and two patients were grade III. The patients were scanned before surgery at a 3T clinical MR scanner (Siemens Healthcare, Erlangen, Germany) using a 32-channel head coil. 1H-MRS data was acquired from the volume of interest manually placed on the solid tumor region excluding necrosis or hemorrhage using a Point Resolved Spectroscopy (PRESS) sequence (TR/TE=2000/30 ms, voxel size=1-8 cm3). Based on the assessment of surgical specimen, 32 of the tumors were NF2-L and 27 of them had no copy number loss (NF2-NL), as determined by digital droplet PCR using pre-validated Taq-man probes. MRS peak concentrations of main metabolites were quantified using LCModel spectral fitting program [6]. The metabolites with a Cramer-Rao lower bound (CRLB) of more than 30% were excluded from the study. A Mann-Whitney U test was used to assess metabolic differences between NF2-L and NF2-NL meningiomas. Both machine learning and deep learning approaches were adopted to classify meningiomas based on NF2-L. First, machine-learning algorithms were employed to identify NF2-L meningiomas using most informative metabolites defined by least absolute shrinkage and selection operator (Lasso) [7]. Then, fitted spectra, obtained as an output of LCModel, were used in a 1D-CNN model to identify NF2-L. Before the classification with 1D-CNN, fitted spectra underwent preprocessing steps including L2 normalization, smoothing (Savitzky-Golay filter (window size=11, order=2)), Yeo-Johnson power transformation, and min-max normalization [8]. The architecture of the proposed model is shown in Figure 1. Cross-entropy loss was used during the training of the model. Optuna [9] was employed for hyperparameter tuning of the model with 50 trials and the optimized parameters are shown in Table 1. All the computations in statistical analysis and machine learning classification were performed in Matlab and the 1D-CNN model was developed in Python.Results
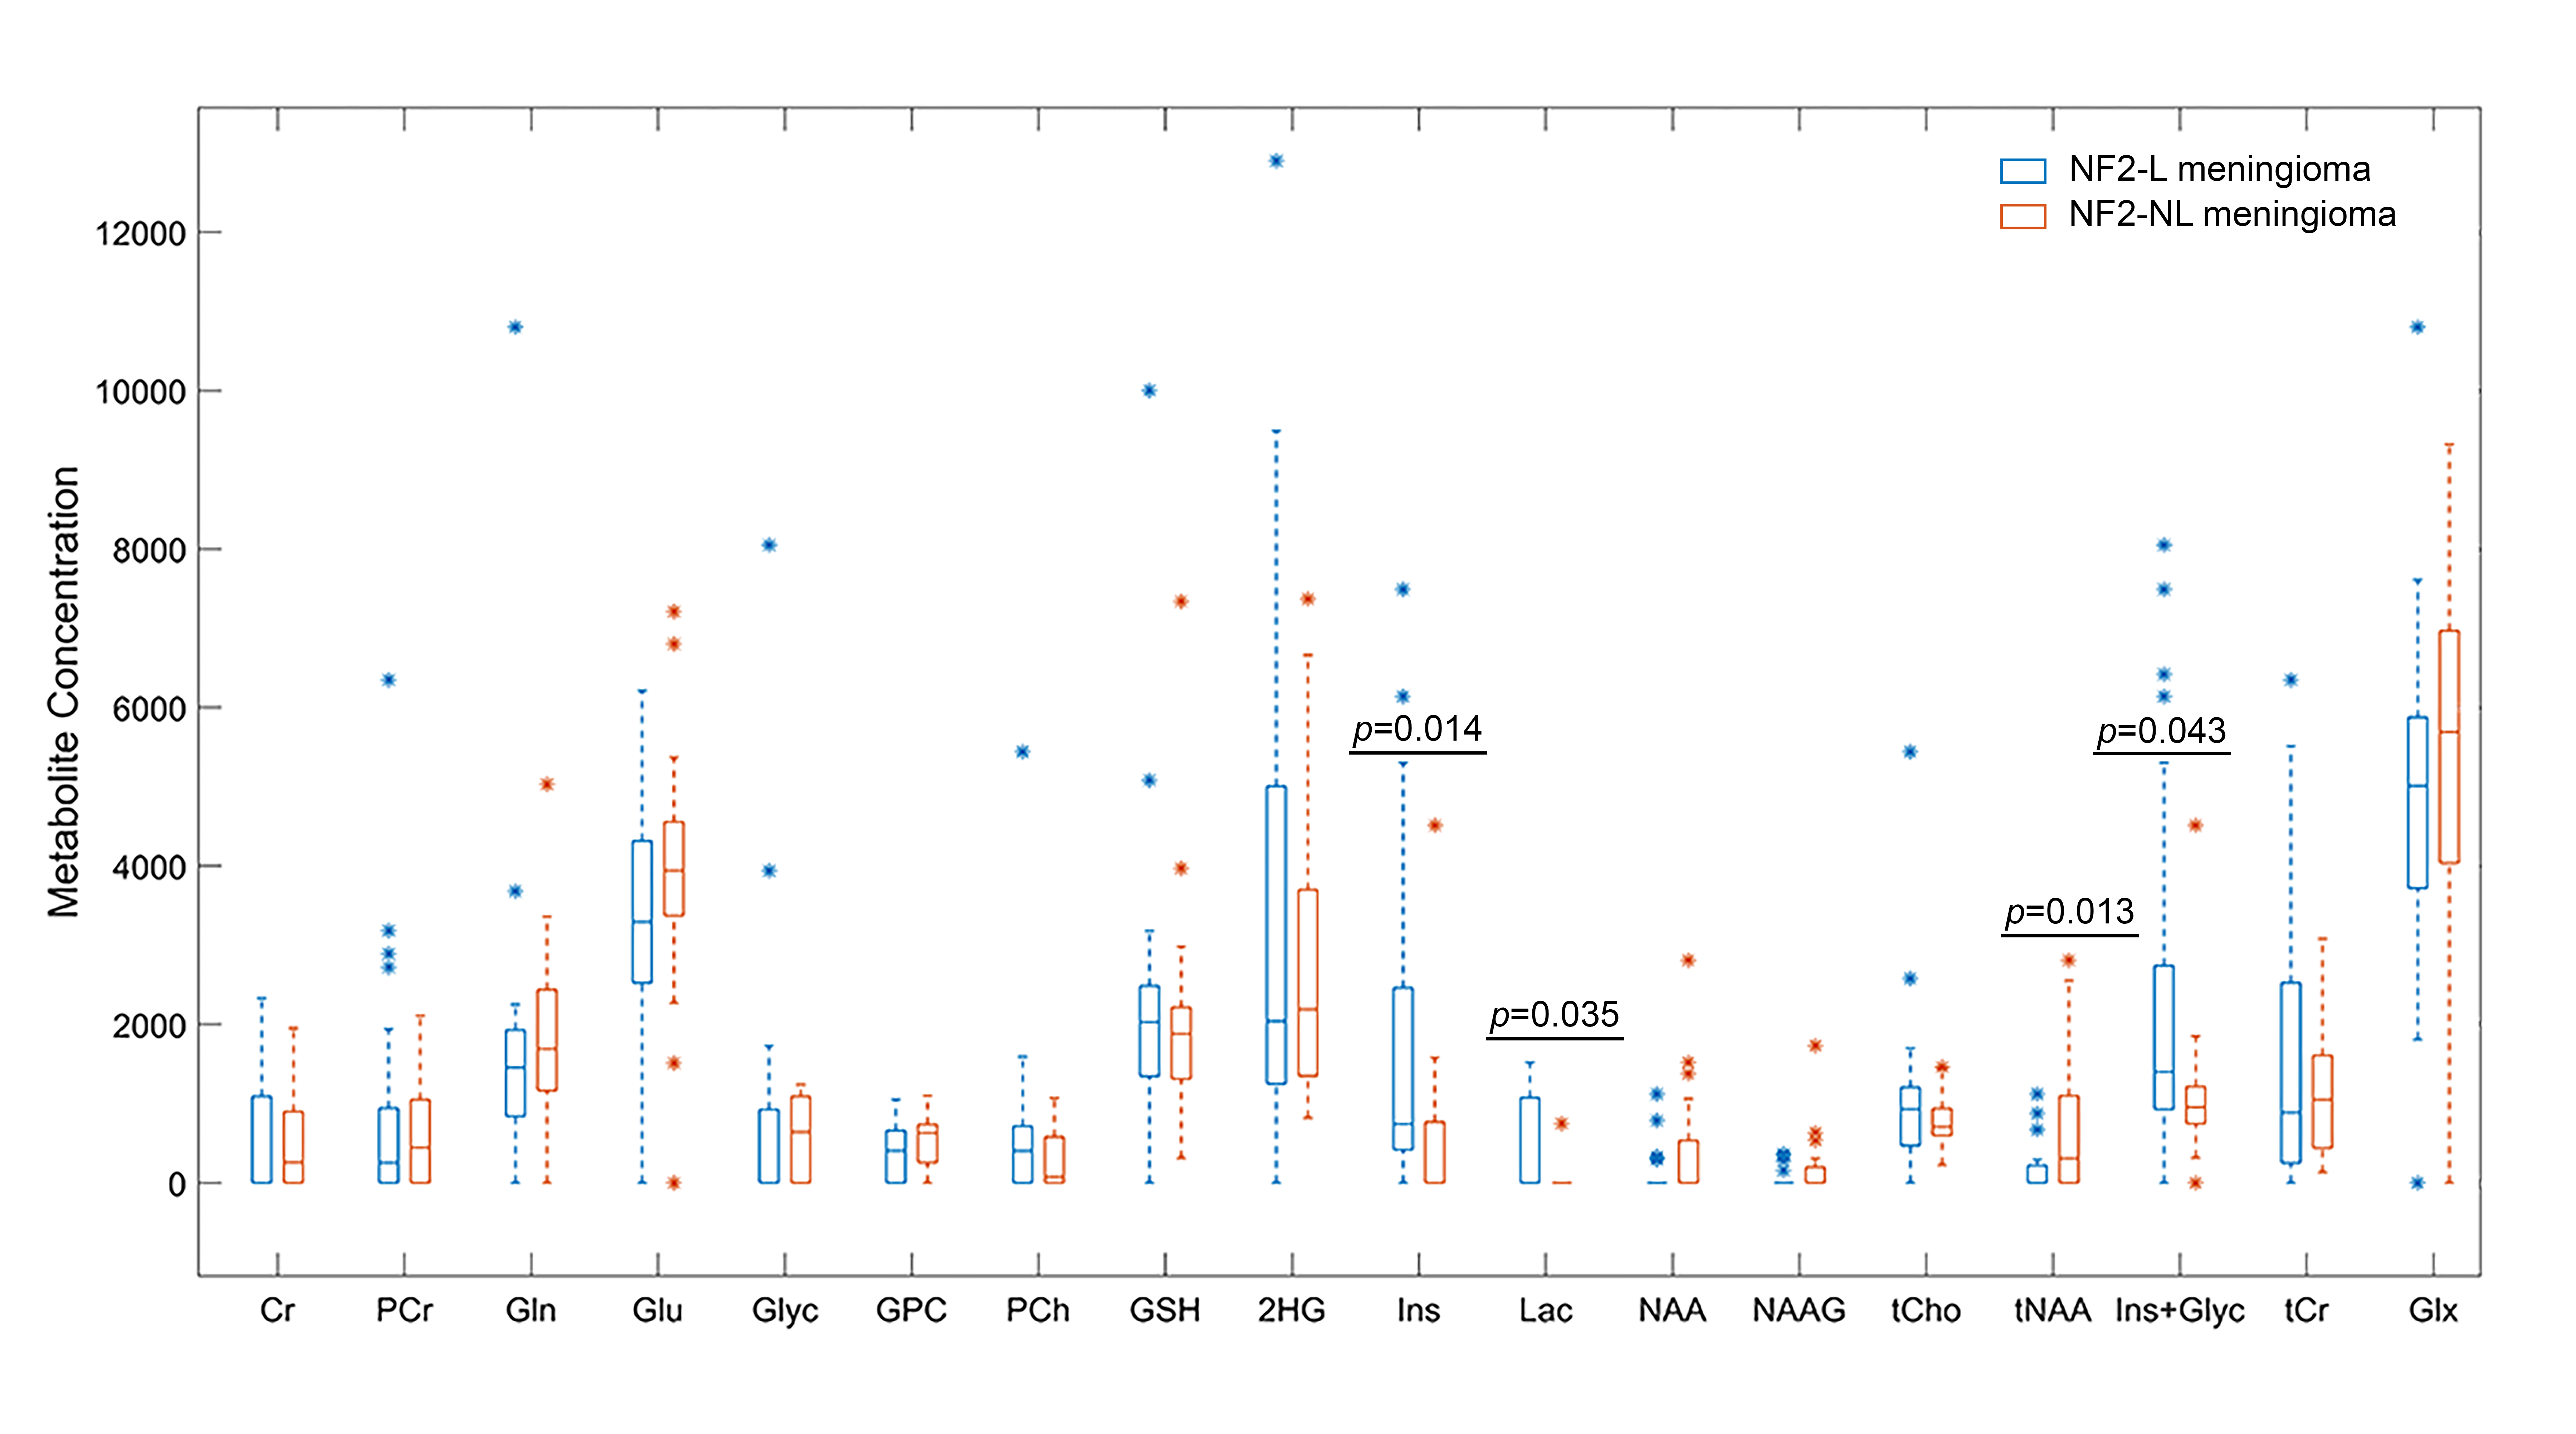
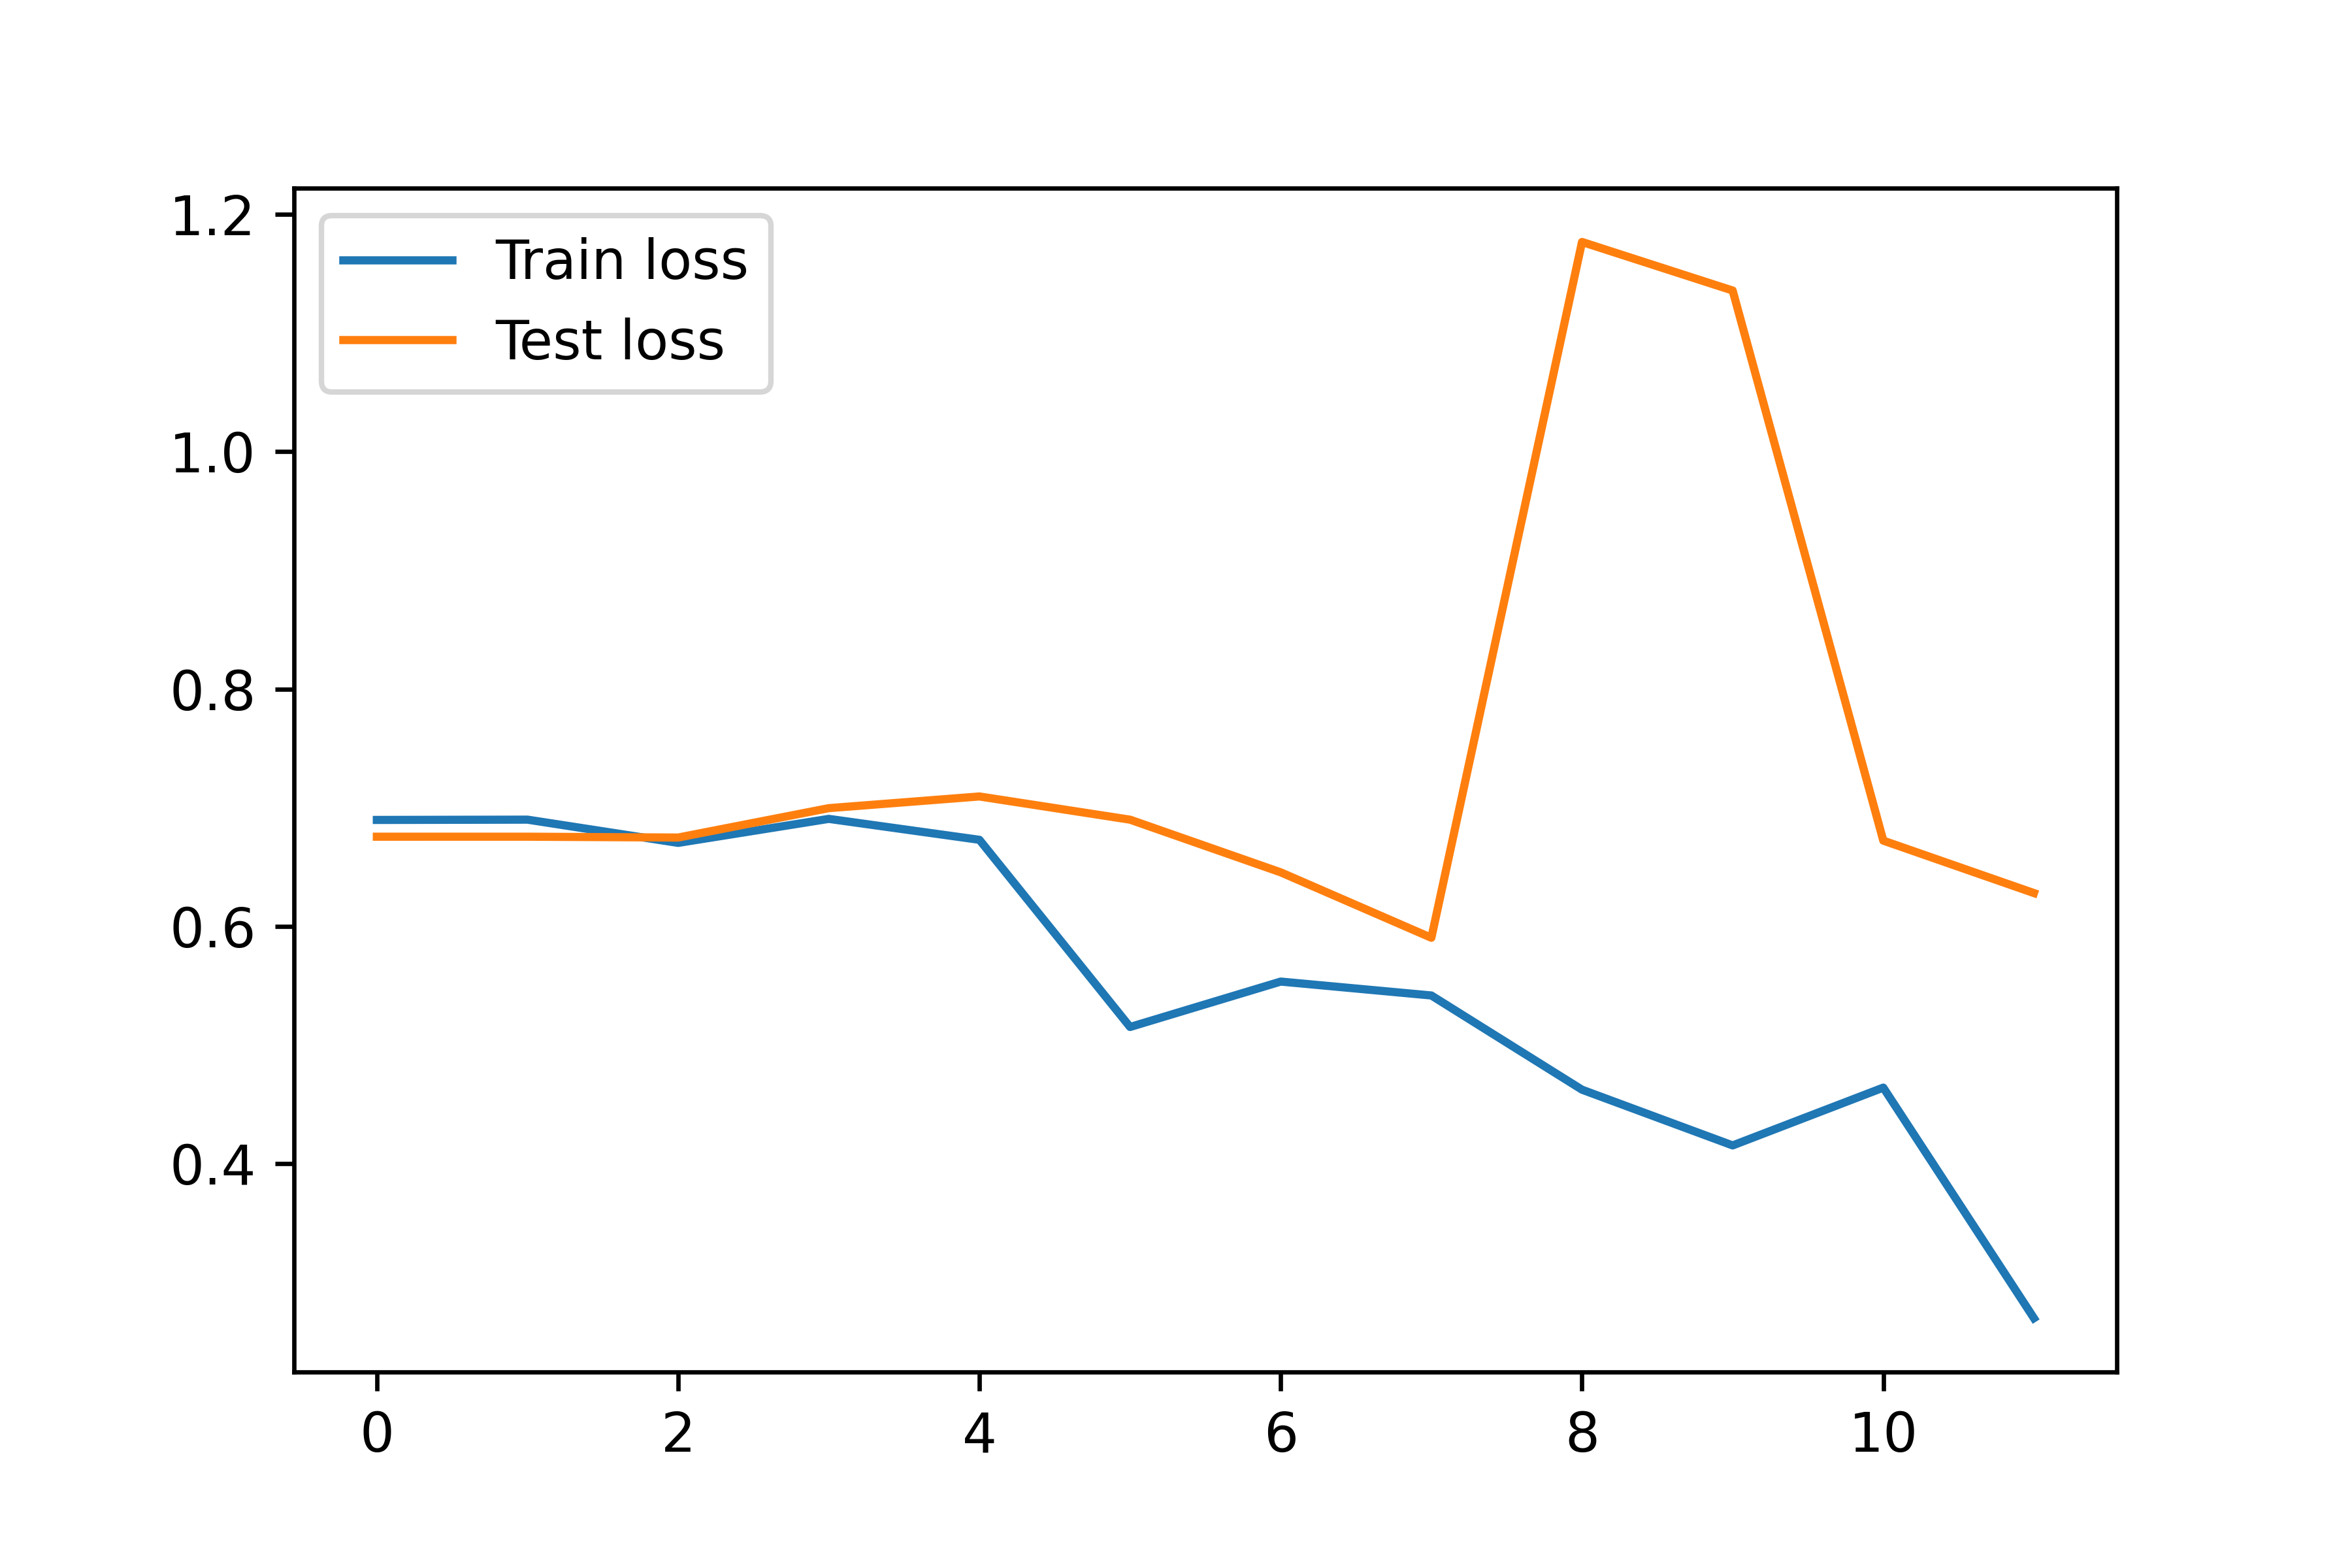
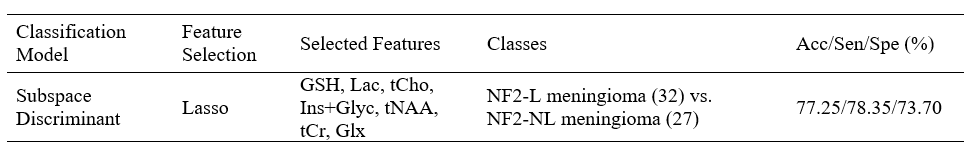
The metabolite peak intensity comparisons between NF2-L and NF2-NL meningiomas are shown in Figure 2. NF2-L meningiomas had higher myo-inositol (Ins; p=0.014), lactate (Lac; p=0.035), myo-inostol+glycine (Ins+Glyc; p=0.043) and lower total N-acetyl aspartate (tNAA; p=0.013) than NF2-NL meningiomas. Table 2 shows accuracy, sensitivity, and specificity results of some machine learning models along with the feature selection method, and selected metabolites for the classifications of meningiomas based on NF2-L. A subspace discriminant model achieved the highest accuracy of 77.25% using glutathione (GSH), Ins, Lac, total choline (tCho), tNAA, total creatine (tCr), and glutamine-glutamate complex (Glx) concentrations (sensitivity=78.35%, specificity=73.70%). Figure 3 shows the train and test losses of the proposed 1D-CNN model for 12 epochs. The accuracy of the proposed model was 88.9% (specificity=75%, sensitivity=100%).Discussion and Conclusion
The current study detected significant metabolic correlates of NF2-L in meningiomas. NF2-L meningiomas had significantly higher Ins, Lac, and Ins+Glyc, and lower tNAA. These metabolites were also useful along with GSH, tCho, tCr and Glx to identify NF2-L meningiomas using machine learning algorithms. Higher glycine promote sustained angiogenesis in meningiomas and might play a critical role in the growth of cancer [10]. Moreover, lactate accumulation creates a microenvironment that may enhance cell proliferation [10]. The results of this study also indicated that NF2-L in meningiomas could be detected accurately using 1H-MRS and machine learning approaches. Identifying NF2-L using deep learning models instead of classical machine learning algorithms increased the classification accuracy and decreased computational burden. Further analysis using a larger patient cohort is currently being conducted.Acknowledgements
This study was supported by the Scientific and Technological Research Council of Turkey (TUBITAK) grant 119S520.References
1. Kros, J., et al., NF2 status of meningiomas is associated with tumour localization and histology. J Pathol, 2001. 194(3): p. 367-72.
2. Clark, V.E., et al., Genomic analysis of non-NF2 meningiomas reveals mutations in TRAF7, KLF4, AKT1, and SMO. Science, 2013. 339(6123): p. 1077-80.
3. Goutagny, S. and M. Kalamarides, Meningiomas and neurofibromatosis. Journal of Neuro-Oncology, 2010. 99(3): p. 341-347.
4. Aboukais, R., et al., Intracranial meningiomas and neurofibromatosis type 2. Acta Neurochir (Wien), 2013. 155(6): p. 997-1001; discussion 1001.
5. Harmancı, A.S., et al., Integrated genomic analyses of de novo pathways underlying atypical meningiomas. Nature Communications, 2017. 8(1): p. 14433.
6. Provencher, S.W., Automatic quantitation of localized in vivo 1H spectra with LCModel. NMR Biomed, 2001. 14(4): p. 260-4.
7. Tibshirani, R., Regression Shrinkage and Selection via the Lasso. Journal of the Royal Statistical Society. Series B (Methodological), 1996. 58(1): p. 267-288.
8. Engel, J., et al., Breaking with trends in pre-processing? TrAC Trends in Analytical Chemistry, 2013. 50: p. 96-106.
9. Akiba, T., et al., Optuna: A Next-generation Hyperparameter Optimization Framework, in Proceedings of the 25th ACM SIGKDD International Conference on Knowledge Discovery & Data Mining. 2019, Association for Computing Machinery: Anchorage, AK, USA. p. 2623–2631.
10. Monleon, D., et al., Metabolic aggressiveness in benign meningiomas with chromosomal instabilities. Cancer Res, 2010. 70(21): p. 8426-34.
Figures