4304
Radiomic feature-based assessment of deep learning-based compressed sensing reconstruction1Graduate School of Science and Technology, University of Tsukuba, Tsukuba, Japan, 2Department of Radiology, University of Yamanashi, Chuo, Japan
Synopsis
Deep
learning has been attracting attention as a new tool for image reconstruction.
However, there is a lack of appropriate automatic evaluation metrics for
reconstruction performance of small structures such as lesions, which poses a
high hurdle for clinical application. Here, we explored the relationship
between radiomic features of tumors and various DL reconstruction conditions,
and proposed a new method based on radiomics to evaluate the reconstruction
performance of DL against lesions. Based on the analysis using the concordance
correlation coefficients for ground truth images, we explored several texture
features that are sensitive to differences in reconstruction methods and
conditions.
INTRODUCTION
Deep learning-based compressed sensing (DL-CS) reconstruction has the potential to outperform existing methods based on sparse regularization. However, its clinical application remains a challenge, because DL-CS may have instabilities in image reconstruction [1], for example, small structural changes such as tumors may not be captured in the reconstructed image. Therefore, it is important to accurately evaluate image restoration quality for individual lesions, but it cannot be performed using traditional numeric metrics such as peak signal-to-noise ratio (PSNR) and structural similarity (SSIM), which measure the average accuracy of the entire image.Here we propose a new strategy for evaluating DL-CS image reconstruction in terms of lesion restoration accuracy using radiomic features. Radiomics is a method to characterize lesions (e.g. tumor phenotypes) using a large number of quantitative image features [2]. In this study, we applied radiomics to texture analysis of lesions in reconstructed images. We assessed the sensitivity of the radiomic features computed from restored lesions by varying CS-deep neural networks (DNNs), acceleration factors (AFs), and sampling patterns, and to find the suitable radiomic features for evaluation of the DL-CS reconstruction performance.
METHODS
DatasetA GE 3T SIGNA Premier and a 48-channel coil were used to acquire raw data of brain multi-slice 2D FLAIR. The number of phase encodings was 192, acceleration factors (AFs) were 3 and 4, and data were undersampled retrospectively with random and regular patterns. A total of 2536 slices from 97 cases were used for training and 651 slices from 25 cases were used for testing.
CS-deep neural networks (DNNs)
We used one non-DL reconstruction [parallel imaging-CS reconstruction (PICS) with L1 regularization term [3]], and three DL reconstructions [variational network (VN) [4], MoDL [5], and UNet [6]]. For VN, the epoch was 50 and batch size was 2. For MoDL, the epoch was 50 and batch size was 1. For UNet, the epoch was 100 and batch size was 2.
Numeric metrics test
As numerical indices of image quality, the mean values of PSNR and SSIM in all cases were calculated.
Texture analysis
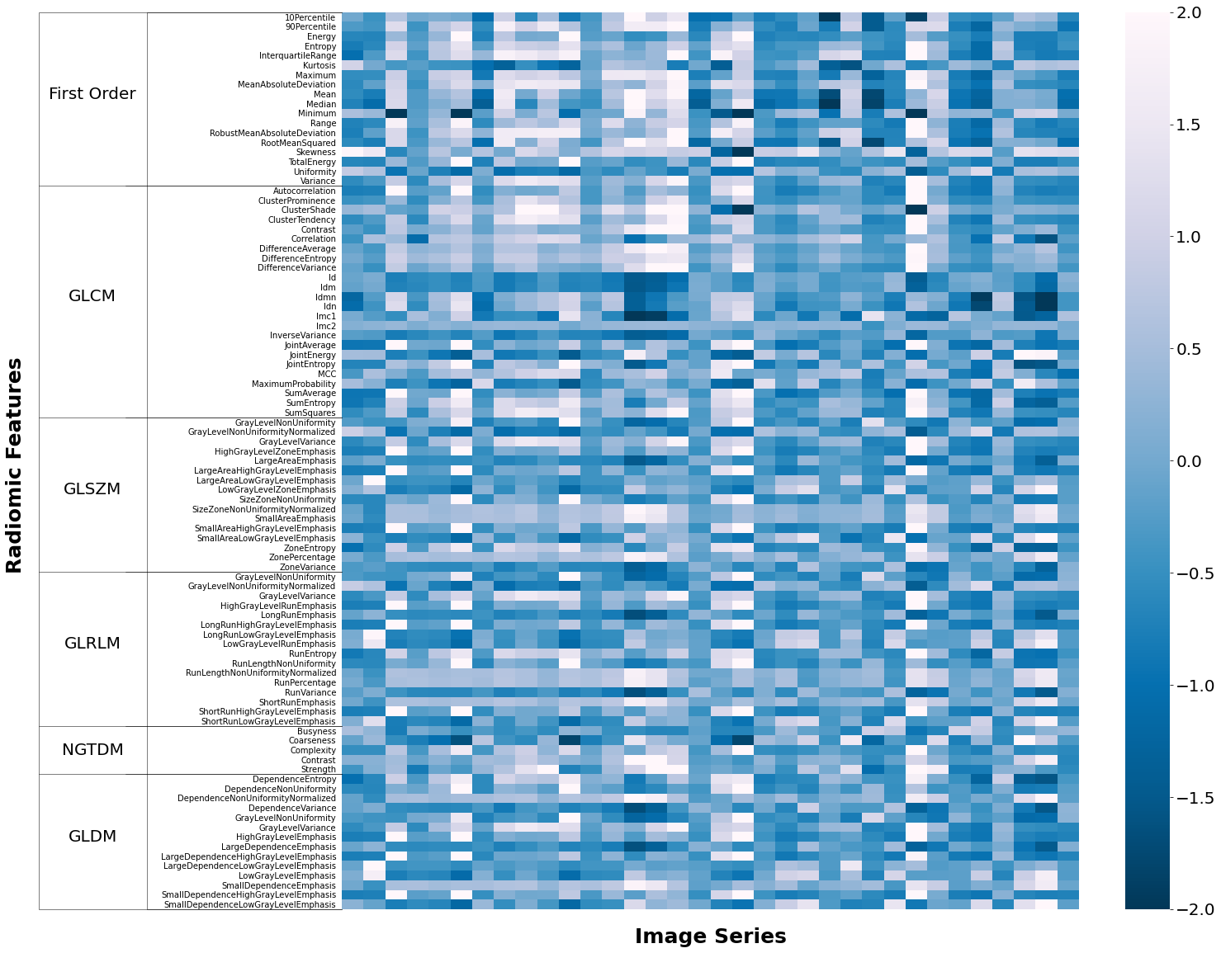
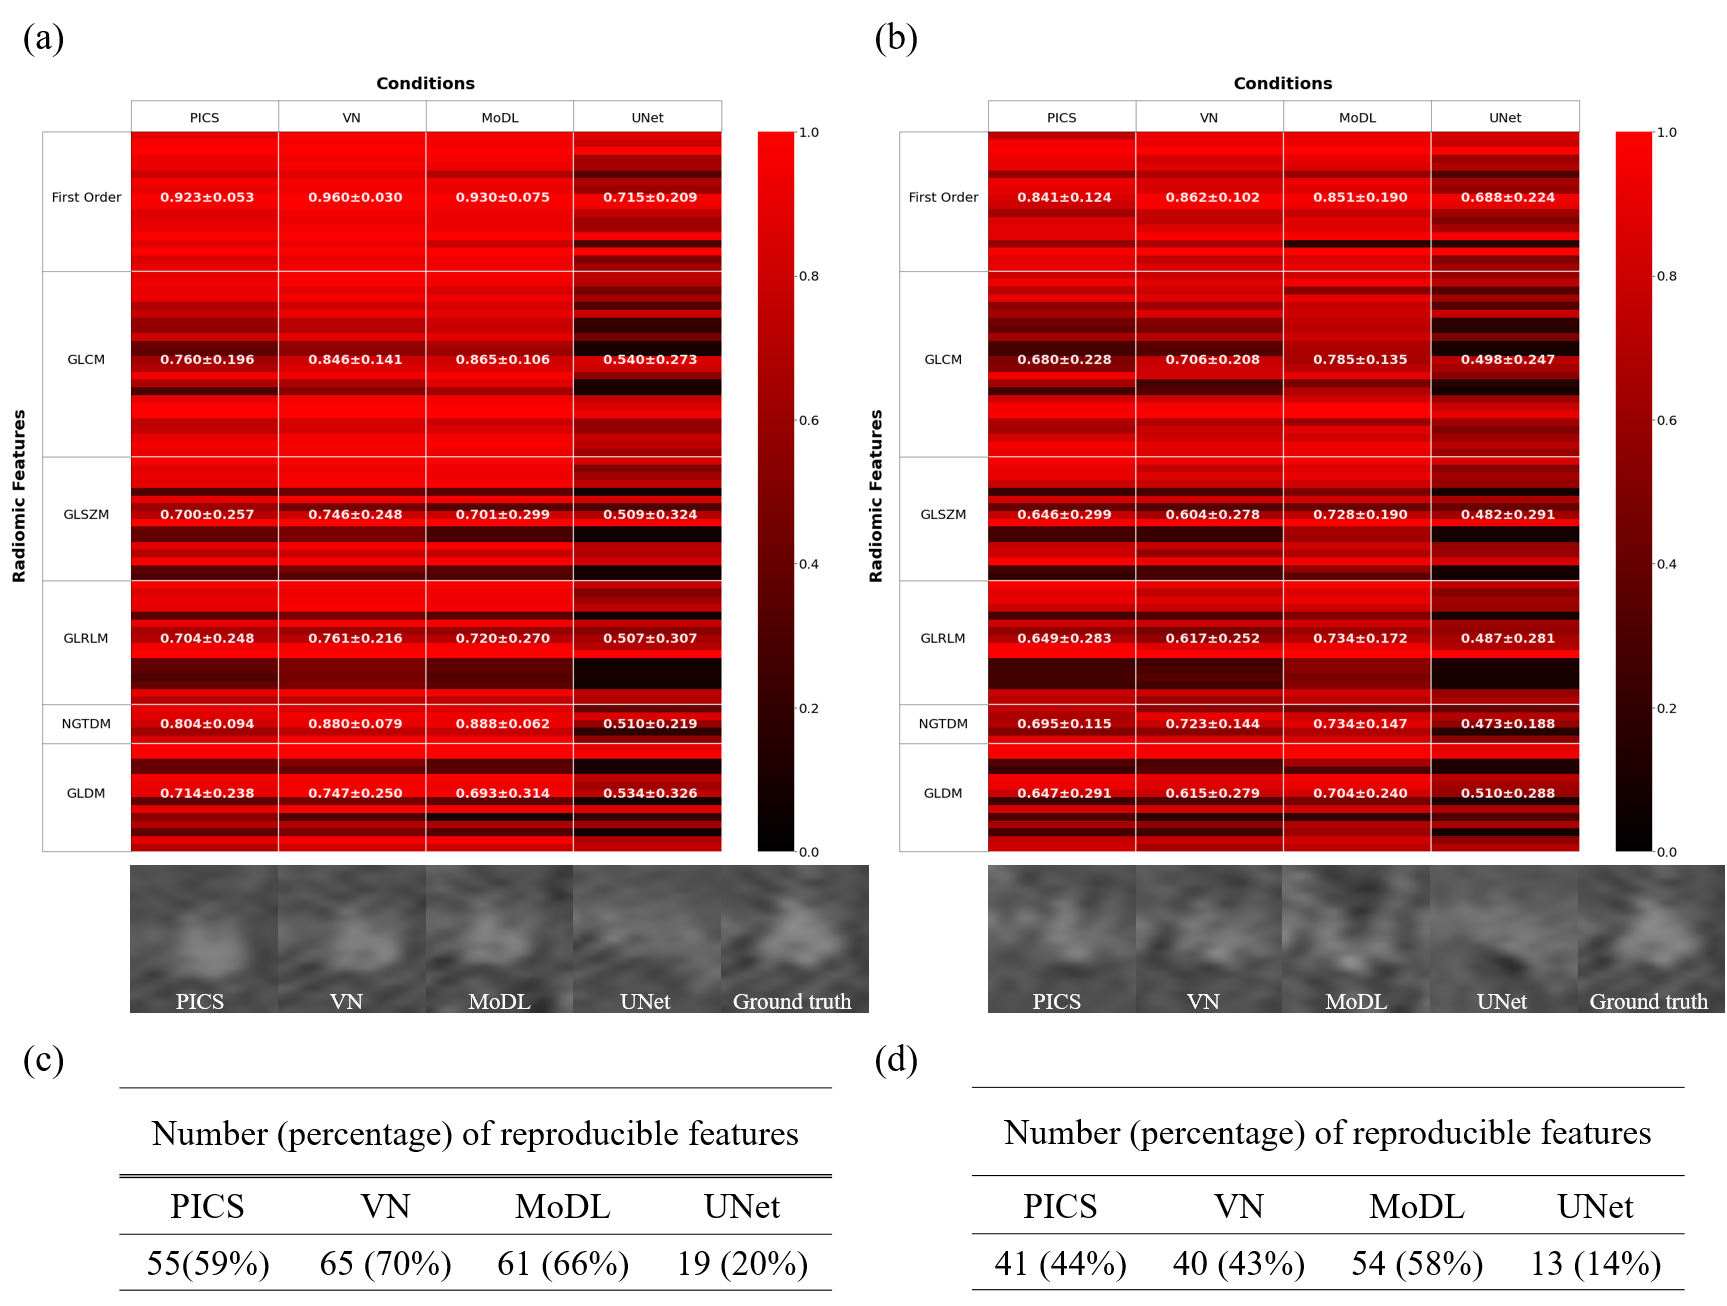
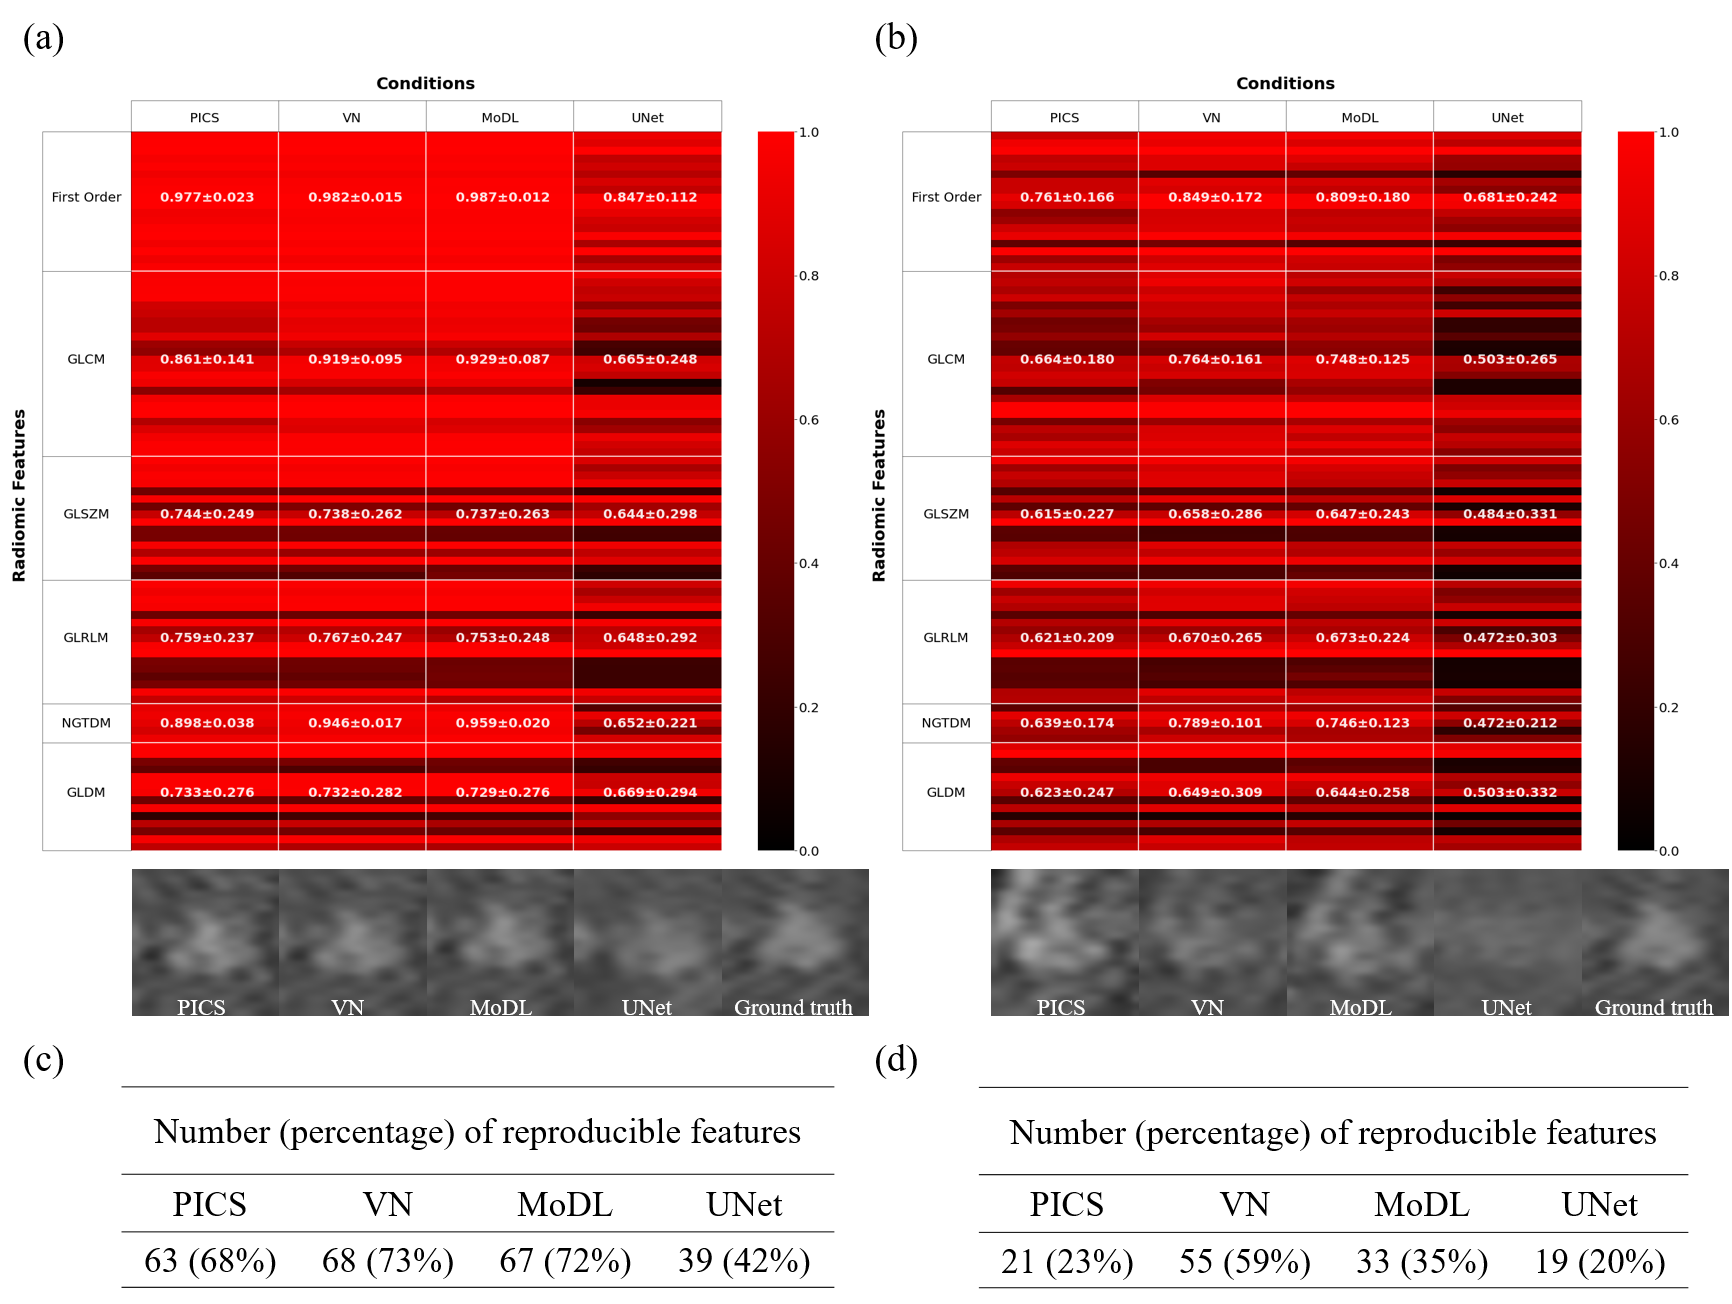
We manually segmented 34 randomly selected rectangular areas surrounding lesions (2 for each patient) from 17 of the cases used for testing. For each reconstructed segmentation image, 93 radiomic features were calculated using pyradiomics [7]. After the radiomic features were z-score transformed, the concordance correlation coefficients (CCCs) were used to evaluate the concordance of radiomic features between each reconstructed images and ground truth (GT) images. A CCC value of 0.8 was used as the threshold to assess the reproducible radiomic feature, indicating the good agreement of the reconstructed image with the GT images, and the numbers of the features above the threshold were counted for each condition.
RESULTS
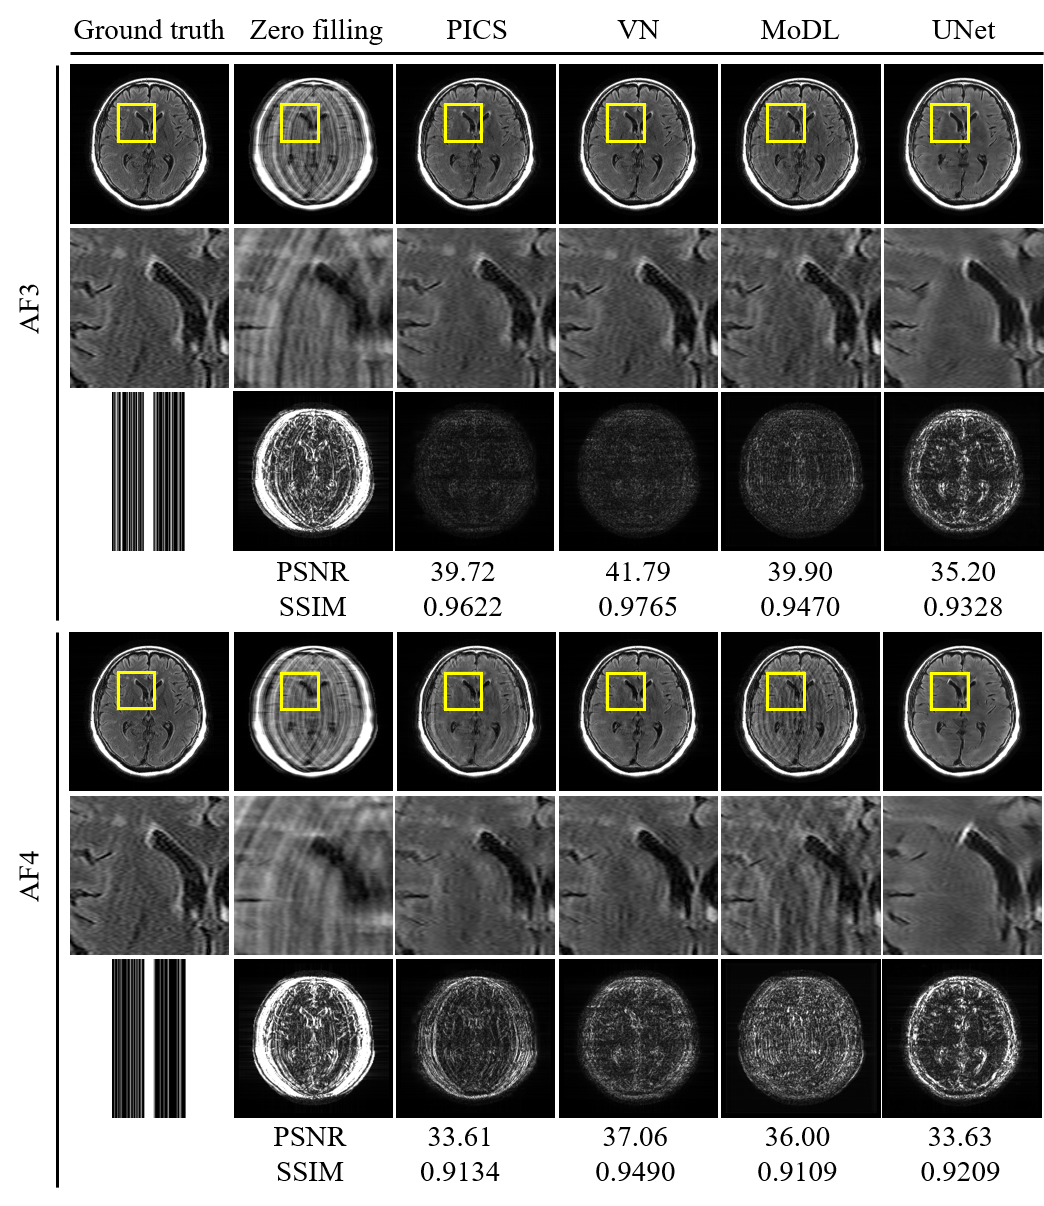
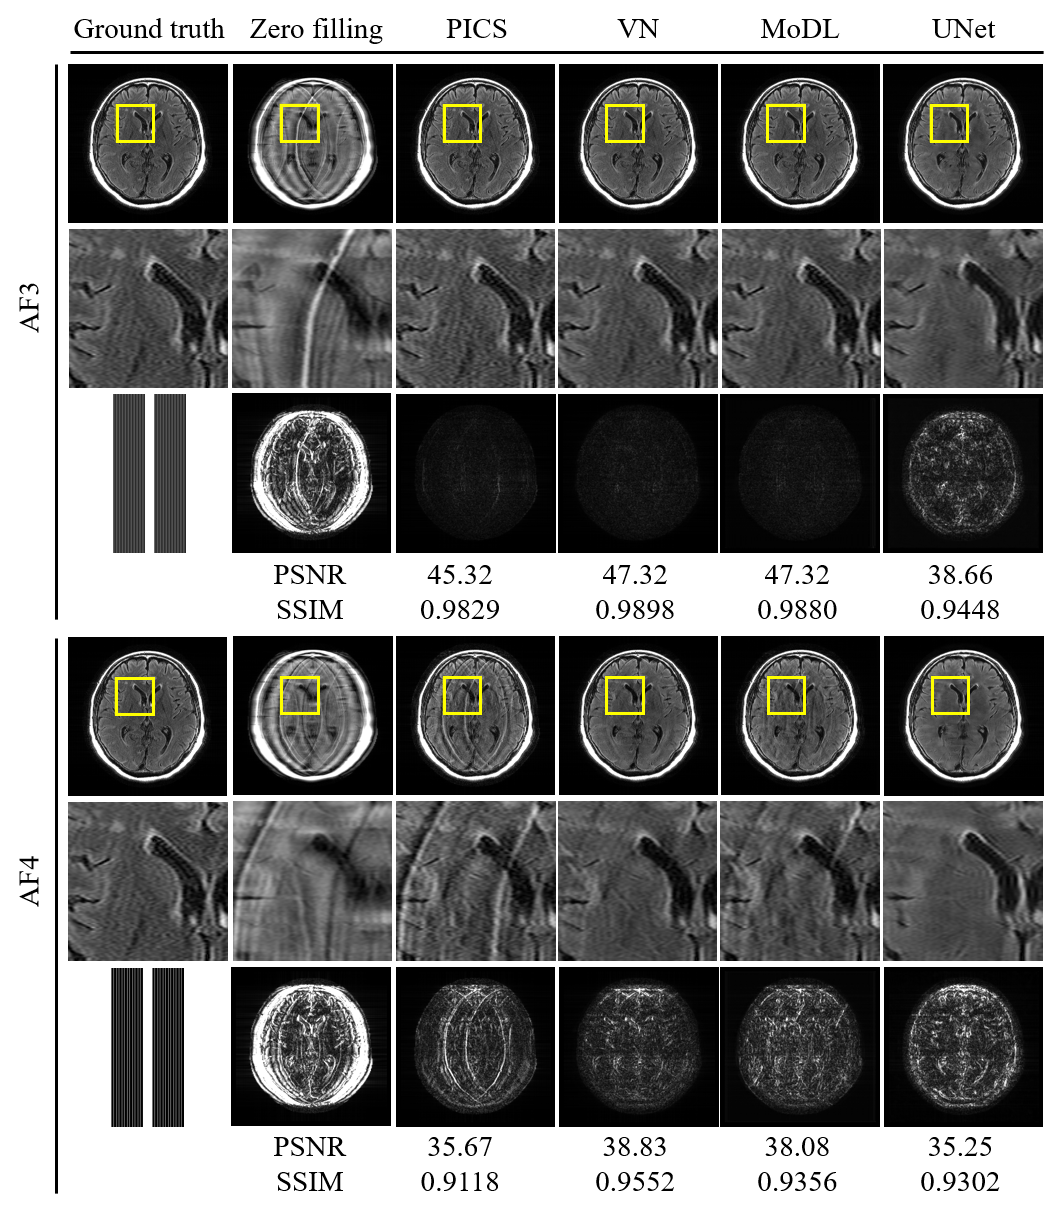
Comparison of reconstructed images (Figs. 1 and 2) revealed the overall perceptual trend of the reconstruction performance between the different DNNs, AFs, and sampling patterns. The average SSIM and PSNR values were lowest for UNet and higher for MoDL and VN, and were lower for larger AFs and higher for regular sampling than for random sampling.The radiomic feature maps computed for 34 lesions in the GT images is depicted in Fig. 3. The CCC heat maps of radiomic features computed from the reconstructed images are depicted in Figs. 4 and 5. In these heat maps, the brighter the red color, the higher the CCC value and the higher the similarity with the GT images. The sensitivity of radiomics features to different reconstruction conditions was varied, with some features having higher sensitivity (fast order and GLCM features) and others having lower sensitivity (GLSZM, GLRLM, and GLDM features). These sensitive CCCs showed the same perceptual tendencies to the reconstruction condition as seen in Figures 1 and 2. The exception was the CCC values for the UNet reconstruction, where almost all texture features were low compared with the other reconstruction methods.
The numbers of the reproducible radiomic features were higher for VN and MoDL than for UNet, higher for AF3 than for AF4, and higher for the regular sampling than for the random sampling.
DISCUSSION
The CCC heatmap results showed that the fast order and GLCM texture features were strongly affected by the reconstruction condition, and that the trend was plausible and consistent with perceptual trends and PSNR and SSIM. UNet is a single-coil data-driven network, while VN and MoDL are multicoil model-based networks, and in general, the latter have been found to show higher performance than the former. It is important to note that this trend is also observed in fast order and GCLM radiomics features. The number of reproducible radiomic features could be a good measure of the restoration quality of the lesions in the CS-DL images.CONCLUSION
We found that the fast order and GCLM radiomics features were sensitive to difference in the reconstruction condition, and the CCC analysis can be used to measure reconstruction performance under different reconstruction conditions.Acknowledgements
No acknowledgement found.References
[1] Antun, V., et al., On instabilities of deep learning in image reconstruction and the potential costs of AI, Natl. Acad. Sci., 117(48): 30088-30095, 2020.
[2] Zhao, B., et al., Reproducibility of radiomics for deciphering tumor phenotype with imaging, Sci. Rep., 6(23428), https://doi.org/10.1038/srep23428, 2016.
[3] Uecker. M., et al., BART Toolbox for Computational Magnetic Resonance Imaging, Zenodo, DOI: 10.5281/zenodo.592960.
[4] Hammernik, K., et al., Learning a Variational Network for Reconstruction of Accelerated MRI Data, Magn. Reson. Med., 79(6): 3055-3071, 2018.
[5] Aggarwal, H. K., et al., MoDL ; Model Based Deep Learning Architeccture for Inverse Problems, IEEE Trans. Med. Imaging, 38, 394-405, 2019.
[6] Ronneberger, O., et al., U-Net ; Convolutional Networks for Biomedical Image Segmentation, MICCAI 2015, 9351: 234-241, 2015.
[7] van Griethuysen, J. J. M., et al., Computational Radiomics System to Decode the Radiographic Phenotype. Cancer Research, 77(21), e104–e107, https://doi.org/10.1158/0008-5472.CAN-17-0339, 2017.
Figures