4300
Value of Amide Proton Transfer Combined with Dynamic Contrast-Enhanced MRI in Predicting Pathological Features of cervical cancer11. Department of Radiology, Department of Radiology, The First Affiliated Hospital, Dalian Medical University, Dalian, China, 21.Department of Radiology, The First Affiliated Hospital, Dalian Medical University 2. Dalian Engineering Research Center for Artificial Intelligence in Medical Imaging, Dalian, China, 3Department of Radiology, The First Affiliated Hospital, Dalian Medical University, Dalian, China
Synopsis
The proper evaluation of pathological features including differentiation degree, deep stromal invasion (DSI) and vascular space invasion (VSI) is vital for patients with cervical cancer. Amide Proton Transfer (APTW) and Dynamic Contrast-Enhanced MRI (DCE-MRI) were used to predict tumor differentiation, DSI and VSI. Results showed that combined APTW and DCE-MRI predicted VSI with good performance. Therefore, combination of APTW and DCE-MRI is potentially a promising and valuable non-invasive method in detection for predicting VSI.
Introduction
It is vital for predicting tumor histologic grades, DSI and VSI preoperatively of cervical cancer as these features are related to treatment and prognosis [1-3], however, it remains challenge since pathological features are diagnosed by histologic examine. APTW technique is a promising MRI tool to reflect the characteristics of lesions by detecting the content of free proteins and polypeptides in tissues [4]. DCE-MRI have been explored for cervical carcinoma staging [5]. Therefore, combination of APTW and DCE-MRI is potentially a promising and valuable non-invasive method in detection for predicting pathological features preoperatively. In this study, we investigated the value of APTW combined with DCE-MRI in predicting differentiation degree, DSI and VSI in cervical cancer.Methods
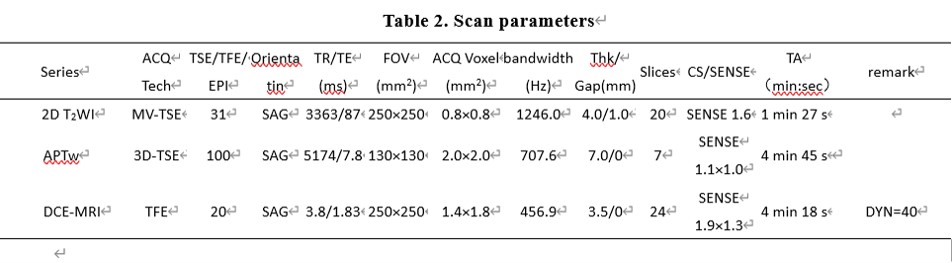
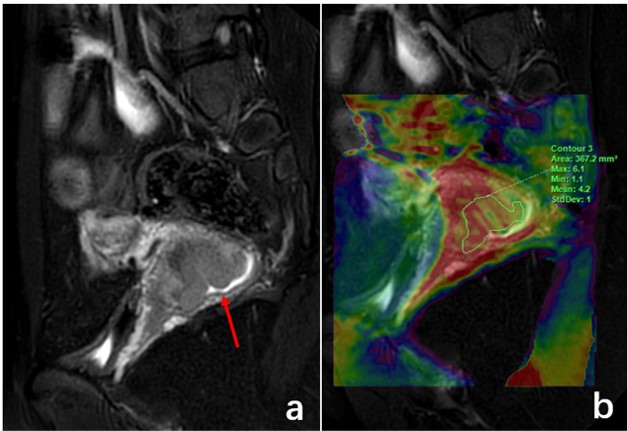
A total of 35 cervical cancer patients (mean age: 52.4 ± 11.4 range: 32-68 years) who underwent APTW and DCE-MRI were retrospectively included in this study, the clinical characteristics of patients were listed in Table 1. All patients were scanned using a 3.0 T MR scanner (Ingenia CX, Philips Healthcare, the Netherlands) with a seven-channel bilateral phase-array breast coil (Scan parameters show in Table 2). The regions of interest (ROIs) were manually drawn on the pseudo-color images of the APTWI merged with the sagittal T2W images. ROIs were placed on the slice with maximal area of tumors according to fat-suppression T2WI avoiding the cystic and necrotic area, and obtained APTmean (Figure 1). Observers then manually drew an ROI at the largest level of the primary tumor on DCE-MR images. Quantitative DCE-MRI parameters (Ktrans, Kep, and Ve) were generated. Intra-group correlation coefficient (ICC) was used to test the measurement consistency between the two observers. The mean APT values, DCE-MRI parameters from two readers were averaged and used as final values. The Kolmogorov-Smirnov test was used to examine whether the data followed a normal distribution. Student t test was used to examine the differences between the positive and negative group. Receiver operating characteristic (ROC) analysis was used to compare the predicted performance of all the parameters for the differentiation of positive from negative group. Logistic regression was used for multivariate analysis for finding he independent risk factors.Results
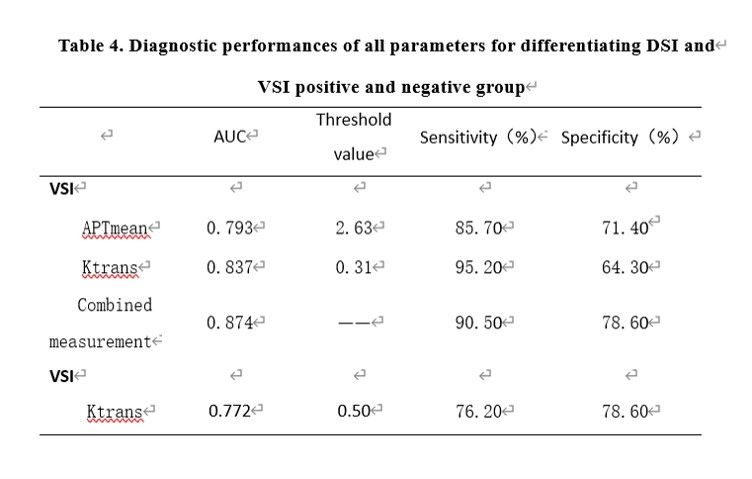
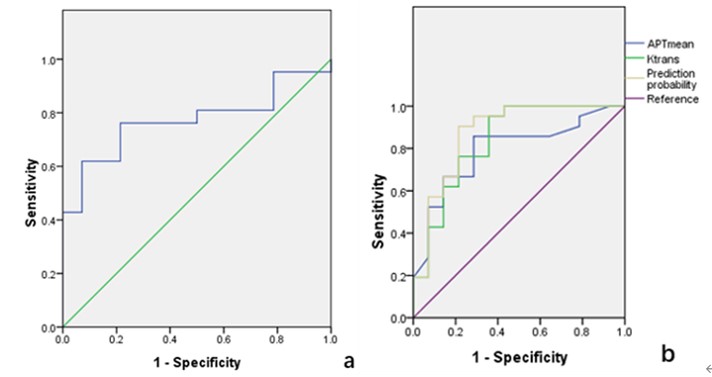
Measurement consistency between the two observers was good (ICC > 0.75, Table 3). Ktrans values of the DSI positive group were significantly higher than those of the negative group (0.67±0.29 min-1 vs. 0.40±0.18 min-1, p = 0.004); APTmean and Ktrans values of the VSI positive group were significantly higher than those of the negative group (3.40±0.69 vs.2.67±0.51, 0.68±0.24 min-1 vs. 0.37±0.24 min-1, both p<0.05). There was no difference of all parameters between high grade group and low grade group (all P>0.05). The Logistic regression analysis showed that APTmean and Ktrans were independent factors. A prediction model was established based on the result described above: Logti (P1) = -6.662 + (4.660×Ktrans) + (1.528×APTmean). The ROC curves for all significant parameters for predicting pathological features were showed in Figure 2 and Table 4.Discussion
The results of this study showed that Ktrans and APTw were the most valuable parameters for predicting pathological DSI and VSI. the APT reflects concentrations of mobile macromolecules in tissues, and tumor heterogeneity and composition also affects the concentration, thus, aggressive lesion showed a higher APT. The parameter Ktrans reflected tumor angiogenesis, which is proportional to the density of the tumor vessels. This indicated that the angiogenesis of the DSI and VSI positive group was greater than that of the negative group. Therefore, combined Ktrans and APTw had the best predicted performance.Conclusion
Combination of DCE and APTw is potentially a promising and valuable non-invasive method in the preoperative prediction of VSI and DSI of patients with cervical cancer.Acknowledgements
No acknowledgement found.References
1. Robertson AJ, Anderson JM, Beck JS, et al. Observer variability in histopathological reporting of cervical biopsy specimens. J Clin Pathol 1989; 42:231–238.
2. Park JY, Kim DY, Kim JH, Kim YM, Kim YT, Nam JH: Further stratification of risk groups in patients with lymph node metastasis after radical hysterectomy for early-stage cervical cancer. Gynecol Oncol 2010, 117(1):53-58.
3. Derks M, van der Velden J, de Kroon CD, Nijman HW, van Lonkhuijzen L, van der Zee AGJ, Zwinderman AH, Kenter GG: Surgical Treatment of Early-Stage Cervical Cancer: A Multi-Institution Experience in 2124 Cases in The Netherlands Over a 30-Year Period. Int J Gynecol Cancer 2018, 28(4):757-763.
4. Zhou J, Payen JF, Wilson DA, Traystman RJ, van Zijl PC (2003) Using the amide proton signals of intracellular proteins and peptides to detect pH effects in MRI. Nat Med 9:1085–1090.
5. Balleyguier C, Sala E, Da Cunha T, et al. Staging of uterine cervical cancer with MRI: Guidelines of the European Society of Urogenital Radiology. Eur Radiol 2011;21:1102–1110.
Figures