4297
Value of ESWAN combined with DTI in the differential diagnosis of solid pseudopapillary tumor and neuroendocrine tumor of pancreas1School of Medical Imaging, Dalian Medical University, Dalian, China, 2DepartmentofRadiology,DalianFriendshipHospital, Dalian, China, 3Department of Radiology, the First Affiliated Hospital of Dalian Medical University, Dalian, China, 4GE Healthcare, MR Research China, Beijing, China
Synopsis
It is difficult to differentiate the solid pseudopapillary tumor of the pancreas (SPTP) from pancreatic neuroendocrine tumor (PNET). Enhanced T2* weighted angiography (ESWAN) technique can simultaneously obtain amplitude, phase, R2* and T2* values, which can quantitatively assess the magnetic sensitivity characteristics of tissues. DTI can evaluate the diffusion of water molecules in living tissues. This study founded that R2* and T2* of ESWAN, fractional aniso (FA) and volume ratio aniso (VRA) of DTI were significantly different (P<0.05) and the AUC was 0.860(sensitivity: 100%; specificity: 79.2%). Therefore, ESWAN combined with DTI may be an effective method to identify SPTP and PNET.
Purpose
To evaluate the diagnostic value of multiple quantitative parameters of ESWAN combined with DTI sequence in the differential diagnosis of solid pseudopapillary tumor of the pancreas (SPTP) and pancreatic neuroendocrine tumor (PNET).Introduction
PNET is a blood rich tumor, about 41% - 49% of them have no obvious enhancement after contrast enhanced scanning [1]. SPTP has malignant potential, and content in lesions are mainly composed of solid components, which are difficult to differentiate from PNET [2]. The correct diagnosis and prognosis of patients is of great importance in guiding clinical treatment and judging the prognosis. ESWAN sequence could assess the difference of magnetic sensitivity in different tissues due to the presence of iron in blood[3], it can provide multiple quantitative parameters. The theoretical basis of DTI is that water molecules with approximate Gaussian distribution in tissues. This study aimed to assess the value of ESWAN and DTI to identify SPTP and PNET.Material and Methods
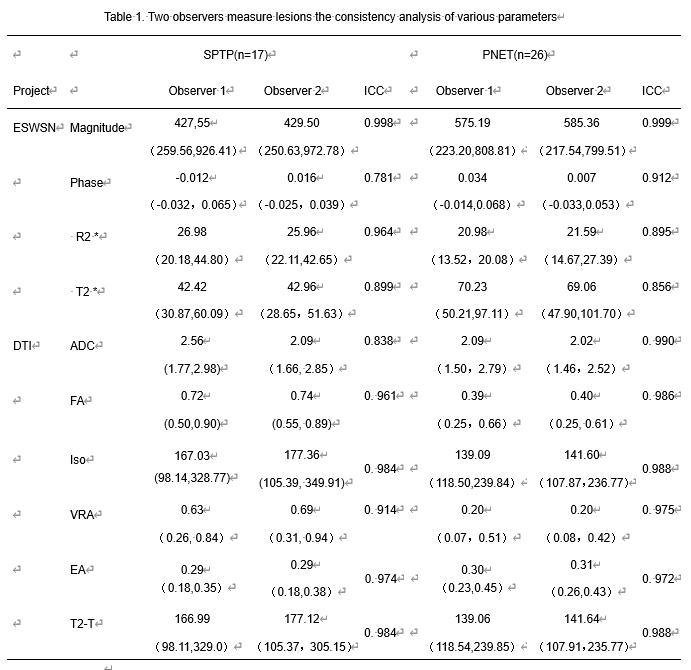
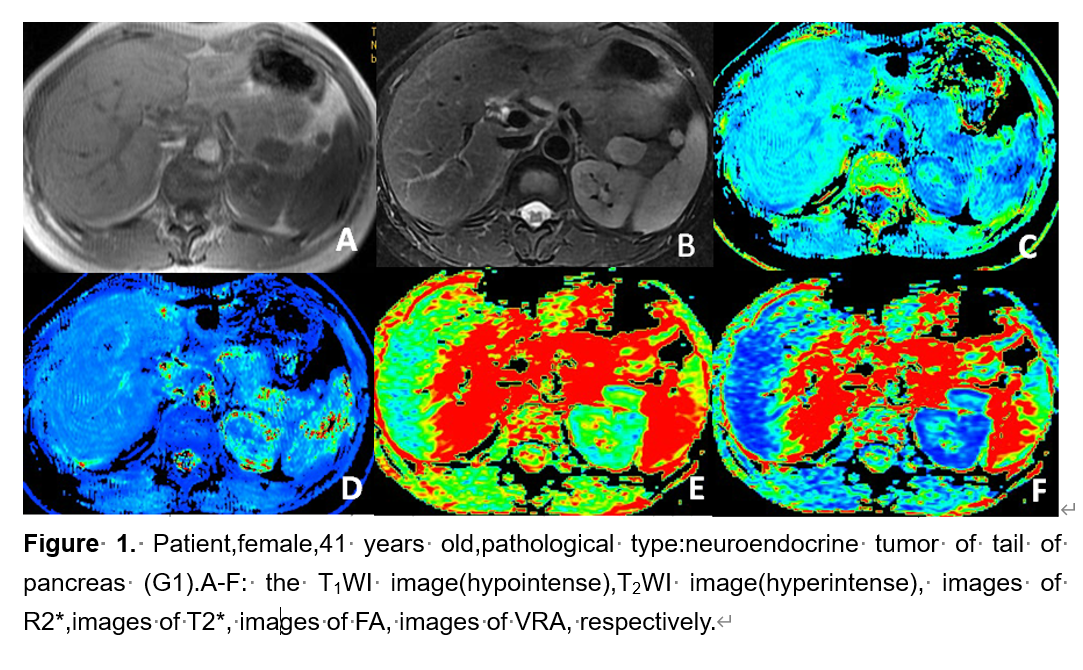
17 cases of SPTP (13 female, 4 male ) and 26 cases (17 females, 9 males ) of PENT were enrolled in the study. MRI scan including ESWAN and DTI sequences was performed on a 1.5T scanner (GE Signa HDXT). The ESWAN and DTI images were post-processed using FuncTool software on AW4.6 workstation. The phase, amplitude, R2* and T2* images were obtained from ESWAN; the average DC (ADC), fractional aniso (FA), isotropic image images (Iso), volume ratio Aniso (VRA), exponential attenuation (EA) and T2-weightial trace (T2-T) were obtained from DTI. All the function maps were performed by two radiologists, with 5-year and 10-year MRI diagnosis experience, respectively. Three circular ROIs were placed in the solid part of the lesions with an area of about 25-100 mm2( Figue 1, Figue 2). By Intra class correlation coefficients (ICC) were used to test the consistency of the measurements of two observers(ICC < 0.40,poor consistency; 0.40 ≤ ICC < 0.75 medium consistency; ICC ≥ 0.75,good consistency). Take two observers measured average statistics,the Independent t-test, Mann-Whitney tests and Kruskal-Wallis tests were used to carry out the comparisons among the groups, and receiver operating characteristic (ROC) curve was used to analyze the diagnostic efficiency.Results
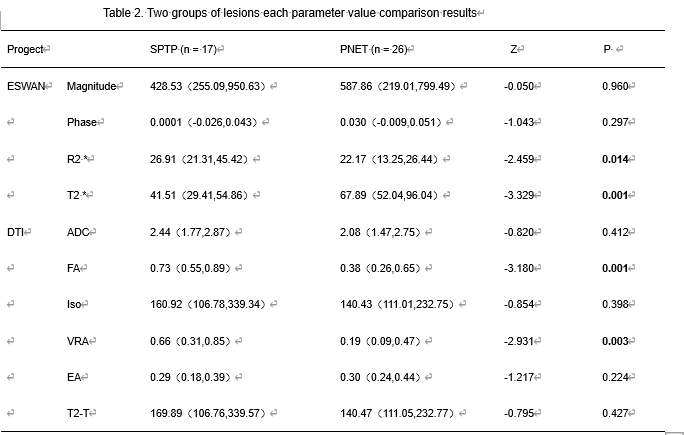
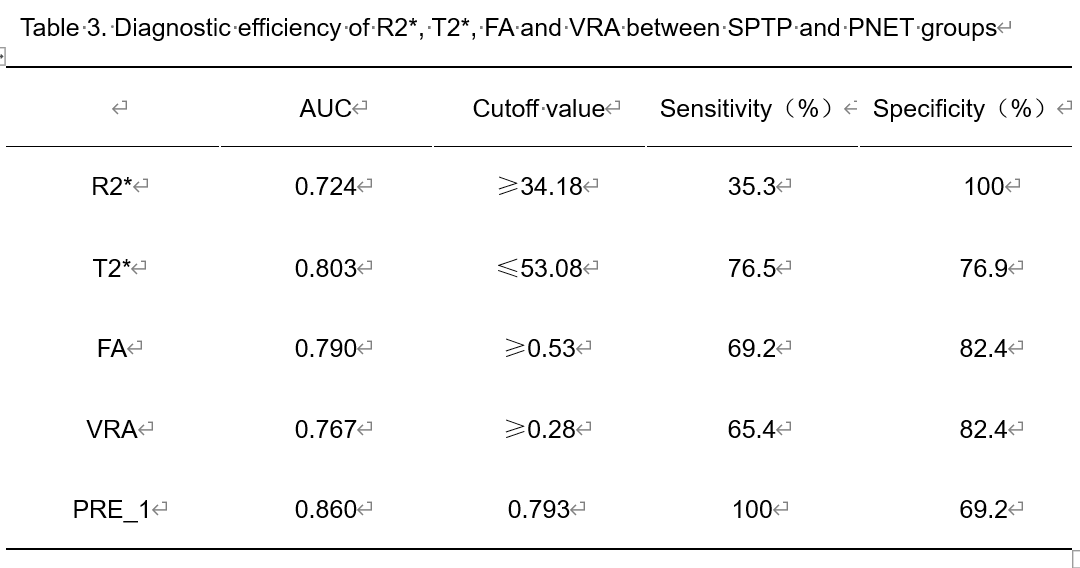
The results of two observers were in good agreement (Table1).The value of R2* in SPTP group were significantly higher than those in PNET group, but the value of T2* was lower than that in PNET group (P<0.05). The values of FA and VRA on DTI in SPTP were significantly higher than those in PNET (P<0.05) (Table2). The AUC were 0.724 for R2*(sensitivity 35.3%, specificity 100%,Cutoff value ≥34.18) ,0.803 for T2*(sensitivity76.5%, specificity 76.9%,Cutoff value ≤53.08), 0.790 for FA(sensitivity69.2%, specificity 82.4%,Cutoff value ≥0.53), 0.767 for VRA(sensitivity 65.4%, specificity 82.4%,Cutoff value ≥0.28), 0.860 for ESWAN combined with DTI(sensitivity100%, specificity 69.2%)(Table3).Discussion
R2 * value was positively correlated with the concentration of paramagnetic substances. It can evaluate the changes of local tissue oxygen content quantitively and is related to hypoxia, bleeding, abnormal blood vessels. With the increasing of blood metabolite concentration (such as deoxyhemoglobin), R2 * value increases significantly [4]. In addition, the oxygen content of PNET is higher than SPTP, which may be why R2 * of PNET is significantly lower than SPTP. According to previous studies, SPTP pathological examination showed that tumor cells arranged orderly around the blood vessels with complex structure [4], so the FA and VRA of SPTP were significantly higher than those of PNET.Conclusion
R2 * and T2 * based on ESWAN combined with FA and VRA base on DTI sequence may be an effective way to distinguish SPTP from PNET, which is of great significance for clinical preoperative diagnosis and prognosis judgment.Acknowledgements
No acknowledgement found.References
[1] JEON S K,LEE J M,JOO I,et al. Nonhypervascular Pancreatic Neuroendocrine Tumors: Differential Diagnosis from Pancreatic Ductal Adenocarcinomas at MR Imaging-Retrospective Cross-sectional Study[J].Radiology.2017,284(1): 77-78.
[2] Serra S, Chetty R.Revision 2:an immunohistochemical approach and evaluation of solid pseudopapillary tumor of the pancereas [J].J Clin Pathol.2008,61(11):1153-1159.
[3] Li Z,Cao L,Dong W,et al.Prevalence and Risk Factors of Cerebral Microbleeds in Patients with Nonvalvular Atrial Fibrillation:An Enhanced T2*-Weighted Angiography Imaging Study.Eur NEUROL,2019,81(3-4):112-119.
[4] Karlsson M, Ekstedt M, Dahlström N, et al. Liver R2 * is affected by both iron and fat: a dual biopsy-validated study of chronic liver disease. J Magn Reson Imaging. 2019, 50(1): 325-333.
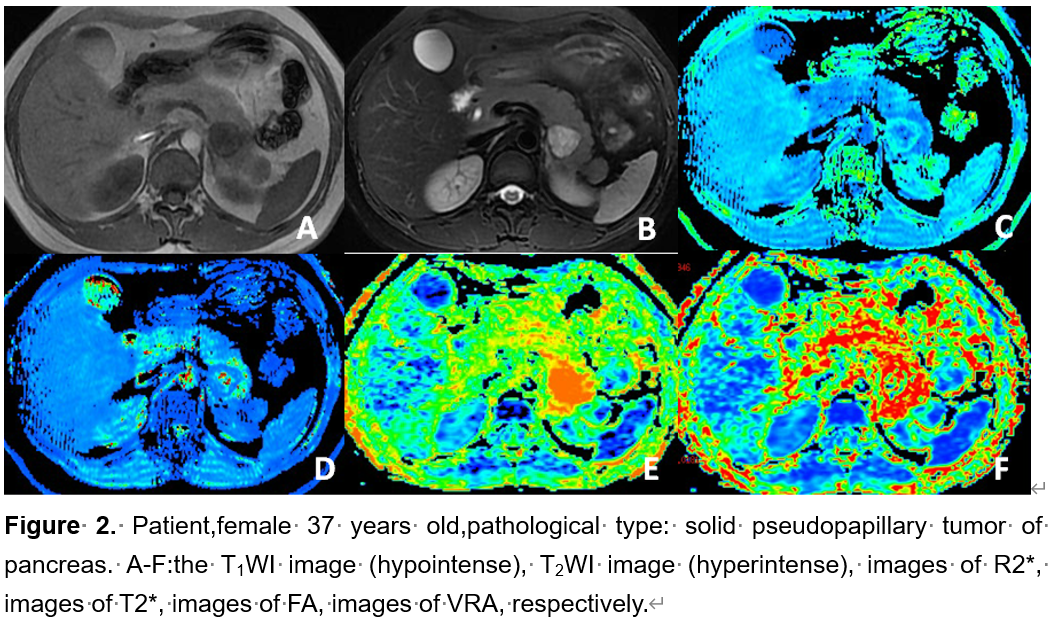
Figures