4291
Changes in Apparent Diffusion Coefficient (ADC) in Serial Weekly MRI During Radiotherapy in Patients with Head and Neck Cancer (PREDICT-HN study)1Austin Health, Heidelberg, Australia, 2University of Birmingham Alabama, Birmingham, AL, United States, 3Centre hospitalier de l'Université de Montréal, Montreal, QC, Canada, 4MD Anderson Cancer Center, Houston, TX, United States
Synopsis
We evaluated the weekly ADC kinetics of tumour during radiotherapy for head and neck cancer in the PREDICT-HN study. of 41 patients, 36 had intact primary tumours, and 31 patients had nodal disease with 46 nodes assessed. For primary tumours, a steep increase in ADC values from pre-treatment to week 2, and from weeks 5 to post-treatment was observed. For nodes, ADC values increased from pre-treatment to week 4, and then decreased thereafter. A discrepancy in the trajectory of ADC changes between primary and nodal sites suggesting that they exhibit different treatment responses.
Introduction
The PREDICT-HN study was designed to explore the use of serial intra-treatment imaging, using magnetic resonance imaging (MRI), and blood collection to systematically document, describe and evaluate the kinetics of imaging and blood biomarkers during radiotherapy that could potentially be used to discriminate early responders and non-responders.Purpose
Here, we evaluate the apparent diffusion coefficient (ADC) kinetics of tumour during radiotherapy that could potentially be used to discriminate the early responders and non-responders from other patients.Methods
Patients with intact gross tumour of the mucosal head and neck squamous cell carcinoma undergoing definitive radiotherapy were eligible for the prospective IRB-approved PREDICT-HN study. Serial pre-, weekly in-, and post-treatment MRI were obtained in the radiotherapy treatment position. Primary and nodal tumours were delineated on the MRIs as separate structures by two radiation oncologists (SPN, HB). An experienced neuroradiologist (JMJ) reviewed the delineations for 20% of randomly selected images. Tumours were delineated on the T2-weighted images as they have better anatomical definition and visualization of tumour. The contour was transferred to the corresponding registered ADC map. Serial GTV measurements were recorded. ADC values were extracted and analyzed in percentiles. The correlation between each feature and the GTV was calculated using Spearman’s correlation coefficient. The linear mixed model was used to evaluate the change in GTV over time.Results
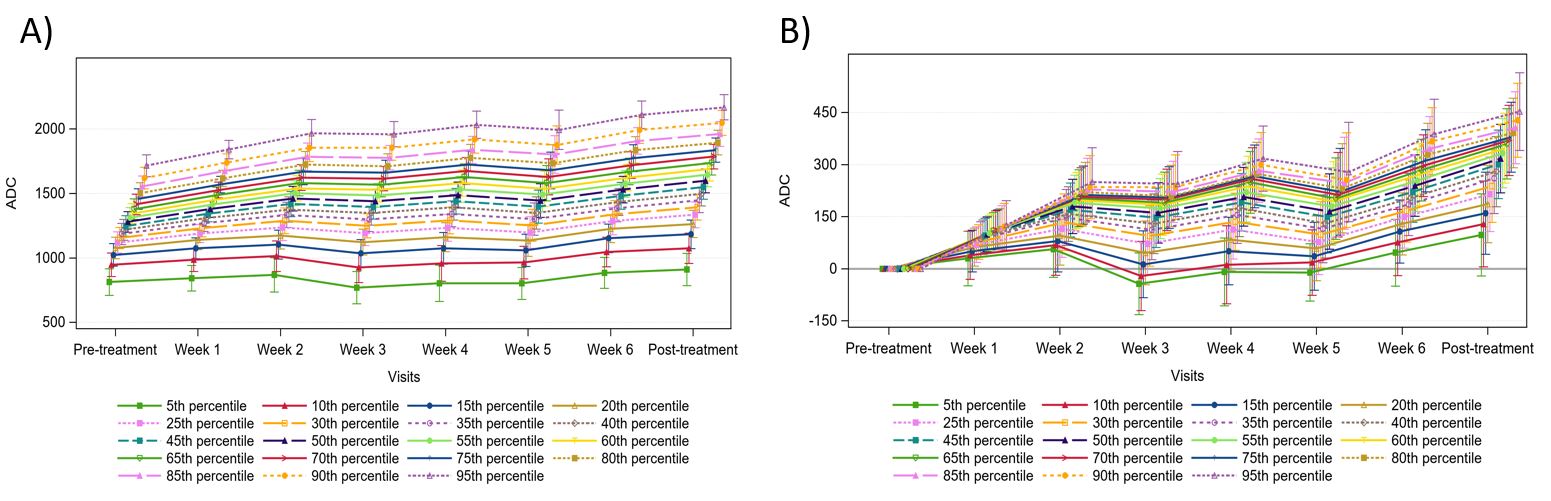
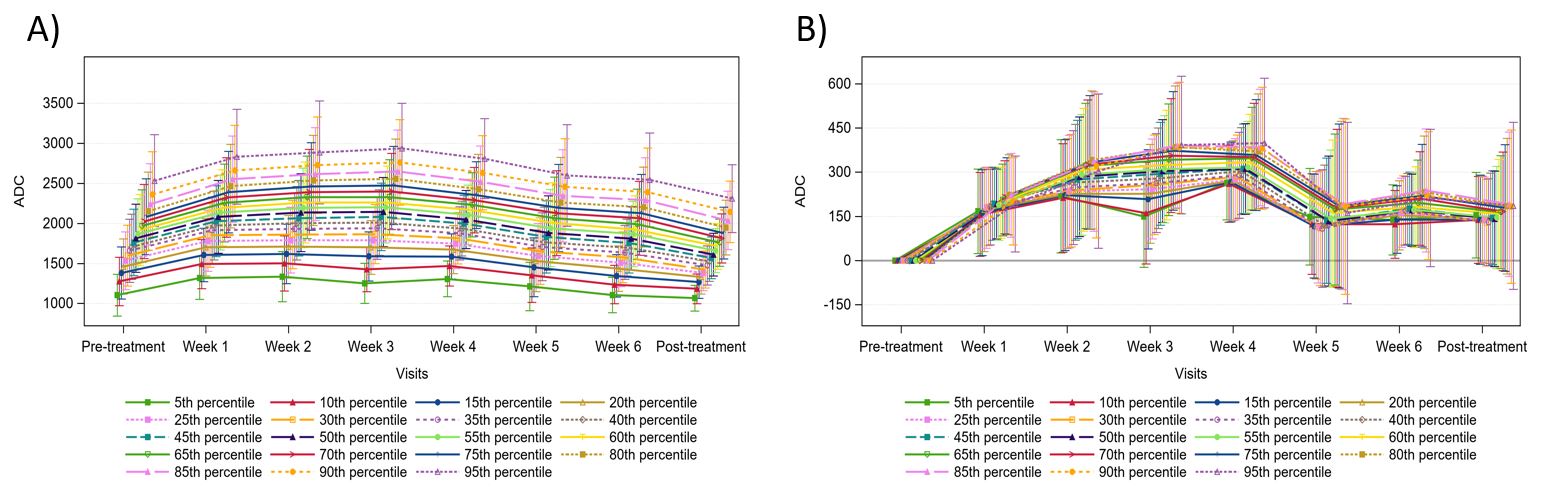
41 patients completed the study. Median age was 59 (range: 41 – 81) years. Majority (76%) had oropharyngeal cancer. Of the 41 patients, 36 had intact primary tumors that can be assessed on MRI, and 31 patients had nodal disease with 46 nodes assessed. The median primary GTV was 14.1cc (range: 5.1 – 26.9). The rate of primary GTV shrinkage was highest between pre-treatment to week 4 (Figure 1). The average shrinkage per week was 2.3cc. Patients with T3 and T4 tumours had a 3.8-fold decrease in the geometric mean of GTV change at post-treatment compared to T1 and T2 tumours (Figure 2). When normalized to pre-treatment values, a steep increase in ADC values from pre-treatment to week 2, minimal change between weeks 2 and 5, and then a steep increase in ADC values from weeks 5 to post-treatment was observed (Figure 3). The primary GTV ADC values correlated with residual primary GTV.46 nodes were evaluated. The median total nodal volume was 12.4cc (range: 8 – 21). The average nodal volume reduction per week was 1.7cc. No clinical features were found to correlate with nodal volume reduction. ADC values increased from pre-treatment to week 4, and then dropped from week 4 to week 5 and remained relatively stable to post-treatment (Figure 4). The overall change in ADC values for nodes from pre-treatment was significant for 35th to 95th percentiles in weeks 1 to 4 (all p<0.001). Nodal volume did not correlate with ADC values.
The median follow up time was 12 (range: 6 – 22) months. Of the 41 participants, 2 patients had died. At post-treatment, all but 3 patients achieved complete response. Of the 3 patients with incomplete response, one died of progressive local disease and 2 had salvage treatments (neck dissection for persistent nodal disease, confirmed on pathology). During surveillance, eight (20%) patients developed recurrences - 4 local recurrences, 1 regional recurrence, 1 regional and distant recurrences, and 2 distant disease.
Conclusions
This study shows that ADC values increase significantly during radiotherapy, particularly within the first 2 weeks of treatment, for both primary tumour and nodal sites. After week 2, a discrepancy in the trajectory of ADC changes was observed between primary and nodal sites suggesting that primary and nodal sites exhibit different treatment responses and should be analyzed separately in future studies.Acknowledgements
No acknowledgement found.References
Ng SP, Bahig H, Wang J, Cardenas CE, Lucci A, Hall CS, et al. Predicting treatment Response based on Dual assessment of magnetic resonance Imaging kinetics and Circulating Tumor cells in patients with Head and Neck cancer (PREDICT-HN): matching 'liquid biopsy' and quantitative tumor modeling. BMC Cancer. 2018;18:903.Figures
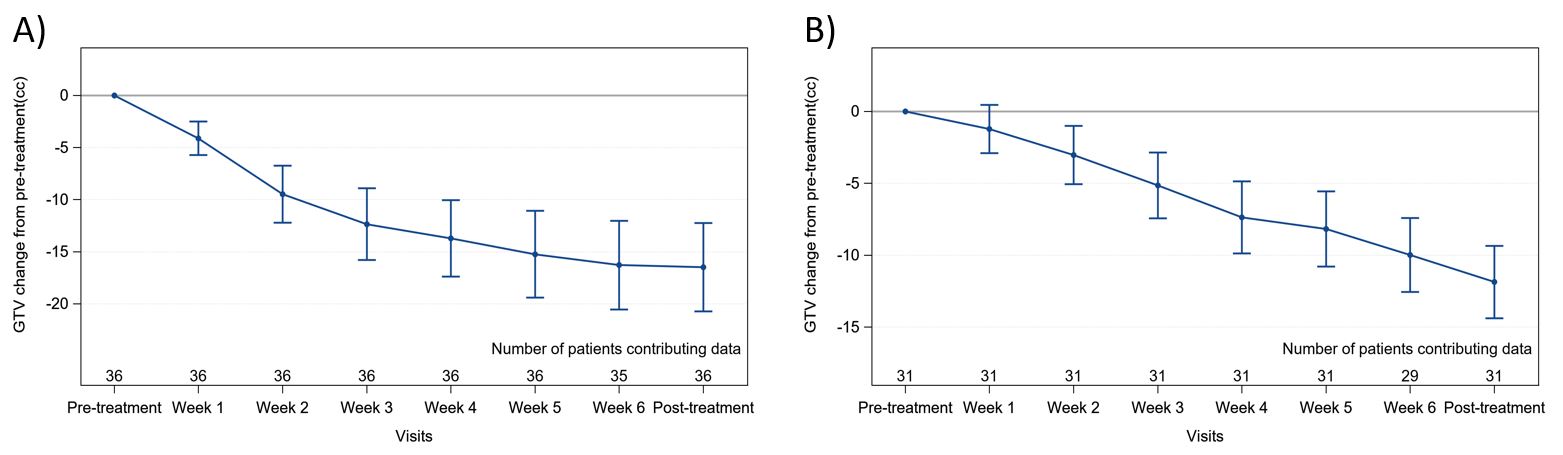
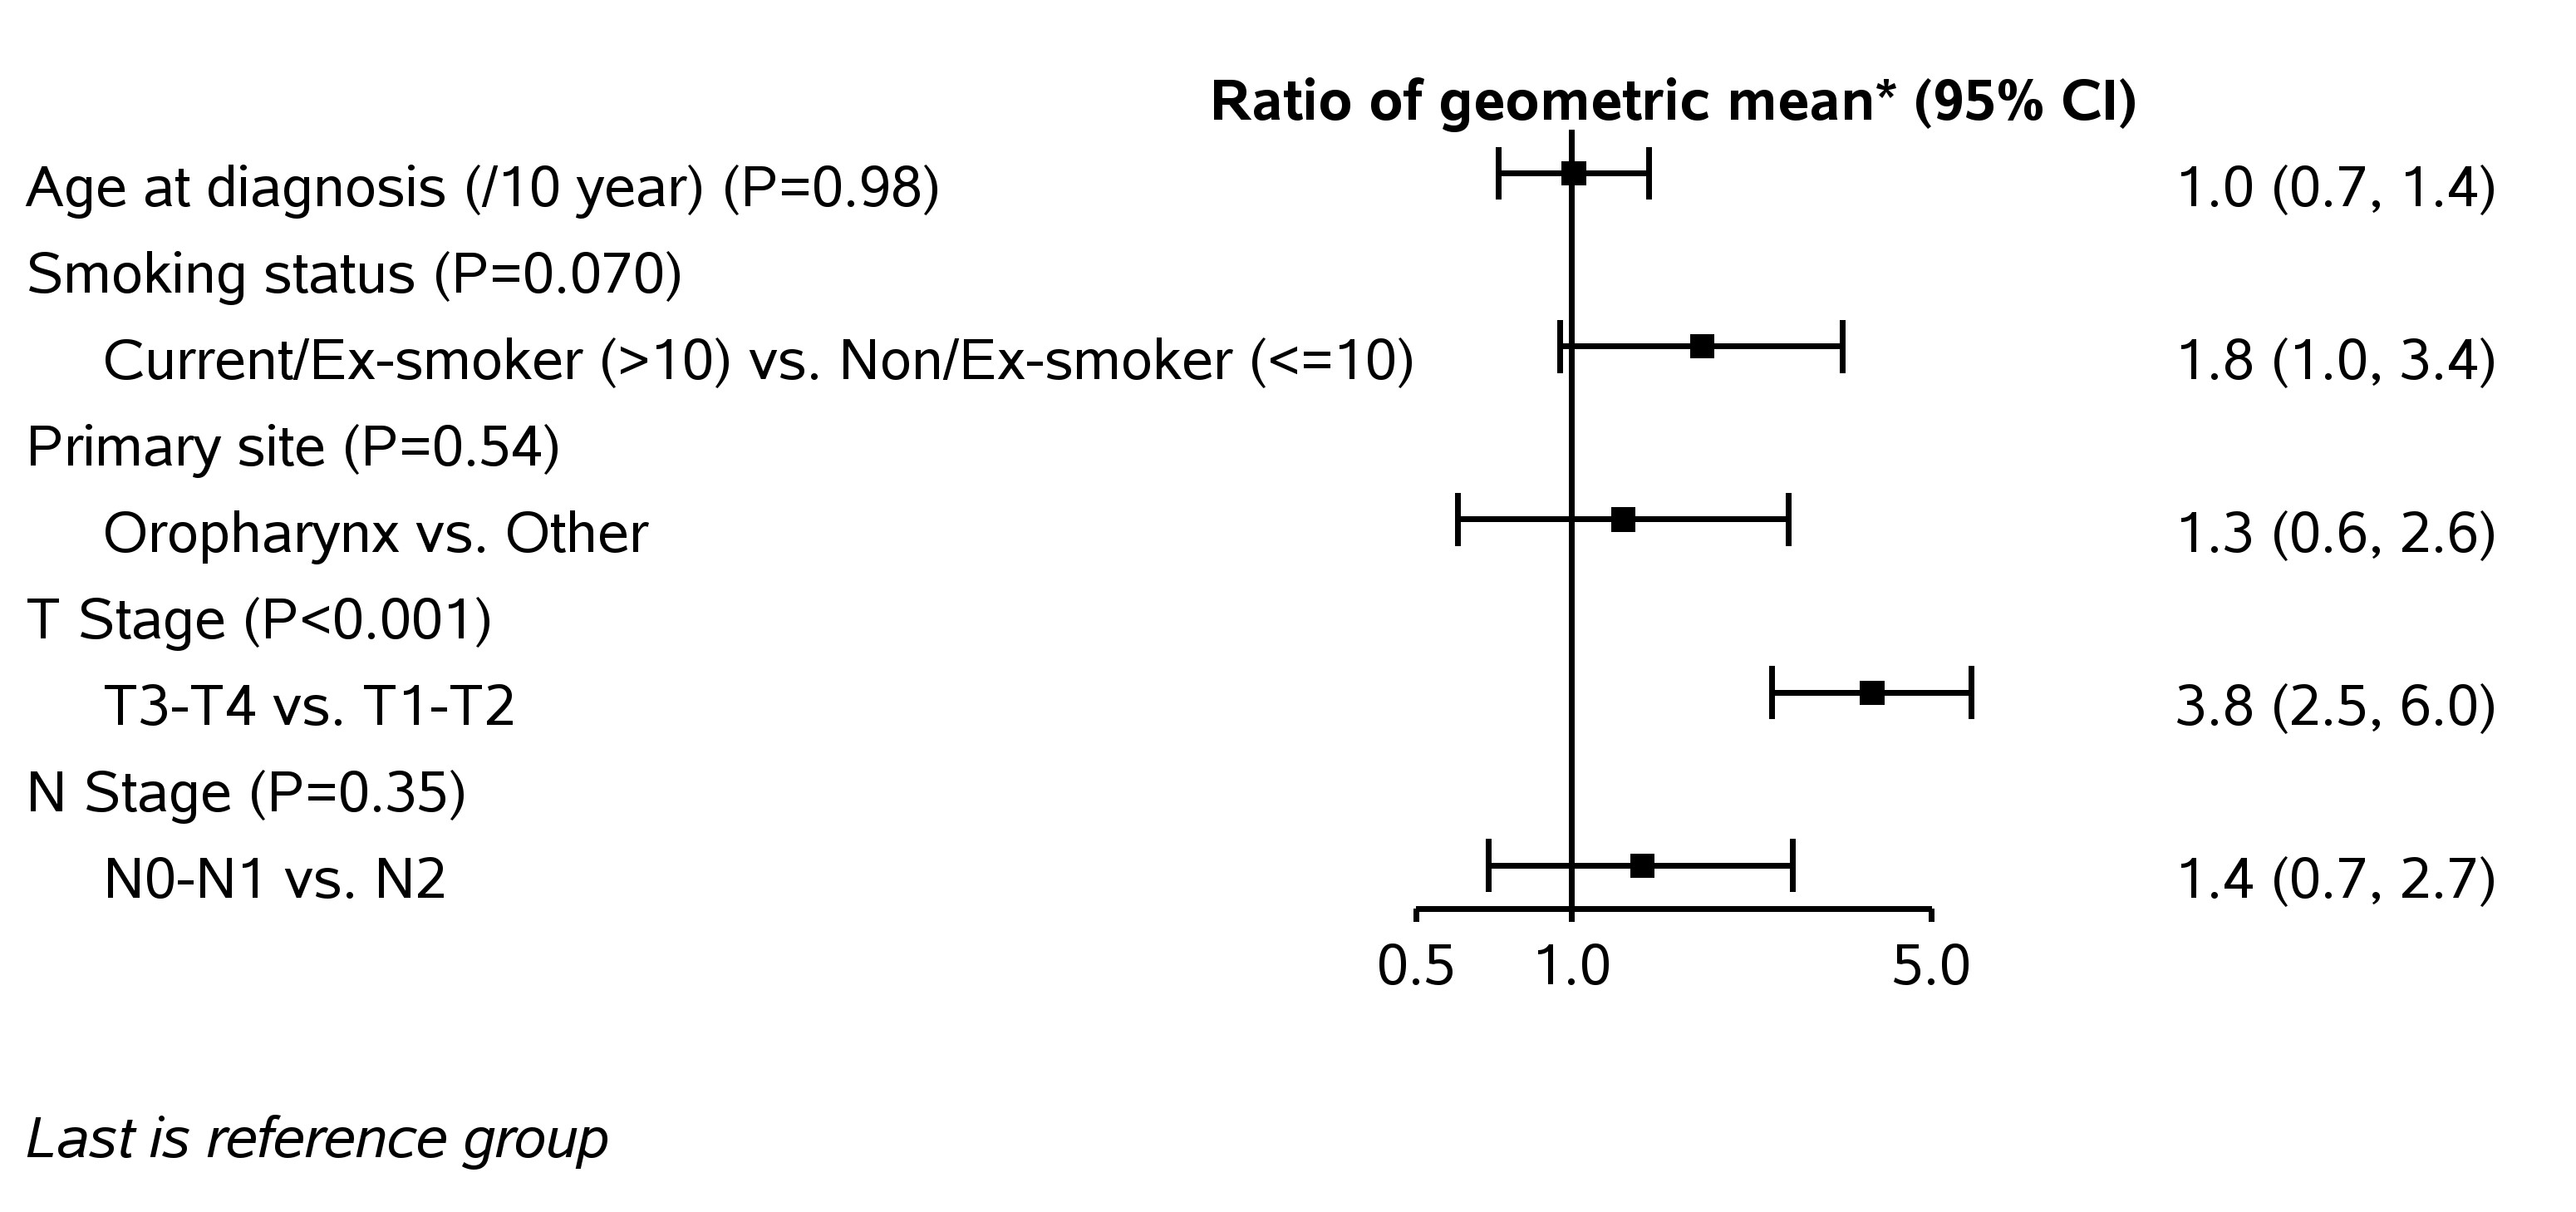
Figure 2. Factors associated with primary tumour volume reduction from pre-treatment to post-treatment.
*Ratio of the geometric mean was calculated by log-linear regression models. The GTV reduction was log-transformed in a linear regression model.