4289
Correlation between SUV, tumor blood flow and ADC of extra-axial tumors on FDG-PET/MRI1Kyoto University Graduate School of Medicine, Kyoto, Japan
Synopsis
PET/MRI shows high accuracy of fused images by simultaneously acquired PET and MR images. We can obtain spatially and temporally consistent information on metabolic and anatomic information from PET/MRI. We evaluated each quantitative value in 12 patients with extra-axial tumor in this study. We manually placed the same regions of interest (ROIs) of the tumor on FDG-PET, CBF map and ADC map, and performed ROI analysis of SUV, TBF (tumor blood flow) and ADC. There were correlations between SUV and TBF, and between SUV and ADC among patients with TBF less than 110 ml/100g/min.
Introduction
PET/MRI shows high accuracy of fused images by simultaneously acquired PET and MR images. The simultaneous acquisition of co-registered PET and MRI data enables direct correlation among different imaging parameters acquired during a single imaging session, thus we can obtain spatially and temporally consistent information on metabolic and anatomic information from each modality.Patterns and strength of ASL hypoperfusion and FDG-PET hypometabolism in MCI were comparable. FDG-PET SUV and CBF demonstrated moderate and similar discriminatory power in predicting MCI status 1 and Alzheimer disease 2. ASL has been used to characterize intratumoral blood flow 3, differentiate between benign and malignant meningiomas 4. FDG-PET is not useful for brain tumors because they are affected by physiological accumulation in the brain parenchyma 5, however, simultaneous information obtained at PET/MRI may add values in evaluation of brain tumors, especially extra-axial brain tumor.
We explored the relationship between each quantitative value of extra-axial brain tumors on PET and MRI in this study.
Methods
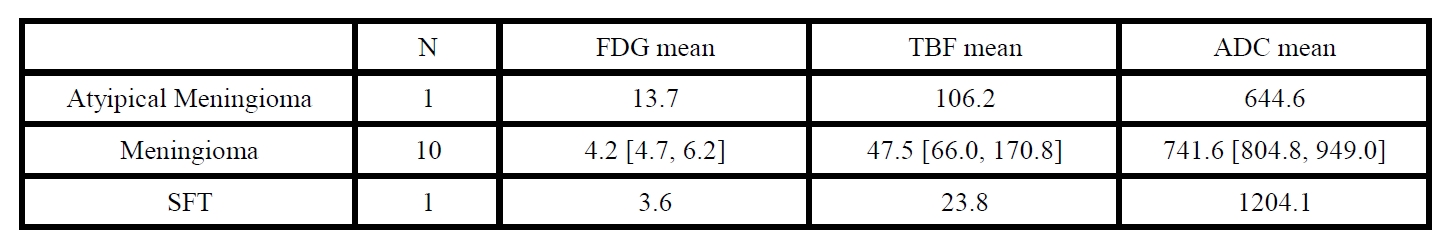
Subjects: Twelve patients (3 males, 9 females; mean age 54 years) with extra-axial tumor (meningioma, 10; atypical meningioma, 1; and solitary fibrous tumor (SFT)) were included in this study.Image Acquisition: Subjects underwent FDG PET/MRI at 3.0 T (Signa PET/MR, GE Healthcare, GE Healthcare, Waukesha, Wisconsin, United States) with a 19-channel head neck coil. The imaging protocols of MRI includes 3D pseudocontinuous ASL (PCASL), and DTI were as follows.
PCASL: TR, 5281 ms; TE, 11.5 ms; IR, 2025 ms; FA, 111.1 degree; FOV 220×200; slice thickness 3mm; post-labeling delay (PLD) 2025 ms; pixel spacing 1.7×1.7; matrix, 128×128; bandwidth, 62.5; 64 slices; 2m48s.
DTI: TR, 11000 ms; TE, 82.2 ms; FA 90 degree; FOV 220×220; matrix, 160×128; slice thickness 3mm; NEX, 1; b=1000 s/m2; 15 directions; ASSET 2×; BW 166.7; 49 slices; 3m16s.
FDG-PET scan was performed in 3D acquisition and list mode with 15 min/bed position (89 slices/bed). PET images were reconstructed with GE VUE Point FX-S algorithm (VPFX-S), a 3D maximum likelihood ordered subset expectation maximization (3D OSEM) image reconstruction algorithm using TOF information and PSF modeling with 8 iterations, 16 subsets and post-processing Gaussian filter of 2.0-mm FWHM. Slice thickness 2.78mm; transaxial FOV, 600 mm; FOV, 250×250mm, matrix 250×250; 89 slices. MR-based attenuation correction (MR-AC) map was generated with 2-point Dixon and zero-TE (ZTE) and the parameters of them were as follows.
2-point Dixon 3D T1-weighted fast SPGR sequence: TR, 4.0 ms; TE1, 1.1 ms; TE2, 2.2ms; FA, 5 degree; FOV, 500×380 mm; matrix, 256×128; slice thickness/overlap, 5.2/2.6 mm; 120 slices; NEX 0.70; imaging time, 15s.
ZTE: TR, 399.6 ms; TE, 0.016 ms; FA 0.8; FOV, 264×264 mm; matrix, 128×128; pixel spacing, 2.06×2.06 mm; slice thickness, 2.4 mm; NEX, 4; 42s.
Post-imaging Procedure: We manually placed the same regions of interest (ROIs) of the tumor on FDG-PET, CBF map and ADC map. We performed ROI analysis of SUV, TBF (tumor blood flow) and ADC using ImageJ. In addition, we excluded four patients with TBF higher than 110 ml/100g/min and evaluated the correlation among the eight patients.
Data Analysis: The correlations were assessed using Spearman’s rank correlation coefficient (ρ). Linear regression analysis was also performed. K-means clustering analysis was also performed and cubic clustering criteria (CCC) was used to determine the number of clusters. All statistical data were analyzed using a software package (JMP Pro 14.0, SAS Institute Inc.).
Results
Figure 1 shows representative images of three patients with TBF less than 110 ml/100g/min. Figure2 shows representative images of two patients with TBF higher than 110 ml/100g/min.K-means clustering analysis showed three clusters in this study (Figure3). Thus, we confirmed there was a cluster with very high TBF and low SUV.
There were correlations between SUV mean and TBF mean, between SUV mean and ADC mean and between TBF mean and ADC mean among the 8 patients with TBF less than 110 ml/100g/min (Figure4). Although these were not significant, SUV mean correlated positively with TBF mean (ρ=0.57, P=0.14). SUV mean correlated negatively with ADC mean (ρ= -0.43, P=0.29). TBF mean correlated negatively with ADC mean (ρ= -0.86, P=0.01).
Discussion and Conclusion
TBF in meningioma was reported to reflect microvascular density inside the tumor 6. Meningiomas are mostly slow-growing tumors and their glucose metabolism might be only moderately elevated 7. FDG uptake may correlate with the tumor proliferation marker (MIB-1 index) 8, therefore, the comprehensive approach with simultaneous TBF and FDG uptake is promising in evaluation of meningioma.Limitations. The number of patients in this study is too small. More patients will be included for this comparison later.
In conclusion, we evaluated the relationship between each quantitative value (SUV, TBF and ADC) on PET/MRI. Our study showed there were correlations between SUV and TBF, and between SUV and ADC among patients with TBF less than 110 ml/100g/min.
Acknowledgements
No acknowledgement found.References
1. Dolui S, Li Z, Nasrallah IM, et al. Arterial spin labeling versus (18)F-FDG-PET to identify mild cognitive impairment. Neuroimage Clin. 2020;25:102146.
2. Musiek ES, Chen Y, Korczykowski M, et al. Direct comparison of fluorodeoxyglucose positron emission tomography and arterial spin labeling magnetic resonance imaging in Alzheimer's disease. Alzheimers Dement. 2012;8:51-59.
3. Mayercik V, Ma M, Holdsworth S, et al. Arterial Spin-Labeling MRI Identifies Hypervascular Meningiomas. AJR Am J Roentgenol. 2019;213:1124-1128.
4. Qiao XJ, Kim HG, Wang DJJ, et al. Application of arterial spin labeling perfusion MRI to differentiate benign from malignant intracranial meningiomas. Eur J Radiol. 2017;97:31-36.
5. Huang RY, Bi WL, Griffith B, et al. Imaging and diagnostic advances for intracranial meningiomas. Neuro Oncol. 2019;21:i44-i61.
6. Koizumi S, Sakai N, Kawaji H, et al. Pseudo-continuous arterial spin labeling reflects vascular density and differentiates angiomatous meningiomas from non-angiomatous meningiomas. J Neurooncol. 2015;121:549-556.
7. Galldiks N, Albert NL, Sommerauer M, et al. PET imaging in patients with meningioma-report of the RANO/PET Group. Neuro Oncol. 2017;19:1576-1587.
8. Okuchi S, Okada T, Yamamoto A, et al. Grading meningioma: a comparative study of thallium-SPECT and FDG-PET. Medicine (Baltimore). 2015;94:e549.
Figures
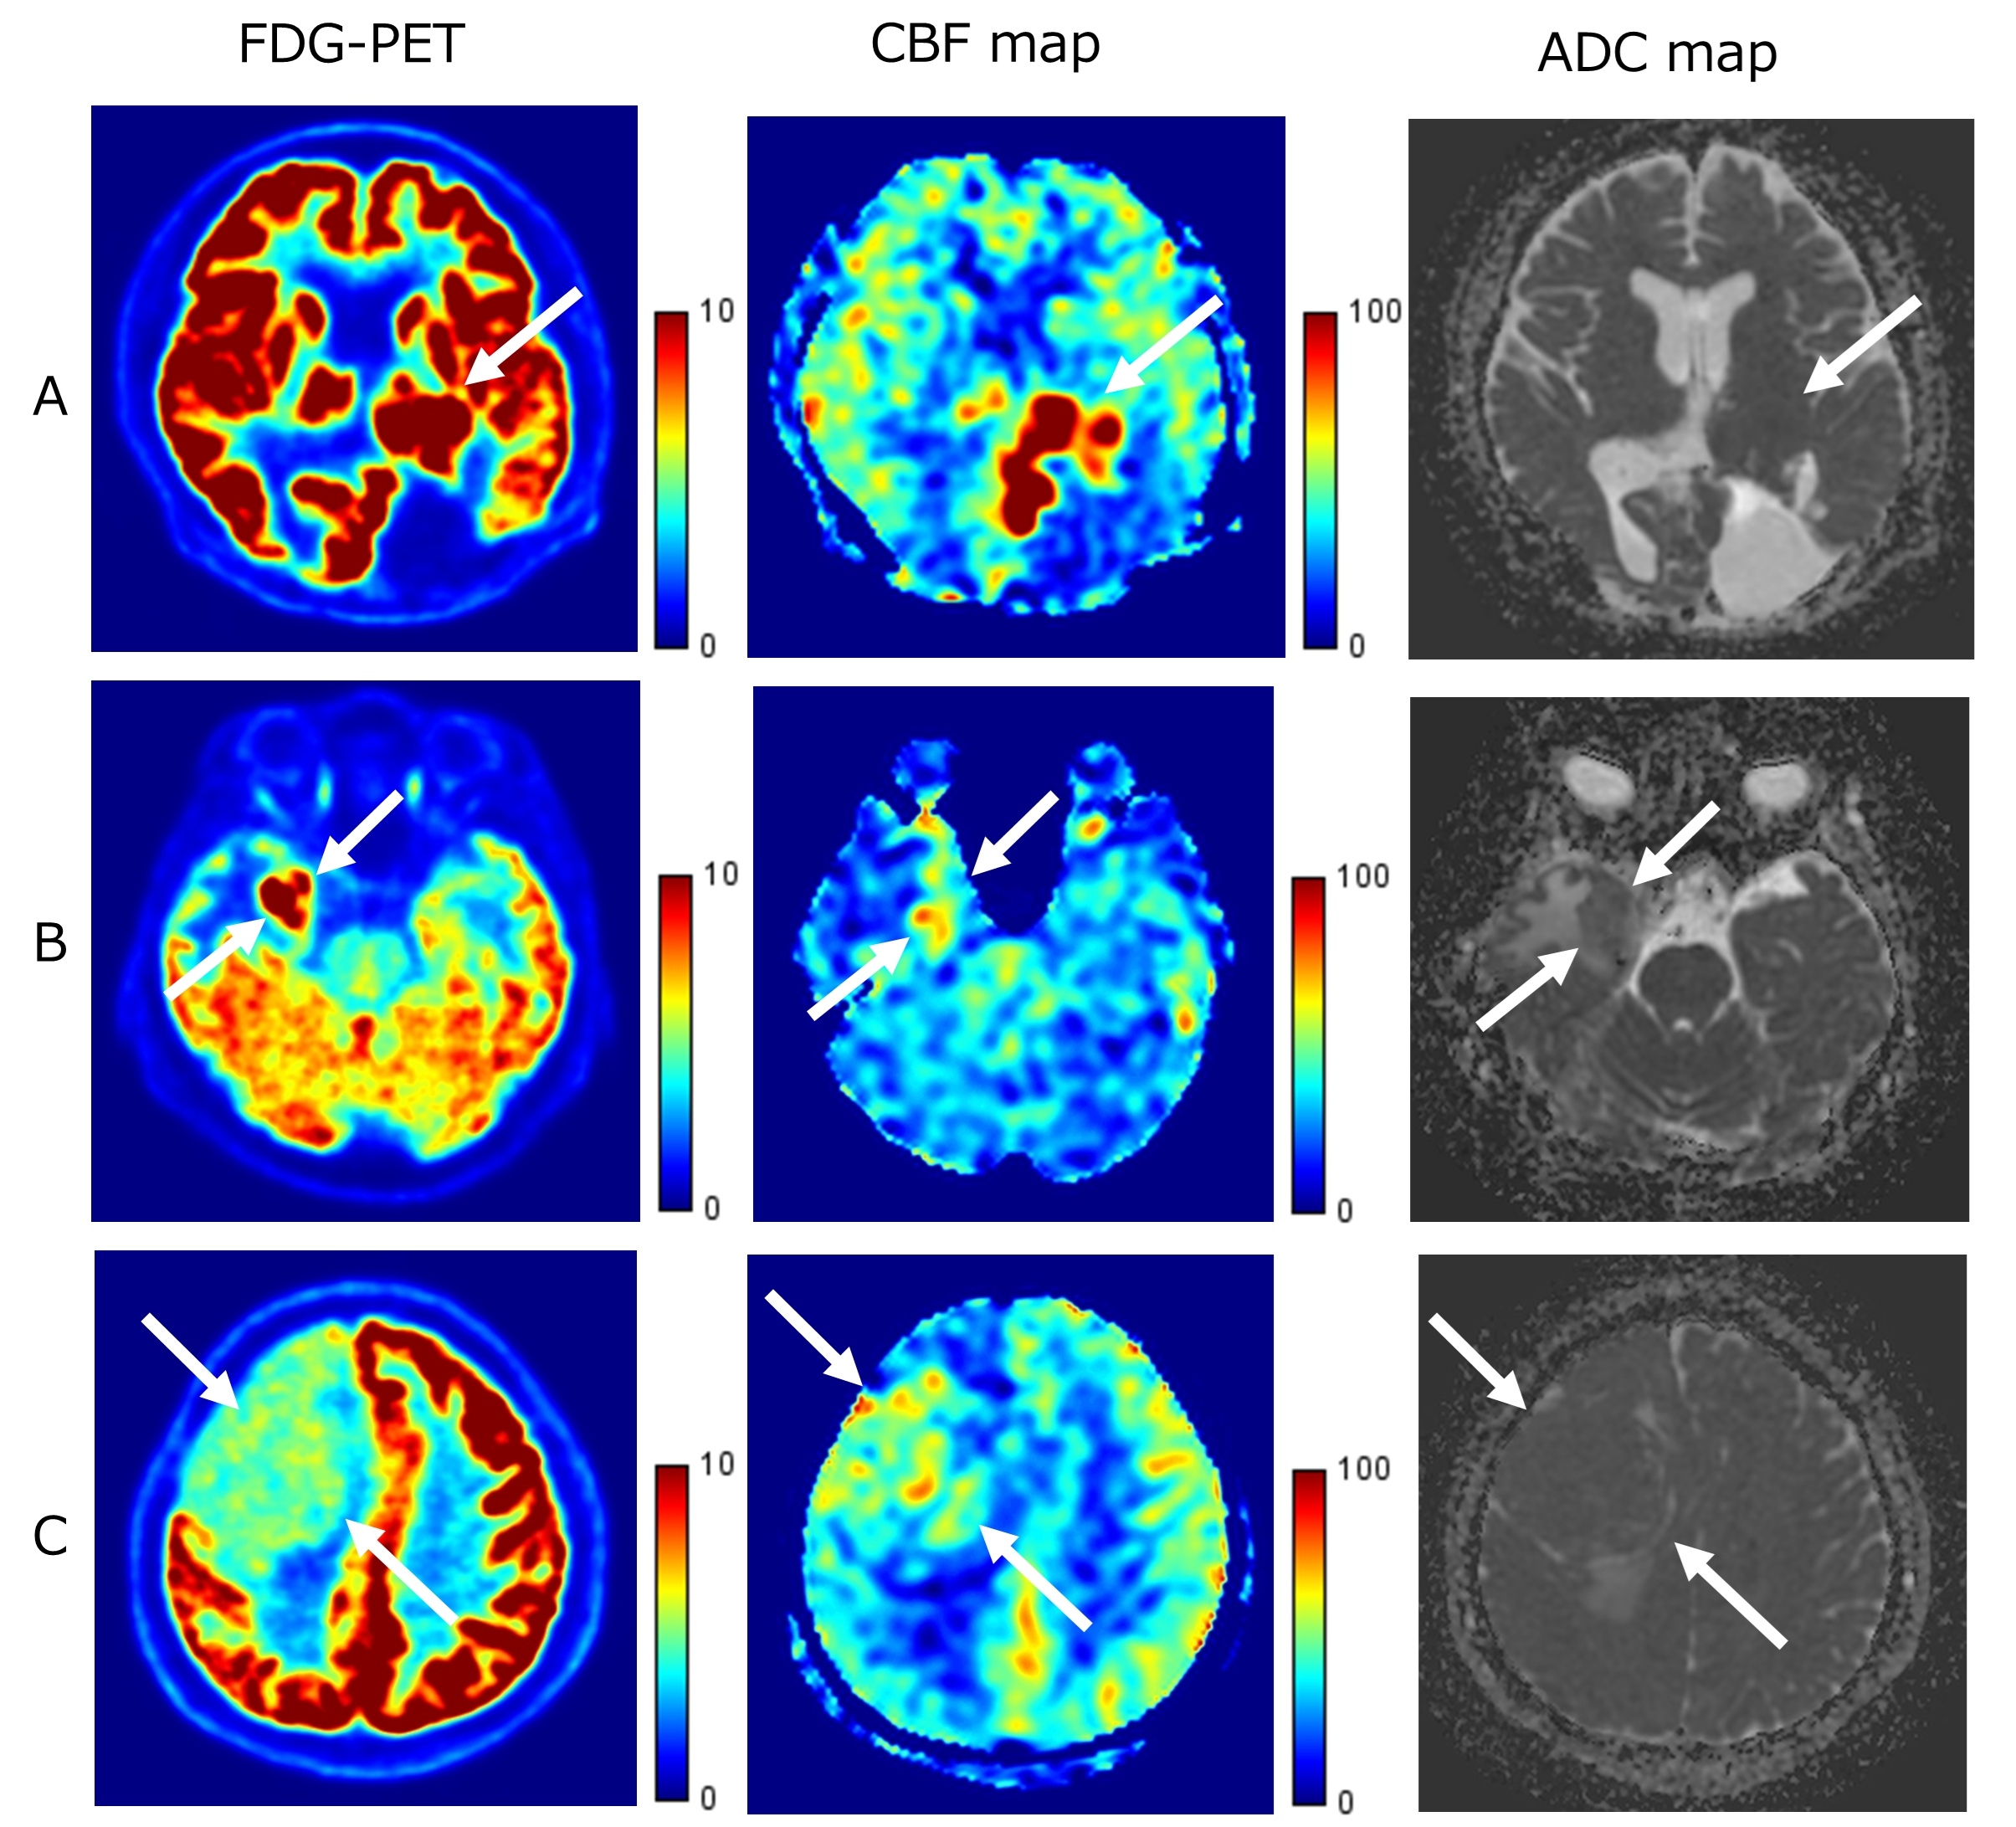
Figure1
A: 46 years old, male, atypical meningioma recurrence, high SUV 13.7, high TBF 106.2, ADC 644.6
B: 72 years old, female, residual meningioma (grade 1), intermediate SUV 10.3, intermediate TBF 61.2, ADC 1006.7
C: 50 years old, male, transitional meningioma, relatively low SUV 4.8, low TBF 47.5, ADC 796.7
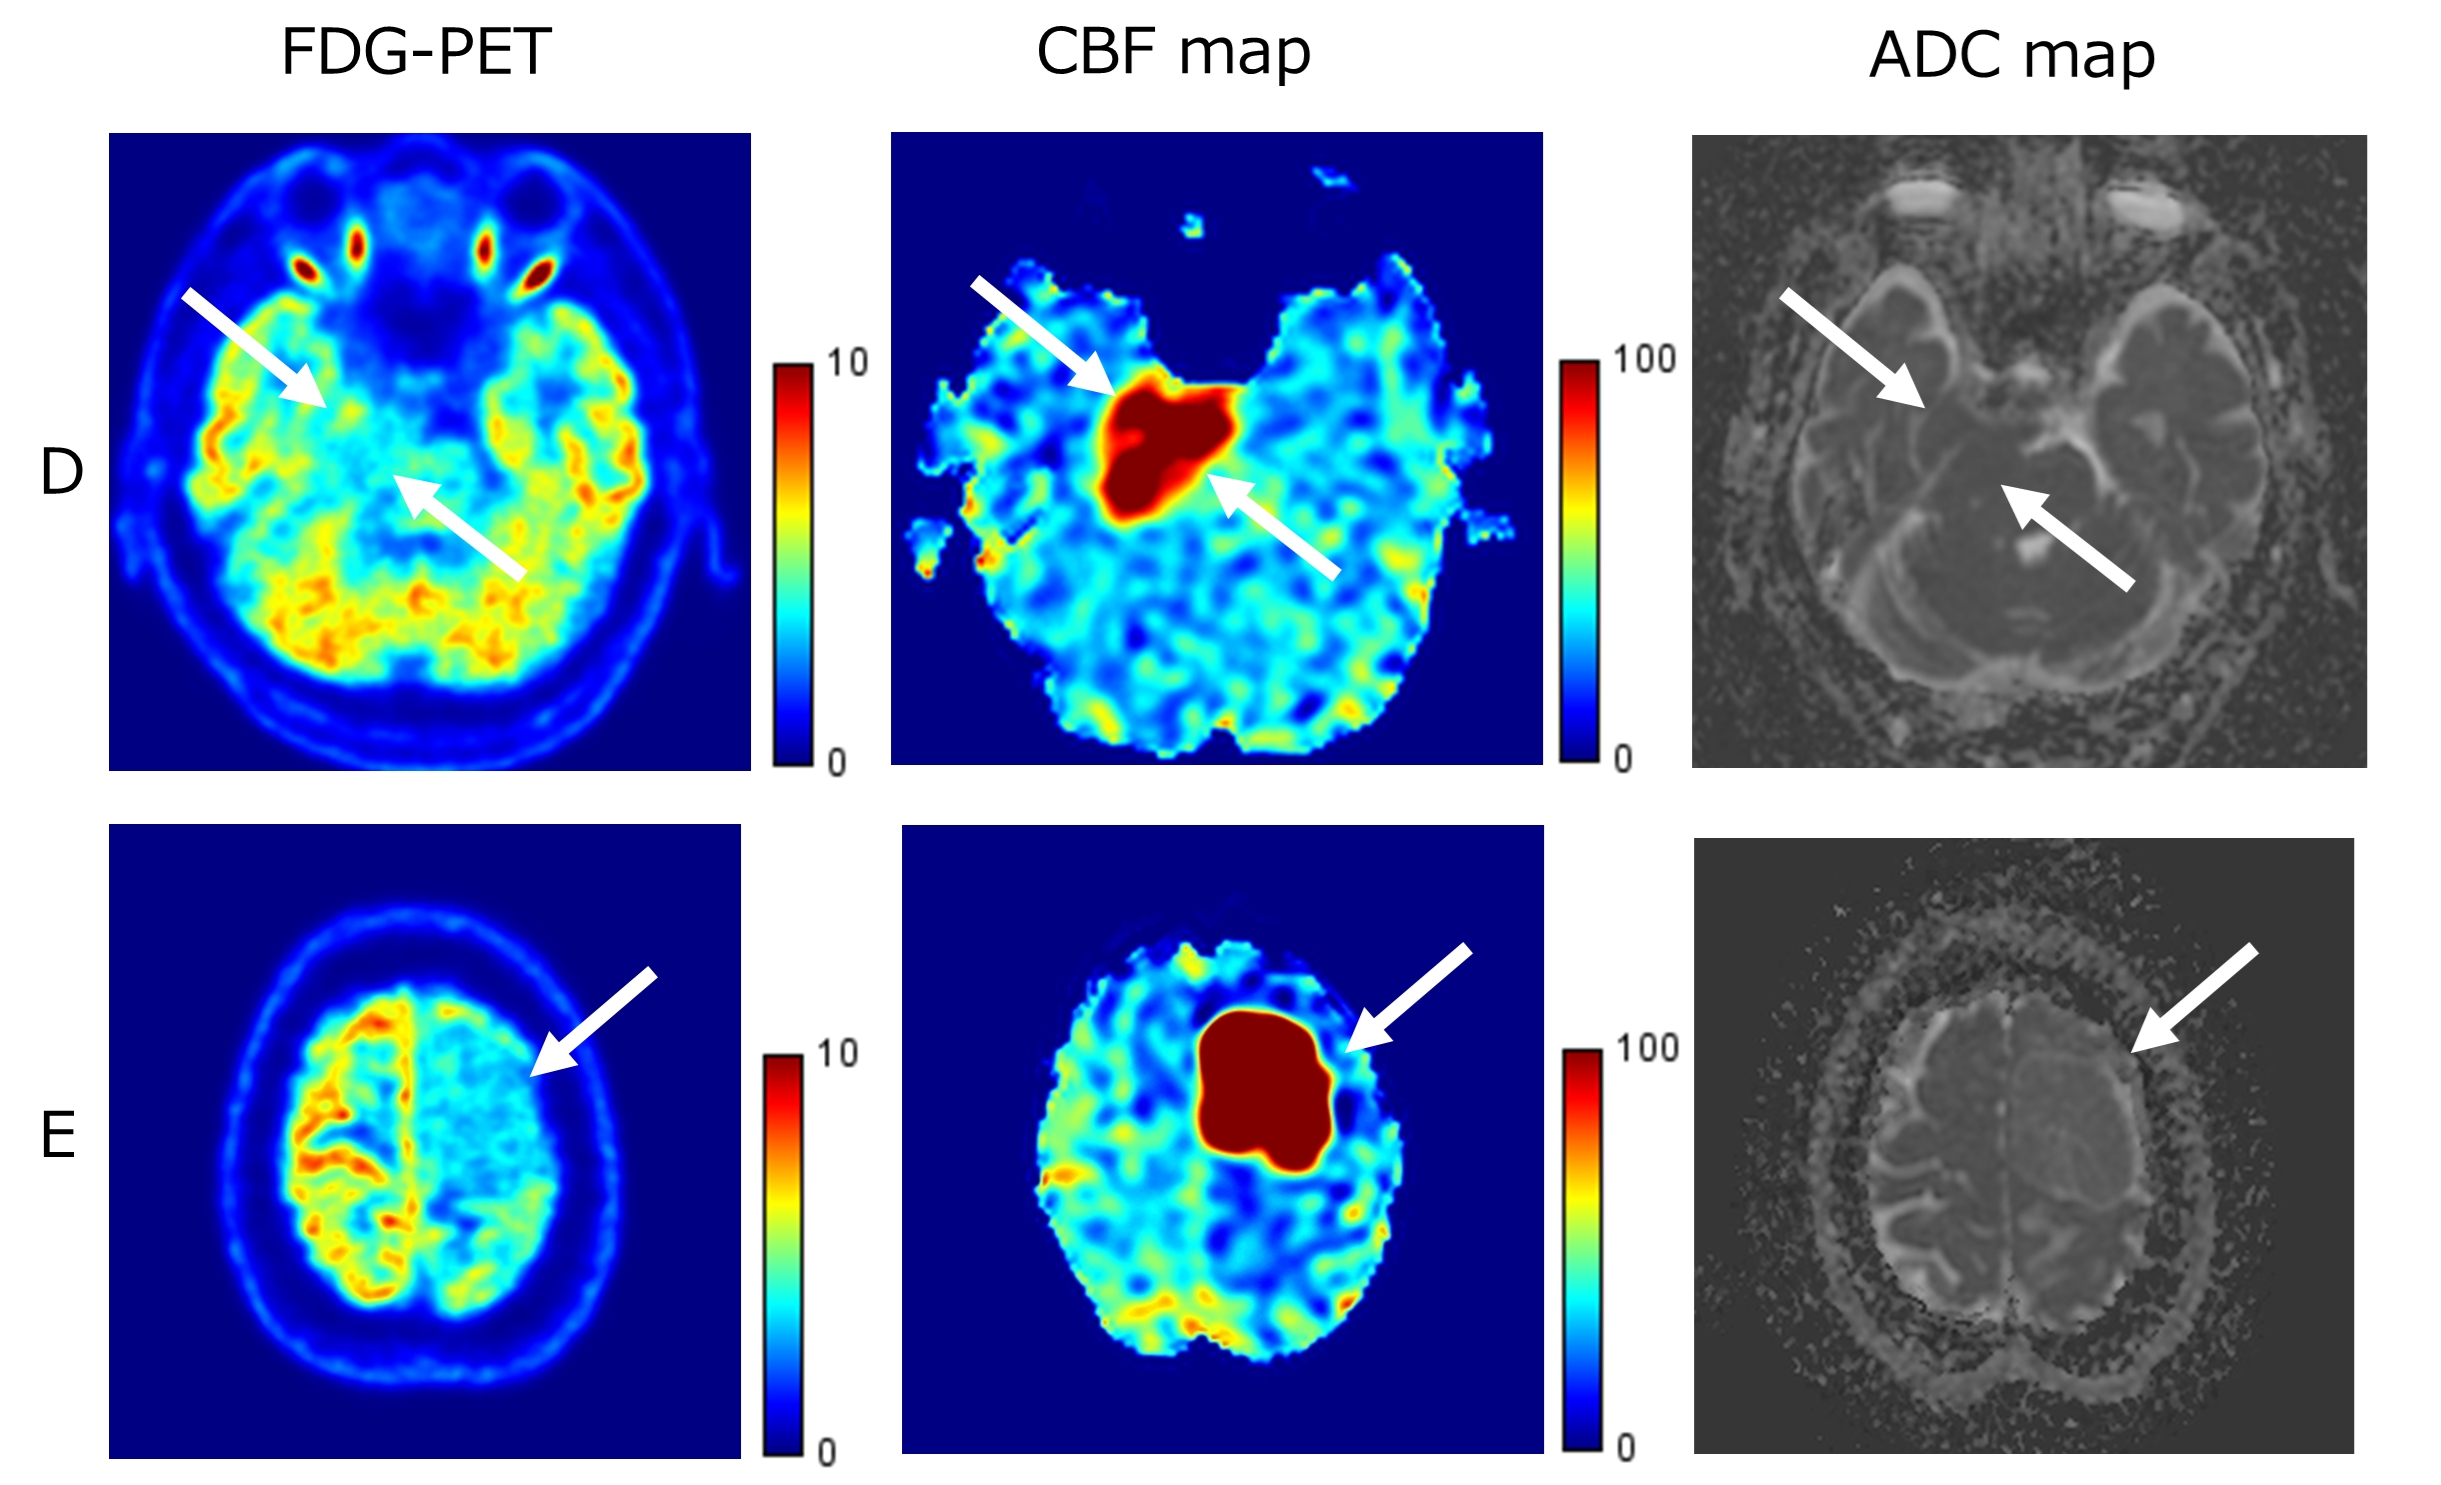
Figure2
D: 80 years old, male, suspicious of meningioma, low SUV 3.5, high TBF 111.7, ADC 696.0
E: 51 years old, female, meningothelial meningioma, low SUV 3.3, high TBF 290. 4, ADC 981.6
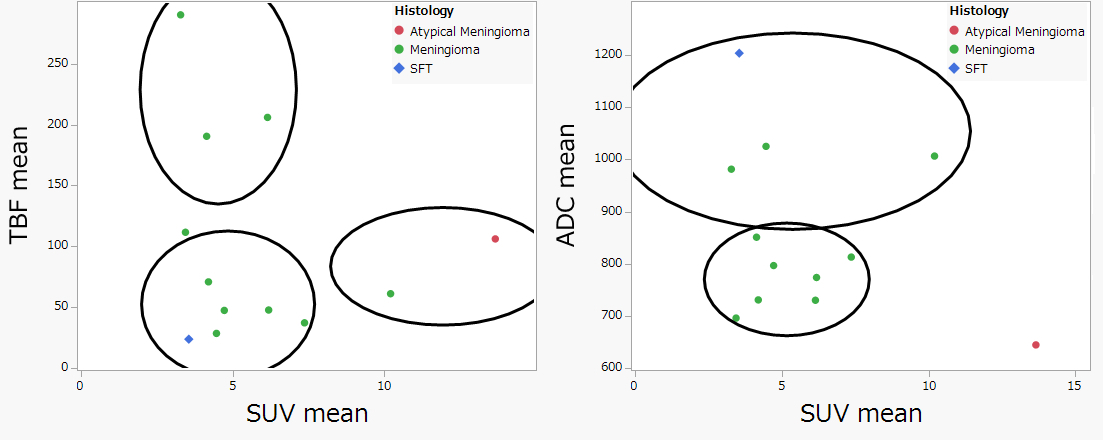
Figure3
K-means clustering analysis showed three clusters in this study.
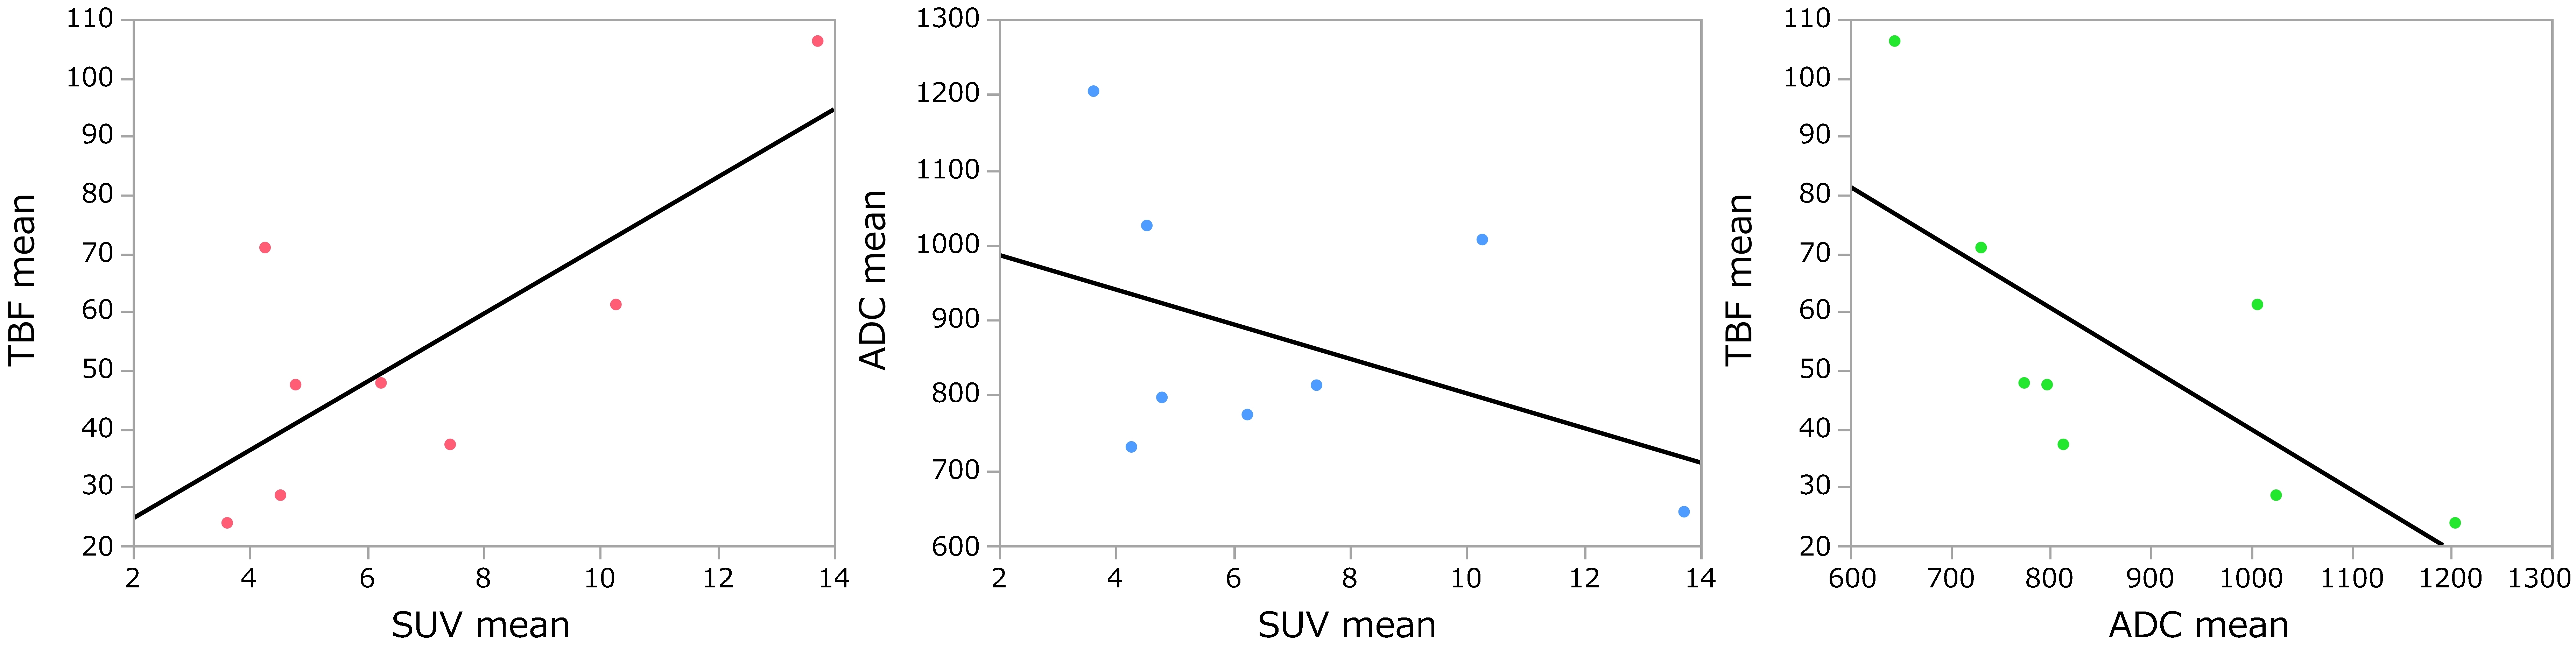
Figure4
There were correlations between SUV mean and TBF mean, between SUV mean and ADC mean and between TBF mean and ADC mean among the 8 patients with TBF less than 110 ml/100g/min. SUV mean correlated positively with TBF mean (ρ=0.57, P=0.14). SUV mean correlated negatively with ADC mean (ρ= -0.43, P=0.29). TBF mean correlated negatively with ADC mean (ρ= -0.86, P=0.01).
Table
The median values of FDG mean, TBF mean and ADC mean are shown by histopathological diagnosis.