4287
Whole-Body Tumor Load ADC Histogram Analysis for Therapy Response Prediction and Evaluation for Multiple Myeloma1Peking Union Medical College Hospital, Beijing, China, 2Tianjin First Central Hospital, Tianjin, China, 3Siemens Healthcare, Beijing, China, 4MR Application Predevelopment, Siemens Healthcare GmbH, Erlangen, Germany
Synopsis
This study aimed to explore the value of histogram analysis of apparent diffusion coefficient (ADC) maps for whole-body tumor load(WBTL) in predicting and evaluating the treatment response based on International Myeloma Working Group (IMWG) 2016 consensus criteria in patients with multiple myeloma (MM).Histogram analysis of ADC maps extracted eight parameters: mean, median, standard-deviation, entropy, skewness, kurtosis, ADC_5%, and ADC_95%. Seven parameters at baseline were significantly associated with therapy response. Three parameters in treatment percentage change were significantly associated with therapy response. ADC histogram analysis may be considered as an adjunct tool to the MM therapy response evaluation and prediction.
Introduction and Purpose
Multiple myeloma (MM) is a systemic disease that widely affects bone marrow, and may also cause extramedullary lesions. Additionally, MM is spatially heterogeneous (lesions at different sites may express different biological risks). Therefore, it is vital to evaluate whole-body tumor load(WBTL) when assessing or predicting therapy response. The International Myeloma Working Group (IMWG) 2016 consensus is used for response assessment[1]. Quantitative assessment of tumor load is performed by blood and urine tests and bone marrow examination. However, blood and urine tests are indirect indicators, with the sensitivity of 82% for serum protein electrophoresis (SPEP) and 78% for urine monoclonal light chain, and both could not be detected in non-secretory MM(about 3%)[2]. In addition, bone marrow puncture does not overcome spatial heterogeneity. MRI is considered the gold standard modality for evaluation of bone marrow infiltration[3]. Previous studies have focused on selected regions of interest (ROIs) to predict or evaluate therapy response[4-7]. This study aimed to explore the value of WBTL histogram parameters derived from apparent diffusion coefficient (ADC) maps in predicting and evaluating the treatment response based on IMWG 2016 consensus criteria in MM.Methods
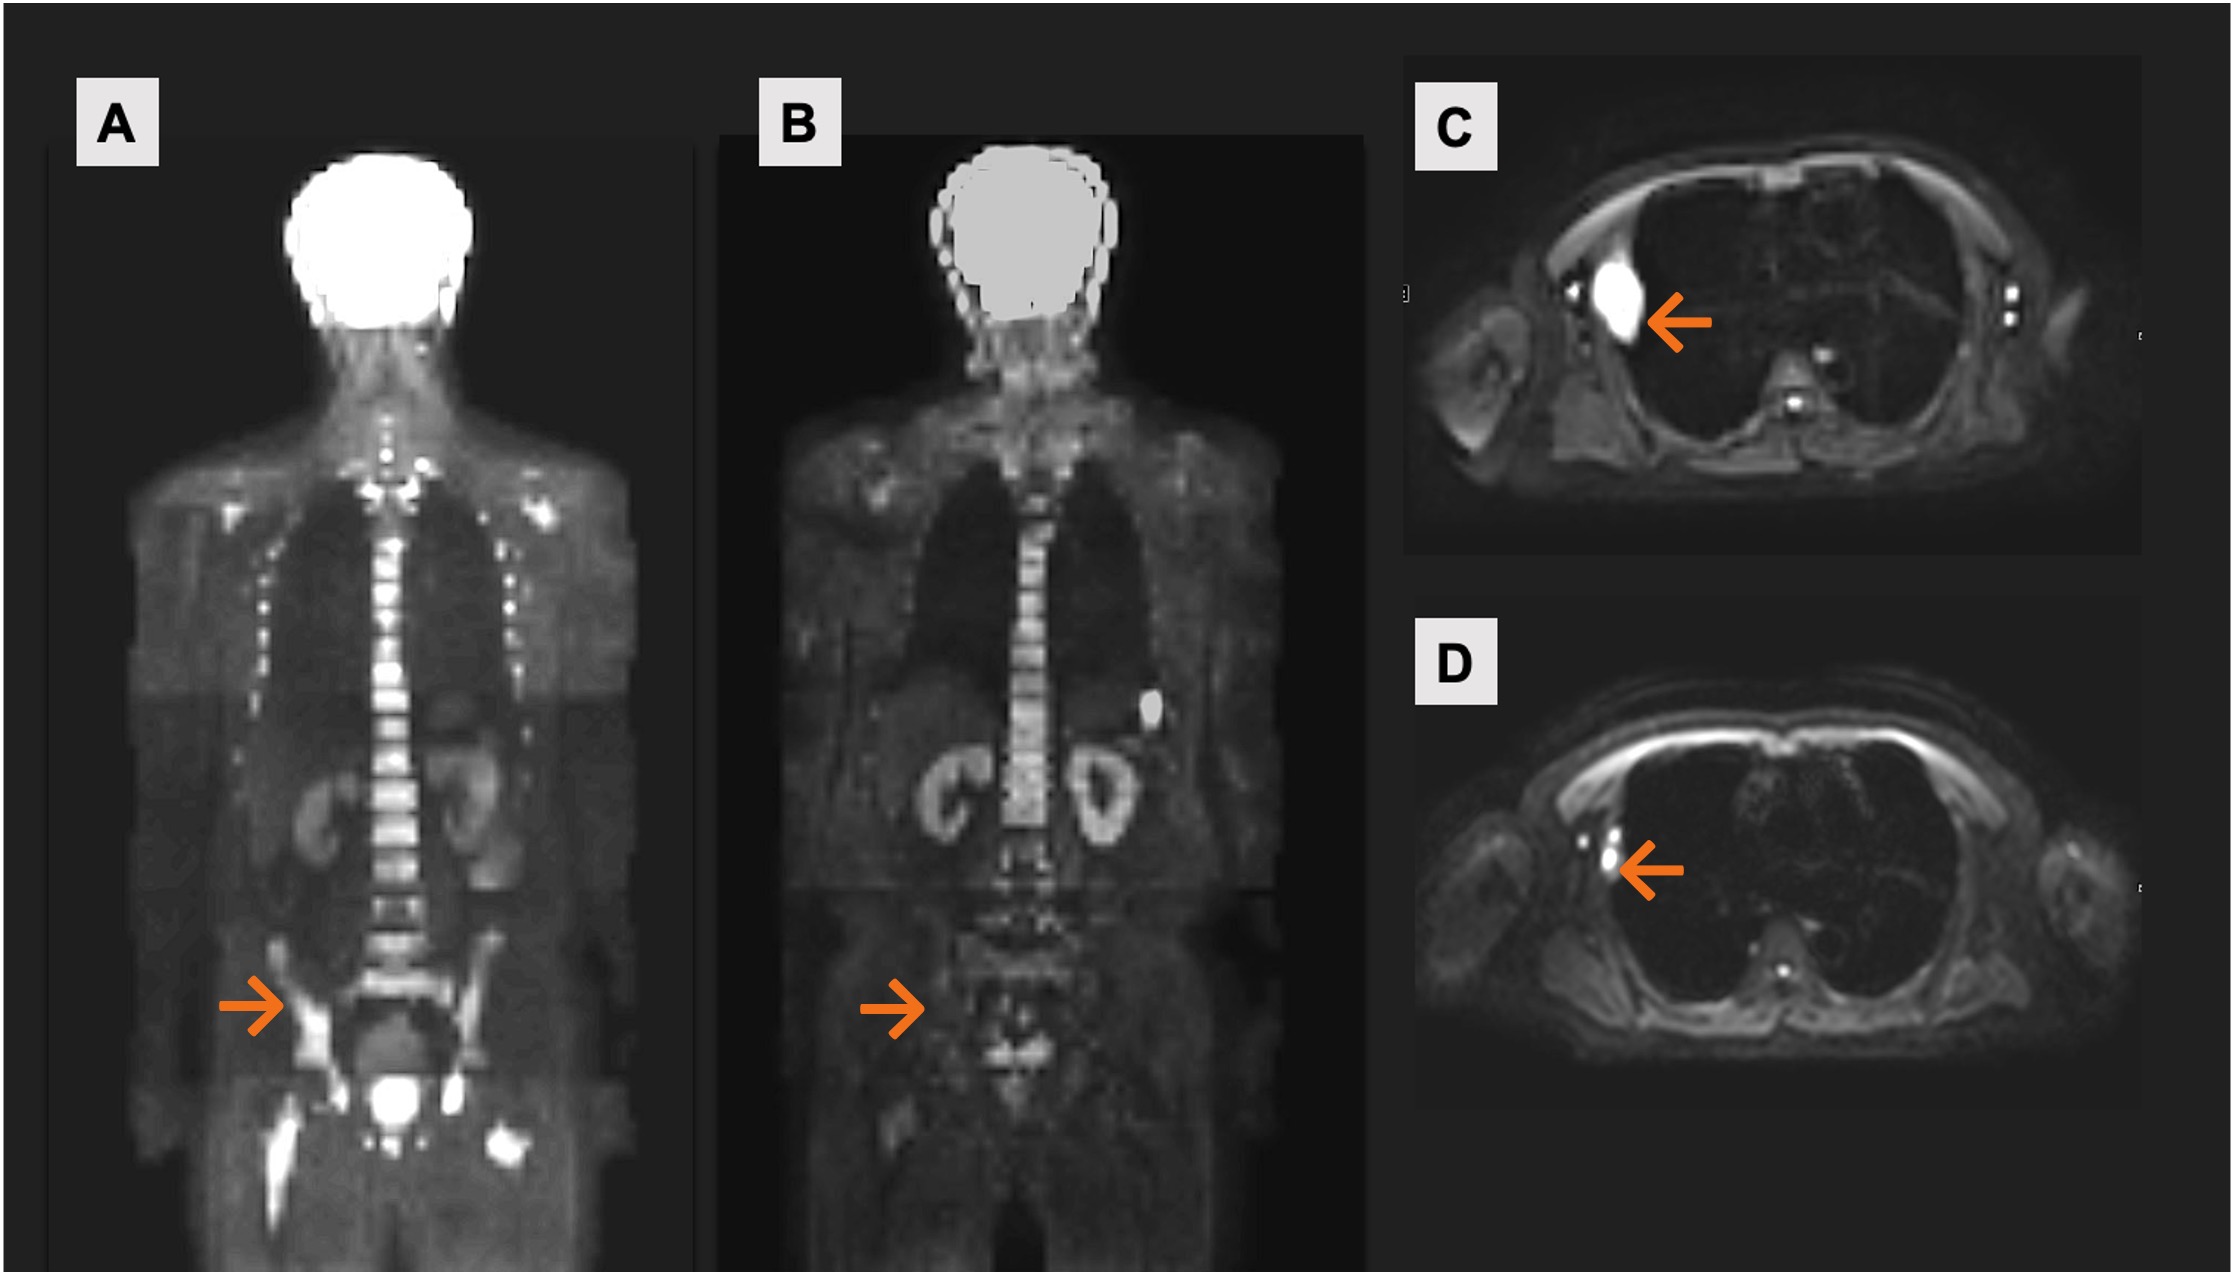
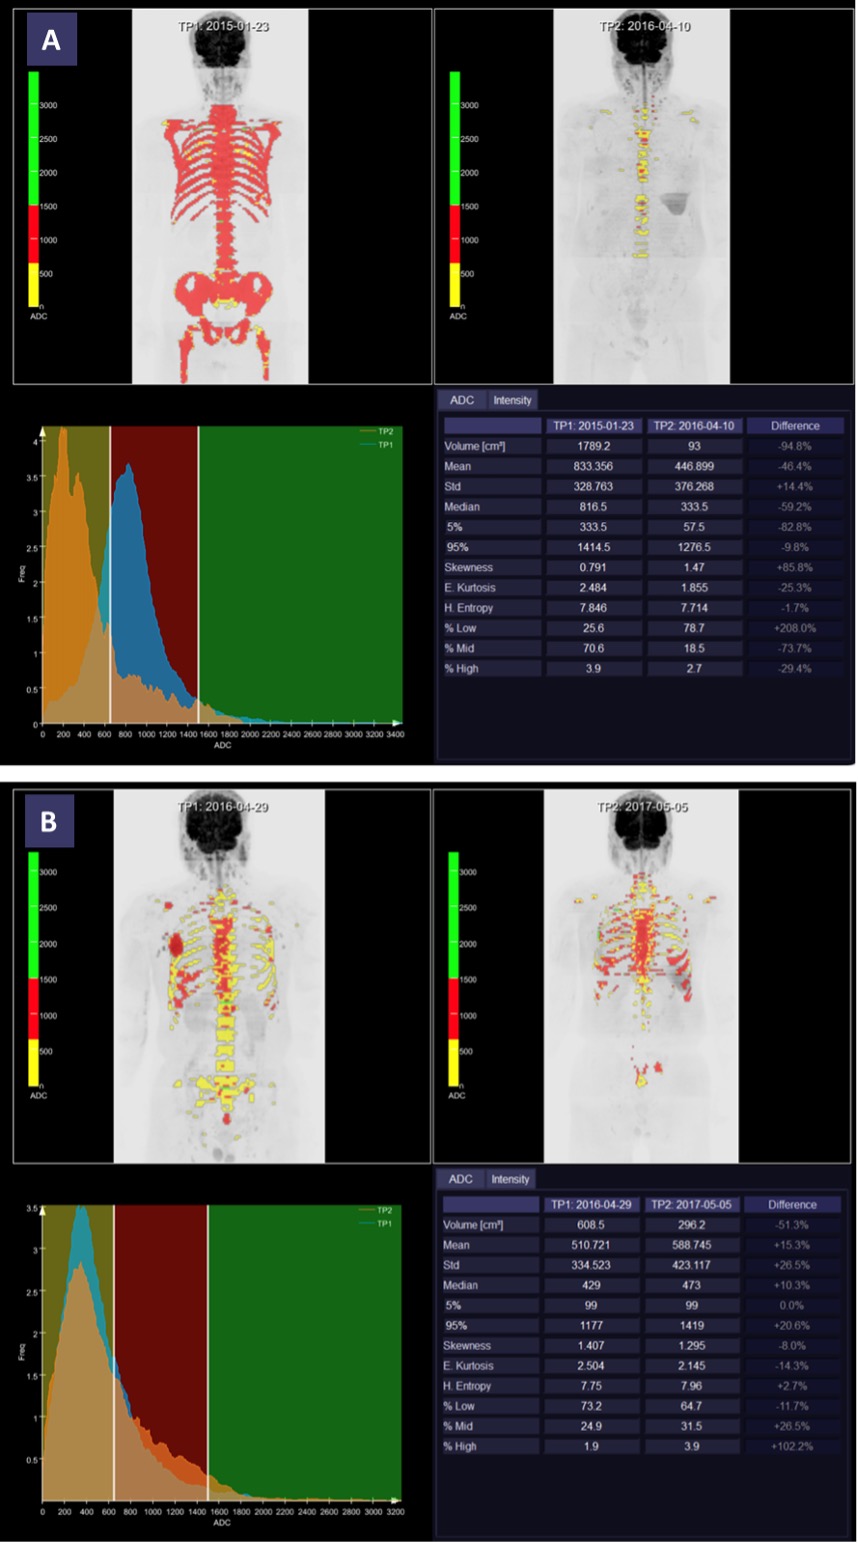
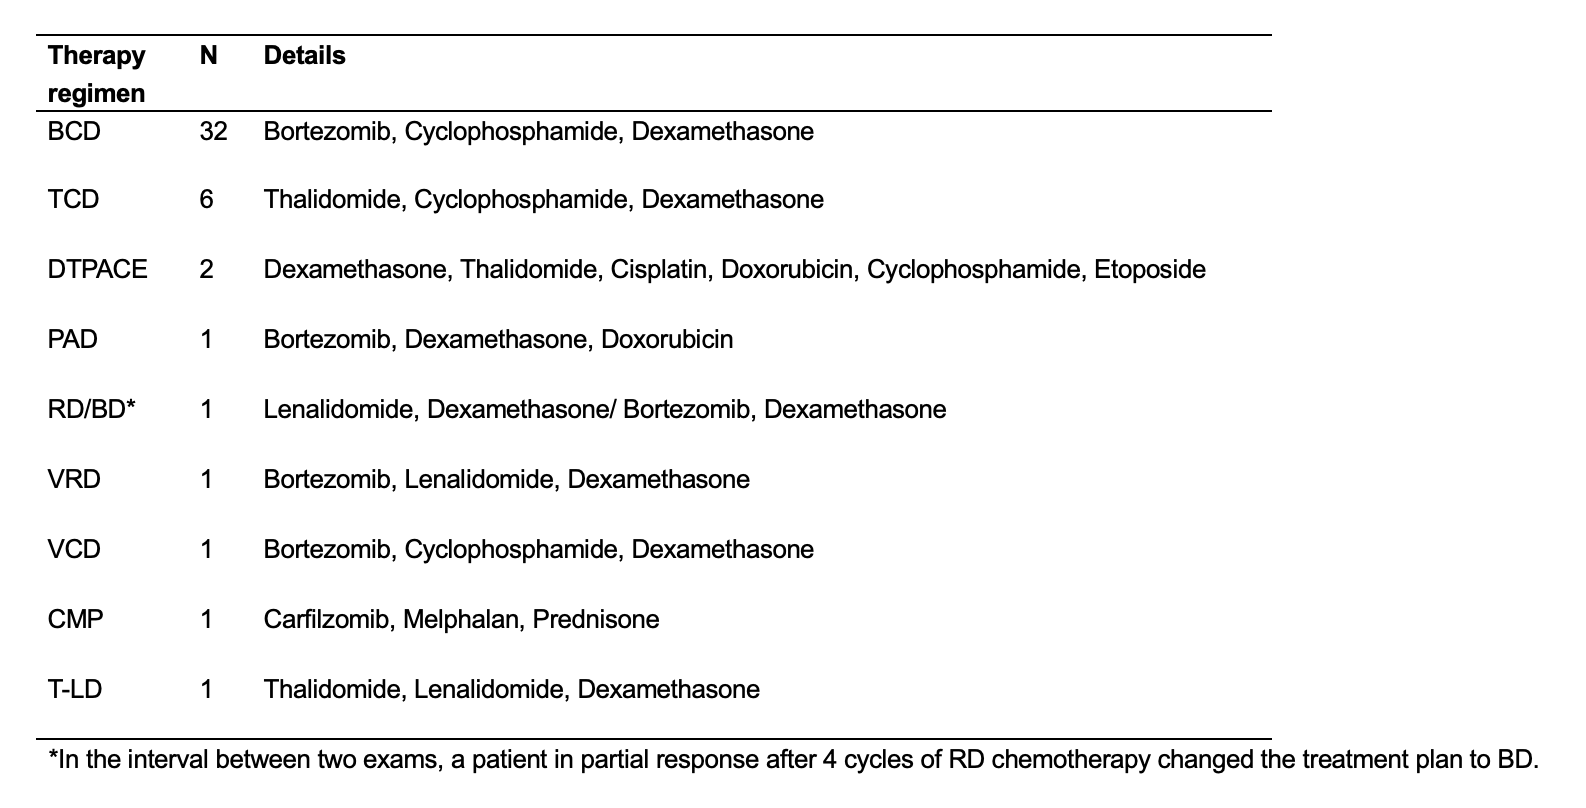
A total of 46 patients with newly-diagnosed MM were recruited retrospectively. All the patients received chemical therapy after diagnosis(Table 1), and the mean follow-up time was 9.7months [2.4-26.2months]. According to IMWG 2016 consensus, the patients were classified into two groups: good response (complete response/very good partial response, CR/VGPR) group (n=38) and poor response (partial response/stable disease/progressive disease, PR/SD/PD) group (n=8).All patients underwent whole-body diffusion-weighted imaging (WB-DWI) on a 3T MR scanner (MAGNETOM Skyra, Siemens Healthcare, Erlangen, Germany) before receiving therapy and again after therapy. The WB-DWI images were acquired using a prototypic slice-specific dynamic shimming (iShim) DWI sequence with the following parameters: TR/TE = 7920/60ms, FOV = 430×296 mm2, GRAPPA acceleration factor 2, slice thickness = 5 mm, voxel size = 3.4×3.4×5 mm3, number of slices per bed position = 35, number of bed positions = 5-6 (covering from head to thigh), fat suppression with slice-selective inversion recovery, two b values 50 and 800 s/mm2, and Stejskal-Tanner diffusion sensitization with dynamic field correction. Acquisition time per station = 3min12s. Apparent diffusion coefficient (ADC) maps were generated inline after data acquisition.Histogram analysis of the ADC maps was performed using a prototype postprocessing software (MR Total Tumor Load, Siemens Healthcare, Erlangen, Germany). All body lesions except the skull were included. The software extracts histogram features through histogram quantification using eight parameters: mean, median, standard-deviation, entropy, skewness, kurtosis, ADC_5%, and ADC_95%.A standard clinical tumor load assessment was performed, including collection of percentage of plasma cells (BMPC%), SPEP for non-light chain MM, 24h urine free light chain (uFLC) for light chain MM, and symptoms of “CRAB” (end-organ injury as hypercalcemia, renal insufficiency, anemia and bone lesions).Differences between response groups were determined by independent sample T-test or Mann-Whitney U-test. The correlation between clinical tumor load indicators and histogram parameters was calculated by Pearson correlation test. The percent of change before and after therapy was determined by paired T-test. A receiver operating characteristic (ROC) analysis of the ADC-based histogram parameters was performed to predict therapy response.Results
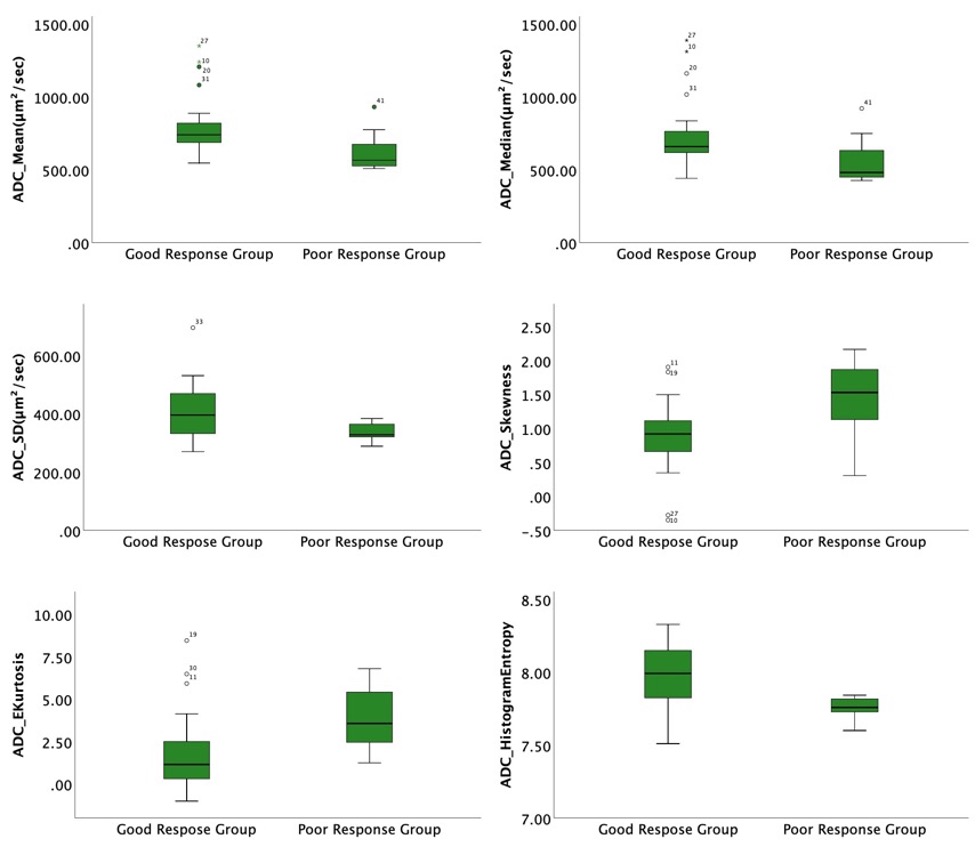
Patients in the good response group had significantly higher baseline entropy (P<0.001), standard deviation (P=0.027), ADC_95% (P=0.003), mean (P=0.008), and median (P=0.011), and lower baseline skewness (P=0.008) and kurtosis (P=0.003) than the poor response group (Figure 1). Entropy and kurtosis were significantly correlated with BMPC% (entropy: rs=-0.324, P=0.032; kurtosis: rs =0.352, P=0.019). A marginal significant positive correlation was found between skewness and BMPC%(rs=0.289, P=0.057). None of the histogram parameters were correlated to SPEP or 24h UFLC. No association was found between patient baseline histogram parameters and end-organ injury. Among the ADC-based histogram parameters, kurtosis and entropy both showed the highest area under the ROC curve (AUC) when predicting good therapy response (kurtosis: AUC=0.829 (95% CI:0.700-0.958); entropy: AUC=0.826 (95% CI:0.709-0.943)). Based on histogram analysis, patients with IMWG good response had a significantly higher percent change in mean (P=0.013), median (P=0.013), and ADC_5% (P=0.010)(Figure 2-3).Discussion
This study presents preliminary evidence of the value in ADC histogram analysis of WB-DWI on predicting and evaluating the treatment response in patients with MM. Because the parameters derived from histogram analysis can provide additional information in predicting and depicting therapy response, they may aid in overcoming the bottleneck of clinical efficacy evaluation without adding any MR sequences or increasing scan time. The ADC histogram analysis of WBTL may be considered as an adjunct tool to the MM therapy response evaluation and prediction.Conclusion
ADC histogram analysis of WBTL at baseline and treatment percentage change were significantly correlated with therapy response in MM patients and may serve as quantitative markers for predicting and evaluating therapy response.Acknowledgements
No acknowledgement found.References
1 Kumar S, Paiva B, Anderson KC, Durie B, Landgren O, Moreau P, Munshi N, Lonial S, Blade J, Mateos MV, Dimopoulos M, Kastritis E, Boccadoro M, Orlowski R, Goldschmidt H, Spencer A, Hou J, Chng WJ, Usmani SZ, Zamagni E, Shimizu K, Jagannath S, Johnsen HE, Terpos E, Reiman A, Kyle RA, Sonneveld P, Richardson PG, McCarthy P, Ludwig H, Chen W, Cavo M, Harousseau JL, Lentzsch S, Hillengass J, Palumbo A, Orfao A, Rajkumar SV, Miguel JS, Avet-Loiseau H.International Myeloma Working Group consensus criteria for response and minimal residual disease assessment in multiple myeloma. Lancet Oncol,2016,17 (8): e328-e346.
2 Kyle RA, Gertz MA, Witzig TE, Lust JA, Lacy MQ, Dispenzieri A, Fonseca R, Rajkumar SV, Offord JR, Larson DR, Plevak ME, Therneau TM, Greipp PR.Review of 1027 patients with newly diagnosed multiple myeloma. Mayo Clin Proc,2003,78 (1): 21-33.
3 Moreau P, San Miguel J, Sonneveld P, Mateos MV, Zamagni E, Avet-Loiseau H, Hajek R, Dimopoulos MA, Ludwig H, Einsele H, Zweegman S, Facon T, Cavo M, Terpos E, Goldschmidt H, Attal M, Buske C, Committee EG.Multiple myeloma: ESMO Clinical Practice Guidelines for diagnosis, treatment and follow-up. Ann Oncol,2017,28 (suppl_4): iv52-iv61.
4 Dong H, Huang W, Ji X, Huang L, Zou D, Hao M, Deng S, Shen Z, Lu X, Wang J, Song Z, Zhang X, Xue H, Xia S.Prediction of Early Treatment Response in Multiple Myeloma Using MY-RADS Total Burden Score, ADC, and Fat Fraction From Whole-Body MRI: Impact of Anemia on Predictive Performance. AJR Am J Roentgenol,2021:
5 Zhang L, Wang Q, Wu X, Zhao A, Feng J, Zhang H, Cao X, Li S, Cai H, Sun Z, Duan M, Zhu T, Zhang W, Jin Z, Zhou D, Xue H, Li J.Baseline bone marrow ADC value of diffusion-weighted MRI: a potential independent predictor for progression and death in patients with newly diagnosed multiple myeloma. Eur Radiol,2021,31 (4): 1843-1852.
6 Park HY, Kim KW, Yoon MA, Lee MH, Chae EJ, Lee JH, Chung HW, Yoon DH.Role of whole-body MRI for treatment response assessment in multiple myeloma: comparison between clinical response and imaging response. Cancer Imaging,2020,20 (1): 14.
7 Latifoltojar A, Hall-Craggs M, Bainbridge A, Rabin N, Popat R, Rismani A, D'Sa S, Dikaios N, Sokolska M, Antonelli M, Ourselin S, Yong K, Taylor SA, Halligan S, Punwani S.Whole-body MRI quantitative biomarkers are associated significantly with treatment response in patients with newly diagnosed symptomatic multiple myeloma following bortezomib induction. Eur Radiol,2017,27 (12): 5325-5336.
Figures