4286
Developing CEST-detectable liposomal hydrogel for monitoring local brain tumor treatment
Se Weon Park1,2, Joseph H.C Lai1, Xiongqi Han3, Jianpan Huang1, Peng Xiao1, and Kannie W.Y. Chan1,4,5
1Department of Biomedical Engineering, City University of Hong Kong, Hong Kong, Hong Kong, 2Hong Kong Centre for Cerebro-Cardiovascular Health Engineering (COCHE), Hong Kong, Hong Kong, 3SiBionics, Shenzhen, China, 4Russell H. Morgan Department of Radiology and Radiological Science, The Johns Hopkins University School of Medicine, Baltimore, MD, United States, 5City University of Hong Kong Shenzhen Research Institute, Shenzhen, China
1Department of Biomedical Engineering, City University of Hong Kong, Hong Kong, Hong Kong, 2Hong Kong Centre for Cerebro-Cardiovascular Health Engineering (COCHE), Hong Kong, Hong Kong, 3SiBionics, Shenzhen, China, 4Russell H. Morgan Department of Radiology and Radiological Science, The Johns Hopkins University School of Medicine, Baltimore, MD, United States, 5City University of Hong Kong Shenzhen Research Institute, Shenzhen, China
Synopsis
Glioblastoma is a malignant form of brain tumors, which has a high recurrence even with combined treatments. Here, we developed anti-cancer drugs loaded liposomal hydrogels for sustainable drug release to treat brain tumors locally under MRI guidance. These anti-cancer drugs are CEST-detectable. We observed a continuous decrease in tumor size and CEST contrast at 3.5 and -3.5 ppm compared to control group, where drug-free liposomal hydrogel was injected. The therapeutic efficacy of local drug delivery using liposomal hydrogel was evidenced and can be monitored using CEST multiple-contrast approach. This could serve a robust theranostic application for local brain tumor treatment.
Introduction
Glioblastoma(GBM) is one of the most aggressive brain tumors in human brain1. Several targeted drug delivery approaches, including Gliadel wafer have shown promises to treat glioblastoma, however the limited coverage of the tumor resection site by the wafer and the resulted edema have limited the efficacy of this local treatment2, 3. Hydrogel is a common biomaterial for drug delivery, which could address the limitations of Gliadel wafer4. Liposomal hydrogel loaded with CEST-detectable chemotherapeutics5, such as Gemcitabine (Gem) and methotrexate (MTX)6, has been reported to demonstrate sustainable drug release and anti-U87 efficacy, in in-vitro7. Moreover, previous study has shown that signal at 3.5 ppm could indicate tumor recurrence8-11 and liposome generated natural CEST contrasts at -3.5 ppm due to the presence of aliphatic protons12. In this study, we injected the optimized liposomal hydrogel containing both Gem and MTX next to the mouse brain tumor, and monitored the tumor size and CEST contrast longitudinally. Moreover, we optimized the cholesterol content of liposomes to provide a sustainable release of chemotherapeutics13, 14. Therefore, this study could provide an effective drug delivery approach and image-guided local brain tumor treatment.Methods
Liposomes were prepared using thin-film hydration method15. DPPC, cholesterol and DSPE-PEG2000 were mixed at a molar ratio of 0.489:1.192:0.022. Gem solution (20 mg/ml, pH 7.0) was then added to hydrate the lipid (25 mg/ml) film, and the mixture was sonicated for 30 minutes at 55°C. Gem-loaded liposome was filtered through 400 nm polycarbonate filter and Sephadex column. MTX (5 mg/ml) and alginate powder (10 mg/ml) were mixed with liposome solution. The resulting mixture (MGLH) was mixed with calcium D-gluconate solution (4.32%) with volume ratio of 10:1. The control hydrogel (LH) was fabricated in a similar manner without drugs.NOD-SCID mice (6-8 weeks, n=6) were injected with U-87 MG cell (0.5 M/ 3ul) at 2.0 mm right-lateral, 0.2 mm anterior and 3.8 mm below the bregma. After 2 weeks, hydrogel was injected at 2.2 mm right-lateral, 0.2 mm anterior and 3.0 mm below the bregma.
3T Bruker Biospec system (Bruker, Ettlingen, Germany) was used for imaging. T2-weighted images and CEST were acquired, with 2 days interval. The saturation power (B1) and time (Tsat) were 0.8 uT and 3 secs, respectively. 3.5, 2.4 and -3.5 ppm were extracted for analysis using Lorentzian-fitted water signal.
Results and Discussion
We imaged the two groups of mice, i.e. liposomal hydrogel with Gem and MTX (MGLH); and liposomal hydrogel without drugs (LH). Before hydrogel injection and on day 0, tumor sizes for two groups are comparable. Starting from day 2, we observed a decrease in tumor size in treatment MGLH (Fig 1A), and an increase in the tumor size increase in LH (Fig 1B). MGLH showed a 54% reduction in tumor size on day 6, while LH showed a 148% increase in the tumor size, when compared to that before hydrogel injection. A significant difference in the tumor size was observed on day 2, 4, and 6 with P=0.005, P=0.001 and P=0.0009, respectively (Fig. 1C). This indicated the treatment effect of dual drug-loaded liposomal hydrogel. Moreover, Gem was loaded in liposomes, while MTX was mixed with hydrogel. The persistent decrease in tumor size over 6 days supports our design that could facilitate a sustainable drug release locally.The MGLH showed significantly higher CEST signal of 3.7% compared to LH in-vitro, which was 0.6% at 2.4 ppm (P<0.0001, n=5), which is in line with our previous study that two drugs generate natural CEST contrast at 2.4 ppm (Fig 2C)7. For CEST analysis in-vivo, two different ROIs, tumor and hydrogel region, were analysed at corresponding offset frequencies (Fig 3A-D). In tumor, significant differences were observed at 3.5 ppm (P=0.038, 0.030) and -3.5 ppm (P=0.021, 0.019) on day 2 and 6 (Fig. 3A,B). On day 6, tumor of MGLH showed a 28% decrease at 3.5 ppm and a 36% decrease at -3.5 ppm, which corresponds to a significant decrease in tumor size in MGLH when compared to LH (Fig. 1A,B). Increase in tumor size might led to higher signal at 3.5 ppm, according to the previous study8-11. The decrease in both CEST contrast at 3.5 ppm and -3.5 ppm in MGLH could be due to tumor necrosis or apoptosis (Fig 3A,B)16, which indicated the treatment efficacy. CEST contrast at 2.4 ppm of MGLH was consistently higher than that of LH over the first few days after injection, which is in line with our in-vitro study (Fig 2C,3C). In our future study, mice will be monitored in a longer period of time to observe long term therapeutic effect, and histology is underway.
Conclusion
In this study, we have shown therapeutic effect on tumor with the injection of dual drug-loaded liposomal hydrogel, as a result of 54% decrease in tumor size, and CEST contrast at 3.5 and -3.5 ppm decreased (28% and 36% respectively) when tumor size decreased. Moreover, CEST contrast at 2.4 ppm of MGLH was consistently higher than that of LH. This implies a promising approach to treat brain tumor locally and to monitor the treatment outcome longitudinally using multiple CEST contrast approach. Further studies include longitudinal imaging and validations with histology are underway.Acknowledgements
Authors are grateful to receive funding support from the Research Grants Council: 11102218; City University of Hong Kong: 7005210, 7005433, 9680247, 9667198 and 9609307; National Natural Science Foundation of China: 81871409.References
1. Wirsching H-G, Galanis E, Weller M. Chapter 23 - Glioblastoma. Handbook of Clinical Neurology. 2016:381-397.2. Panigrahi M, Das PK, Parikh PM. Brain tumor and Gliadel wafer treatment. Indian J Cancer. 2011;48(1):11-17.
3. Bota DA, Desjardins A, Quinn JA, et al. Interstitial chemotherapy with biodegradable BCNU (Gliadel) wafers in the treatment of malignant gliomas. Ther Clin Risk Manag. 2007;3(5):707-715.
4. Rowland MJ, Parkins CC, McAbee JH, et al. An adherent tissue-inspired hydrogel delivery vehicle utilised in primary human glioma models. Biomaterials. 2018;179:199-208.
5. Li Y, Chen H, Xu J, et al. CEST theranostics: label-free MR imaging of anticancer drugs. Oncotarget. 2016;7(6):6369-6378.
6. Mini E, Nobili S, Caciagli B, et al. Cellular pharmacology of gemcitabine. Ann Oncol. 2006;17 Suppl 5:v7-12.
7. Han X, Huang J, Chan KWY. CEST-MRI guided sequential drug delivery using injectable hydrogel for local treatment in the brain. ISMRM & SMRT Virtual Conference & Exhibition. 2021. #0077.
8. Lee DH, Heo HY, Zhang K, et al. Quantitative assessment of the effects of water proton concentration and water T1 changes on amide proton transfer (APT) and nuclear overhauser enhancement (NOE) MRI: The origin of the APT imaging signal in brain tumor. Magn Reson Med. 2017;77(2):855-863.
9. Khlebnikov V, Polders D, Hendrikse J, et al. Amide proton transfer (APT) imaging of brain tumors at 7 T: The role of tissue water T1 -Relaxation properties. Magn Reson Med. 2017;77(4):1525-1532.
10. Zhou J, Hong X, Zhao X, et al. APT-weighted and NOE-weighted image contrasts in glioma with different RF saturation powers based on magnetization transfer ratio asymmetry analyses. Magn Reson Med. 2013;70(2):320-327.
11. Zhou J, Tryggestad E, Wen Z, et al. Differentiation between glioma and radiation necrosis using molecular magnetic resonance imaging of endogenous proteins and peptides. Nat Med. 2011;17(1):130-134.
12. Han X, Huang J, To AKW, et al. CEST MRI detectable liposomal hydrogels for multiparametric monitoring in the brain at 3T. Theranostics. 2020;10(5):2215-2228.
13. Briuglia ML, Rotella C, McFarlane A, et al. Influence of cholesterol on liposome stability and on in vitro drug release. Drug Deliv Transl Res. 2015;5(3):231-242.
14. Chan KWY, Liu G, Song X, et al. MRI-detectable pH nanosensors incorporated into hydrogels for in vivo sensing of transplanted-cell viability. Nat Mat. 2013;12(3):268-275.
15. Nordling-David MM, Yaffe R, Guez D, et al. Liposomal temozolomide drug delivery using convection enhanced delivery. J Control Release. 2017;261:138-146.
16. Tan Z, Lam WW, Oakden W, et al. Saturation transfer properties of tumour xenografts derived from prostate cancer cell lines 22Rv1 and DU145. Sci Rep. 2020;10(1):21315.
Figures
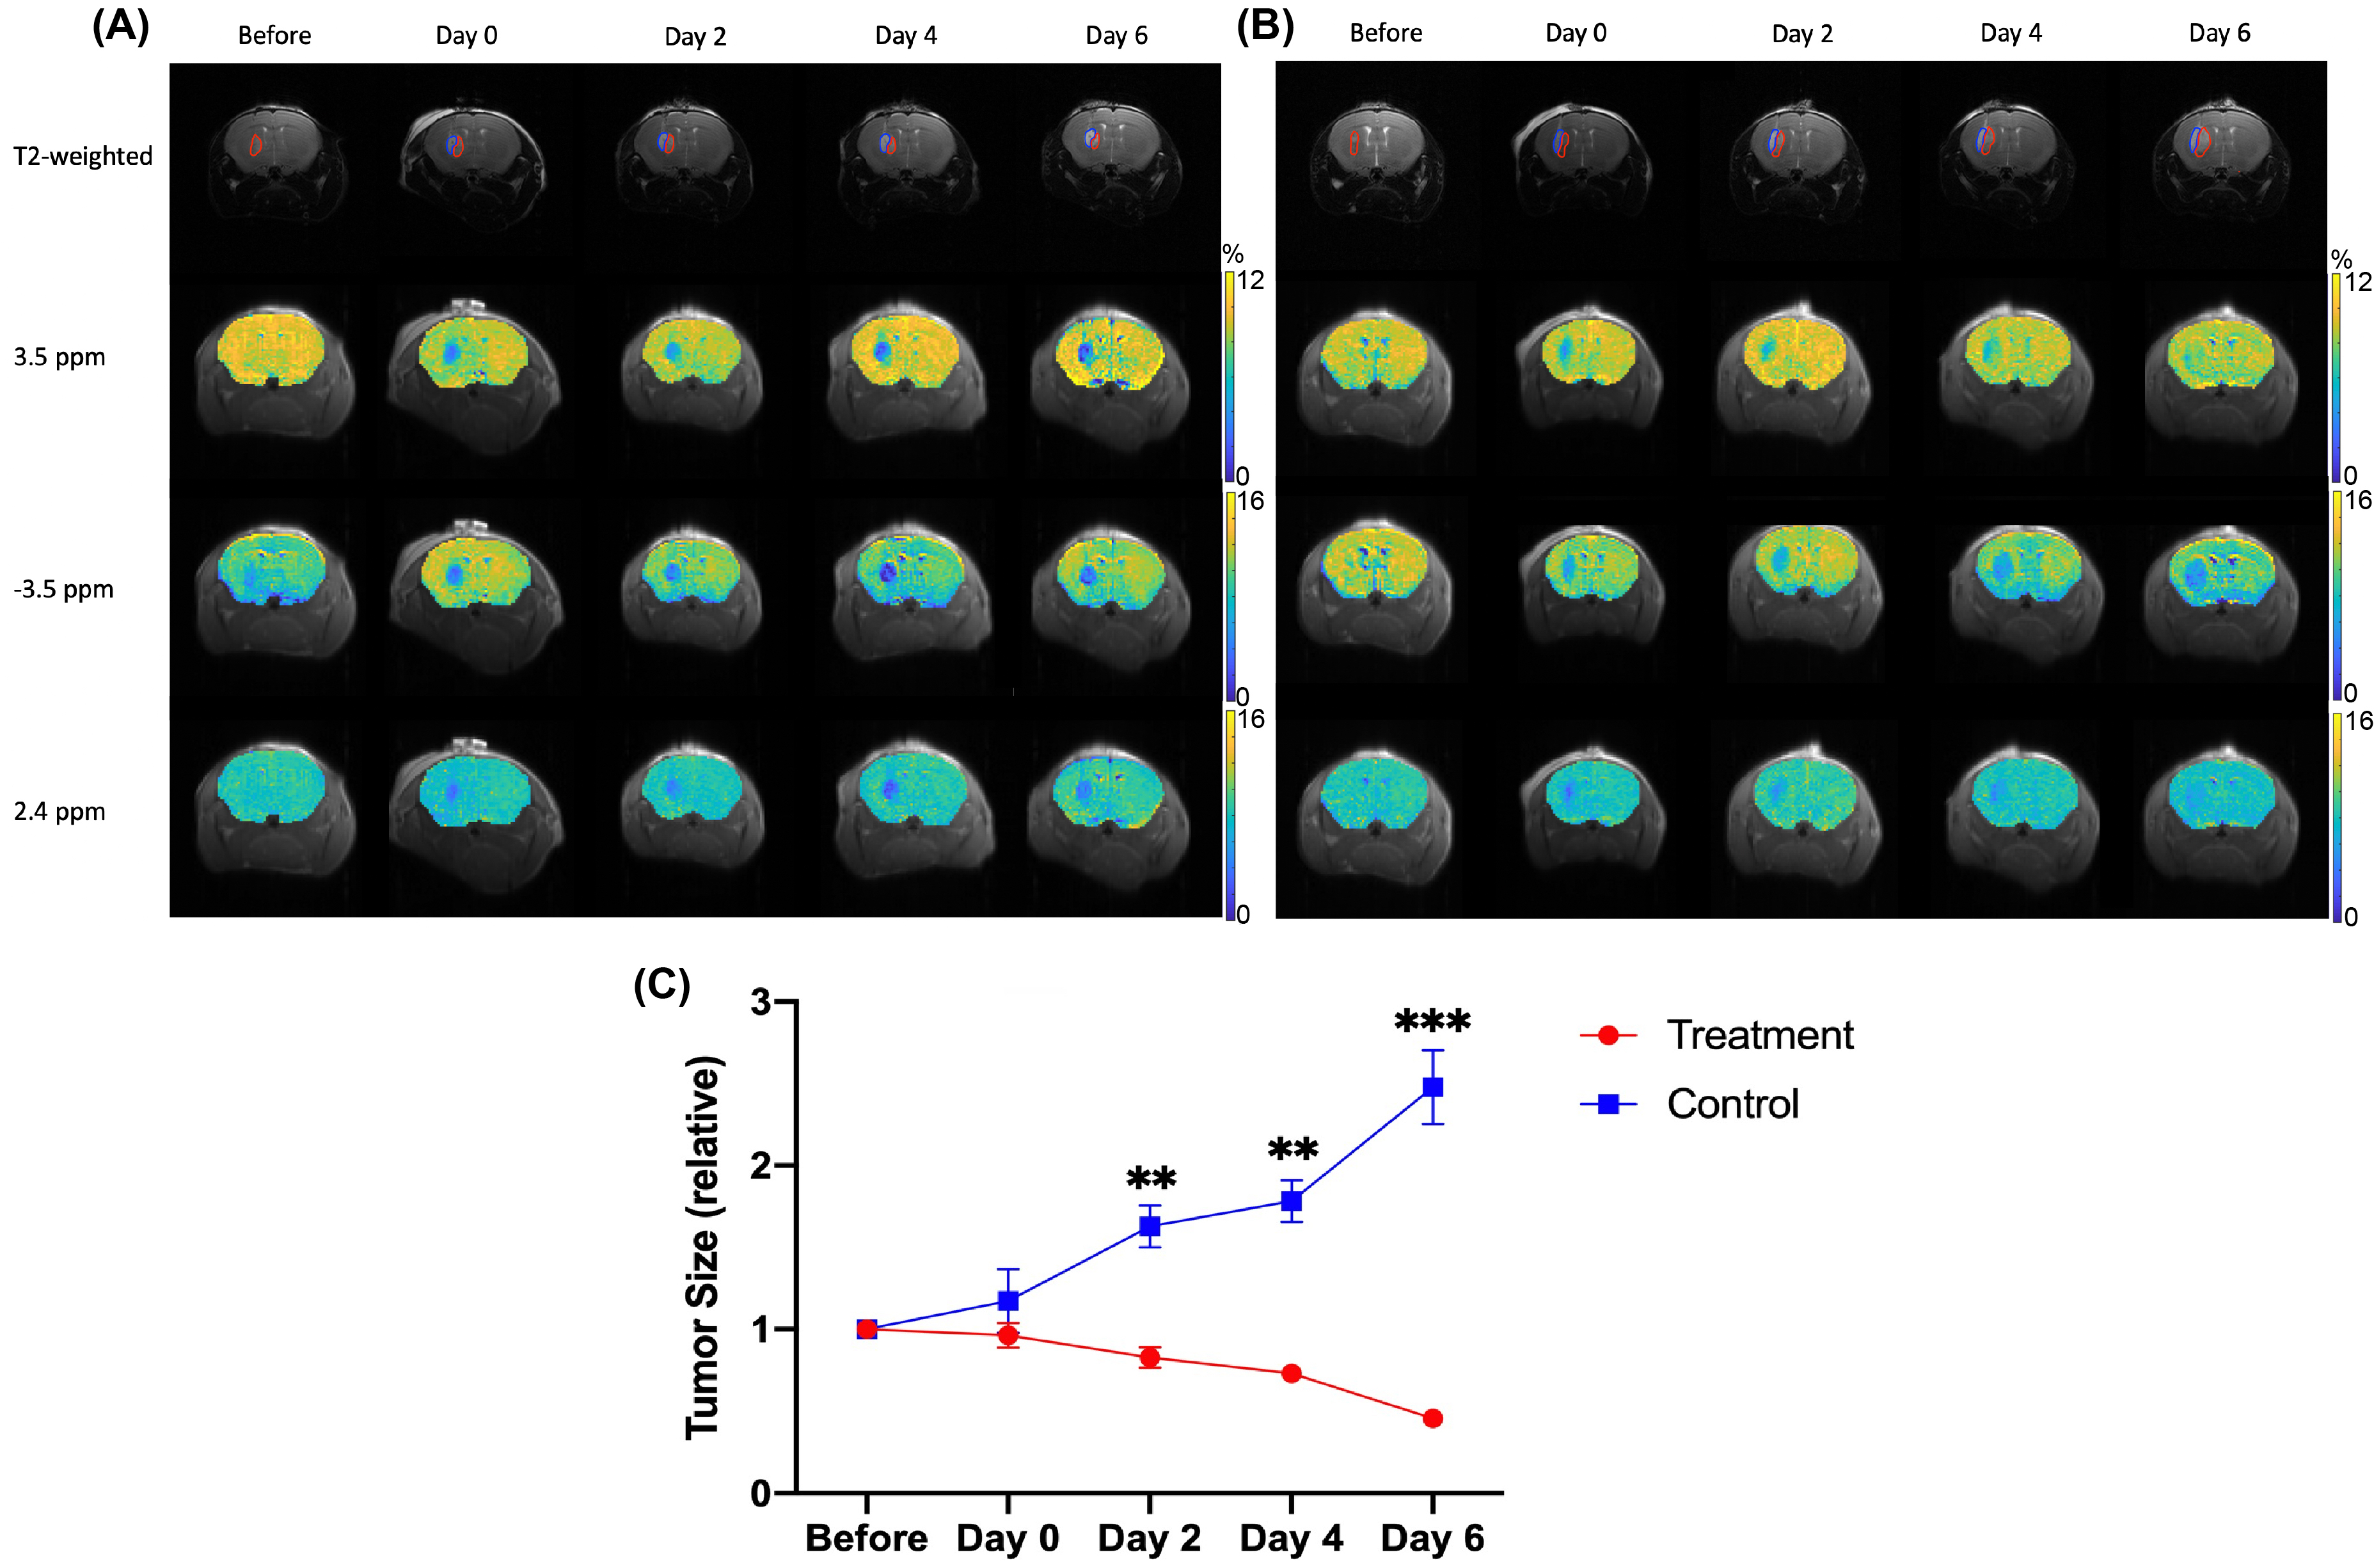
Figure 1. Representative T2-weighted and CEST maps of treatment group (A) mouse brains and control group (B) at different time points (From left to right: Before, Day 0, Day 2, Day 4 and Day 6). From top to bottom: T2-weighted images, CEST maps at 3.5 ppm, -3.5 ppm and 2.4 ppm. ROI in red and blue color indicate tumor and hydrogel, respectively.
In (C), Changes of tumor size at different time points after data normalization are shown. Comparison of treatment group and control group. (Data were presented as mean ± SEM. n=3, **P<0.01, ***P<0.001, multiple t-tests)
In (C), Changes of tumor size at different time points after data normalization are shown. Comparison of treatment group and control group. (Data were presented as mean ± SEM. n=3, **P<0.01, ***P<0.001, multiple t-tests)
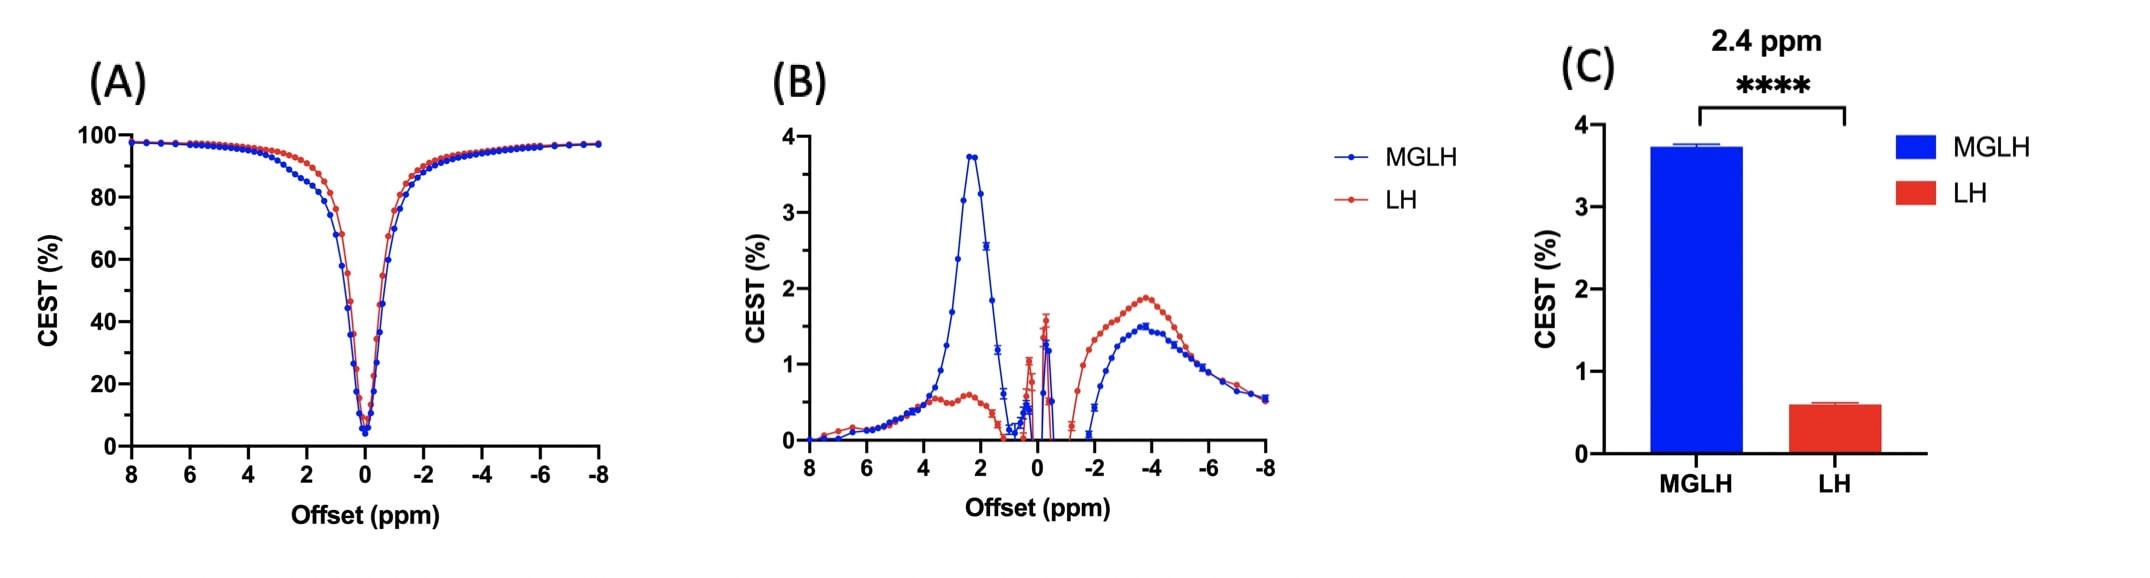
Figure 2. CEST contrast of MGLH and LH (n=5). Z spectra (A) and corresponding CEST percentage (B). The CEST contrast at 2.4 ppm (C). (Data were presented as mean ± SEM. n=5, ****P<0.0001, t-test)
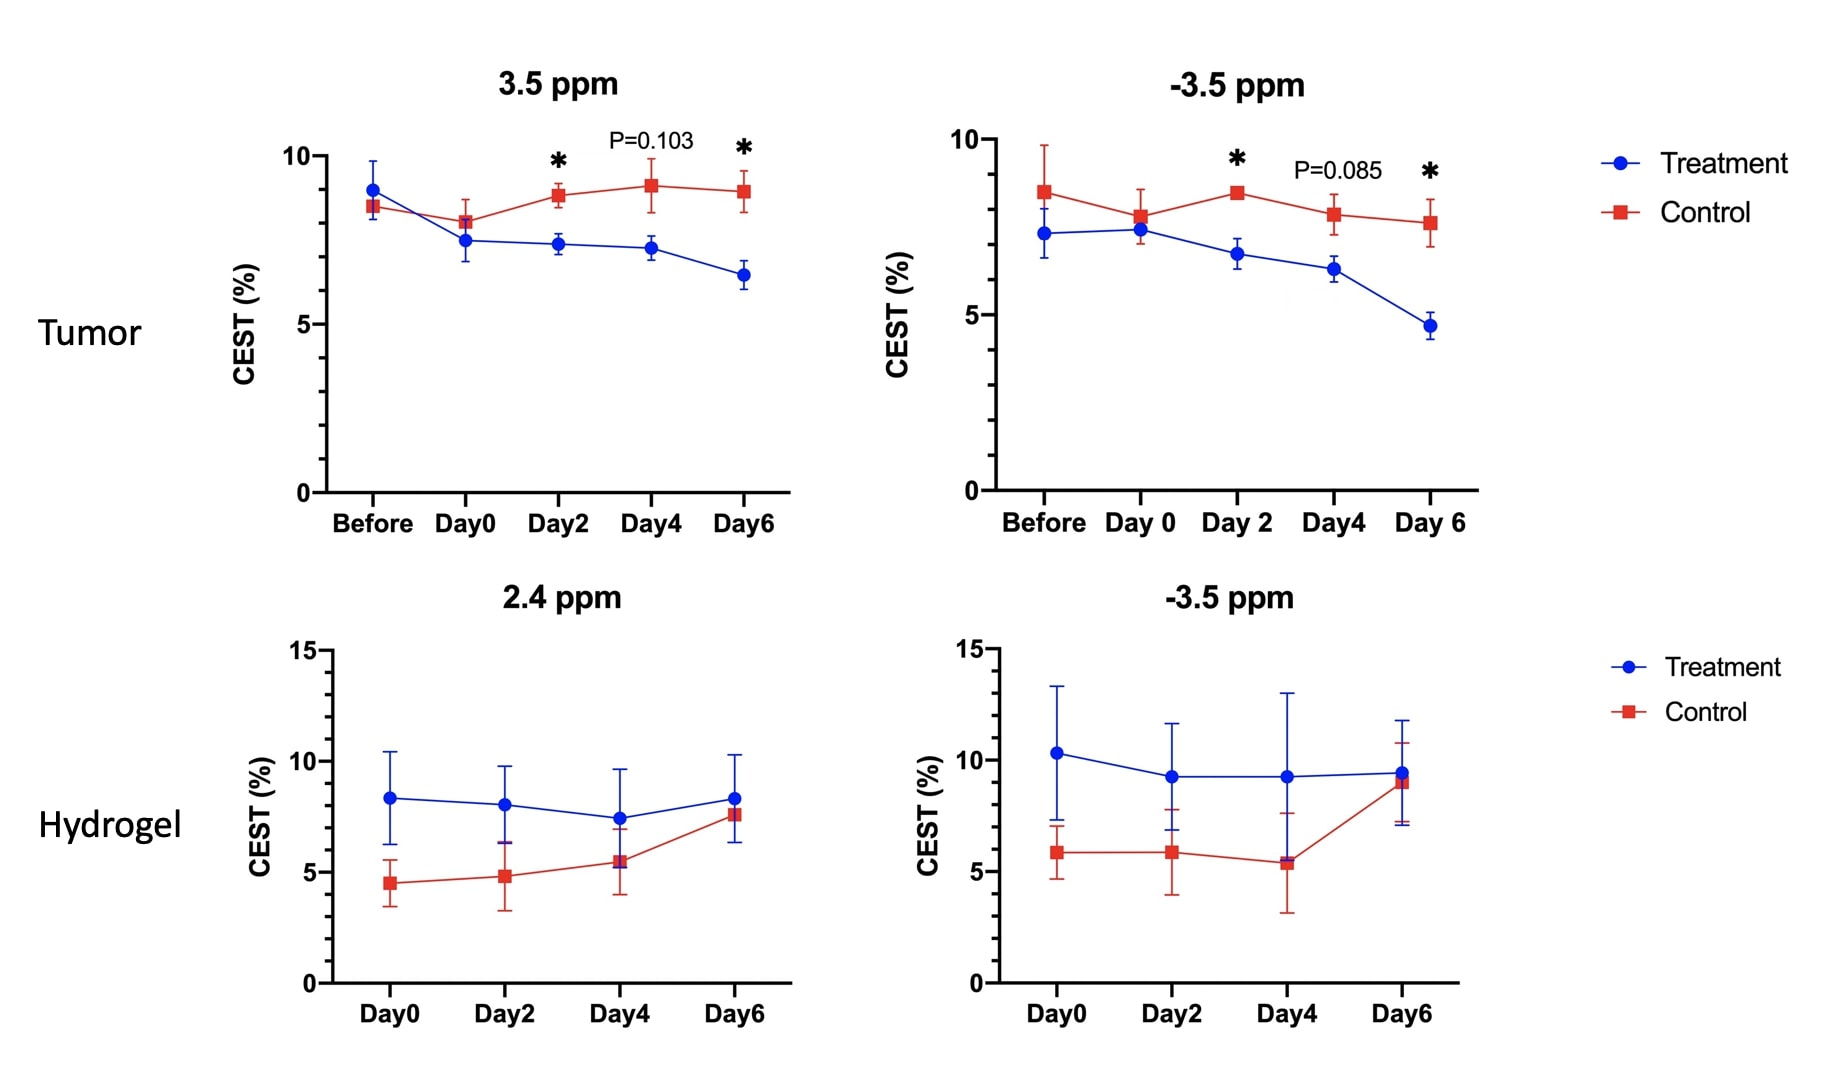
Figure 3. CEST signals between treatment group and control group, with tumor and hydrogel ROIs. 3.5 ppm shown in (A). -3.5 ppm shown in (B) and (D). 2.4 ppm shown in (C). (Data were presented as mean ± SEM. n=3, *P<0.05, multiple t-tests)
DOI: https://doi.org/10.58530/2022/4286