4285
Evaluation of brain tumor and surrounding tissue activity using multi-pool CEST imaging on 3 Tesla scanner
Yuki Kanazawa1, Masafum Harada1, Mitsuharu Miyoshi2, and Yuki Matsumoto1
1Tokushima University, Tokushima, Japan, 2Global MR Applications and Workow, GE Healthcare Japan, Hino, Japan
1Tokushima University, Tokushima, Japan, 2Global MR Applications and Workow, GE Healthcare Japan, Hino, Japan
Synopsis
We evaluated amide- and amine-CEST signal of brain tumors on a 3 Tesla MR scanner with conventional Z-spectrum and MTRasym analysis. Subjects were eight patients with brain tumor. There were significant differences between mean MTRasym values at 0.2 and 0.35 ppm offset frequencies (P < 0.05). Our findings was able to evaluate brain tumor characteristics with multi-pool analysis on the positive side of offset frequency on a 3 Tesla MRI scanner.
Introduction
Chemical exchange–dependent saturation transfer (CEST) imaging has been reported to evaluate the growth of brain tumors. Amide proton transfer (APT) imaging, which is targeted in mobile proteins and peptides in tissue, has been used to detect tumors, evaluate the effect of tumor treatment after radiotherapy1, chemotherapy2, and detect acidosis with decreasing pH3. On the other hand, several post-processing methods of CEST imaging, such as water saturation shift referencing (WASSR), lead to observing another offset frequency except for amide 3.5 ppm. We have recently demonstrated that CEST imaging using a multi-pool model [bulk water, magnetization transfer (MT), APT, and nuclear Overhauser effect (NOE)] derived from the Bloch equation4. Then, we found there was a need to evaluate not only APT but also the NOE signal of brain tumors. Moreover, we remarked the observation of a high signal at offset frequency 2.0 ppm MTR asymmetry (MTRasym) analysis for several cases of brain tumor. The purpose of our study was to evaluate the amine-CEST signal of brain tumors on a 3 Tesla MR scanner with conventional Z-spectrum and MTRasym analysis.Materials & Methods
On a 3.0 T MR system (Discovery 750, GE Healthcare), CEST imaging was performed using single-shot fast spin-echo (SSFSE) sequence with phase cycle radio frequency (RF) preparation (mean B1, 0.5 and 1.0 μT; then, 0.5 µT B1 was used for B0 correction; total RF irradiation time, 1.5 sec). CEST images were acquired with an offset frequency equivalent to ±7 ppm per 32 steps. The other imaging parameters were echo time, 30 ms; repetition time, 3523 ms; bandwidth, 3906 Hz/pixel; field of view, 22 cm; matrix size, 128 × 128; slice thickness, 5 mm. Acquired imaging data were applied to B0 correction with WASSR for each pixel. Subjects were eight patients with brain tumor. We set the region-of-interest (ROI) analysis in CEST images with B0 corrected images. We evaluated Z-spectrum and MTRasym of each subject. MTRasym was calculated as follows:$$MTR_{asym} = MTR(+∆ω) - MTR(-∆ω) = (S_{sat} (-∆ω) - S_{sat} (+∆ω)) /S_{0},$$
where Ssat and S0 are the imaging signals measured with MT pulses at each frequency and at -10ppm frequency where no MT effect was observed, and ∆ω is frequency offset. Wilcoxon matched-pairs signed-rank tests were used to determine the significance of each offset frequency. Then, a P value of <0.05 was considered statistically significant.
Results & Discussions
Table 1 shows the histological diagnoses and analysis of brain tumors and MTRasym values at 0.2 and 0.35 ppm offset frequencies for each patient. Figure 1 shows violin plots for each MTRasym values at 0.2 and 0.35 ppm offset frequency of brain tumors. There were significant differences between mean MTRasym values at 0.2 and 0.35 ppm offset frequencies (P < 0.05). Figure 2 shows bar graphs of mean MTRasym values at 0.2 and 0.35 ppm offset frequencies for each tumor diagnosis. Figures 3 and 4 show T2 weighted image, CEST images, Z-spectrum, and MTRasym curve of each representative subject with brain tumor. MTRasym images at 2.0 ppm had a higher signal in the area surrounding tumors than that of 3.5 ppm (See Fig. 2 and 3). In a previous study using glutamate CEST, there were reported that glutamate CEST contrast correlates with MR spectroscopy glutamate in peritumoral regions [5]. When focusing on the area surrounding tumors, our findings indicate that multi-pool analysis on the positive side of offset frequency on a 3 Tesla MRI scanner has diagnostic potential to evaluate brain tumor activity; however, main metabolites around 2 ppm including amine (-NH2) must be determined using MR spectroscopy.Conclusion
Multi-pool CEST analysis of amine and amide may enable us to show a detailed characteristic change of brain tumors and the surrounding tissue even on a 3 Tesla MRI scanner.Acknowledgements
No acknowledgement found.References
- Hong X, Liu L, Wang M, et al. Quantitative multiparametric MRI assessment of glioma response to radiotherapy in a rat model. Neuro Oncol. 2014;16:856-867.
- Meissner JE, Korzowski A, Regnery S, et al. Early response assessment of glioma patients to definitive chemoradiotherapy using chemical exchange saturation transfer imaging at 7 T. J Magn Reson Imaging. 2019;50(4):1268-1277.
- Sun PZ. Demonstration of magnetization transfer and relaxation normalized pH-specific pulse-amide proton transfer imaging in an animal model of acute stroke. Magn Reson Med. 2020;84(3):1526-1533.
- Kanazawa Y, Harada M, Miyoshi M, et al. Characterization of Brain Tumors using Amide Proton and Nuclear Overhauser Effect at 3 Tesla MR Scanner. Proc. ISMRM 2020;28:1697.
- Neal A, Moffat BA, Stein JM, et al. Glutamate weighted imaging contrast in gliomas with 7 Tesla magnetic resonance imaging. Neuroimage Clin. 2019;22:101694.
Figures
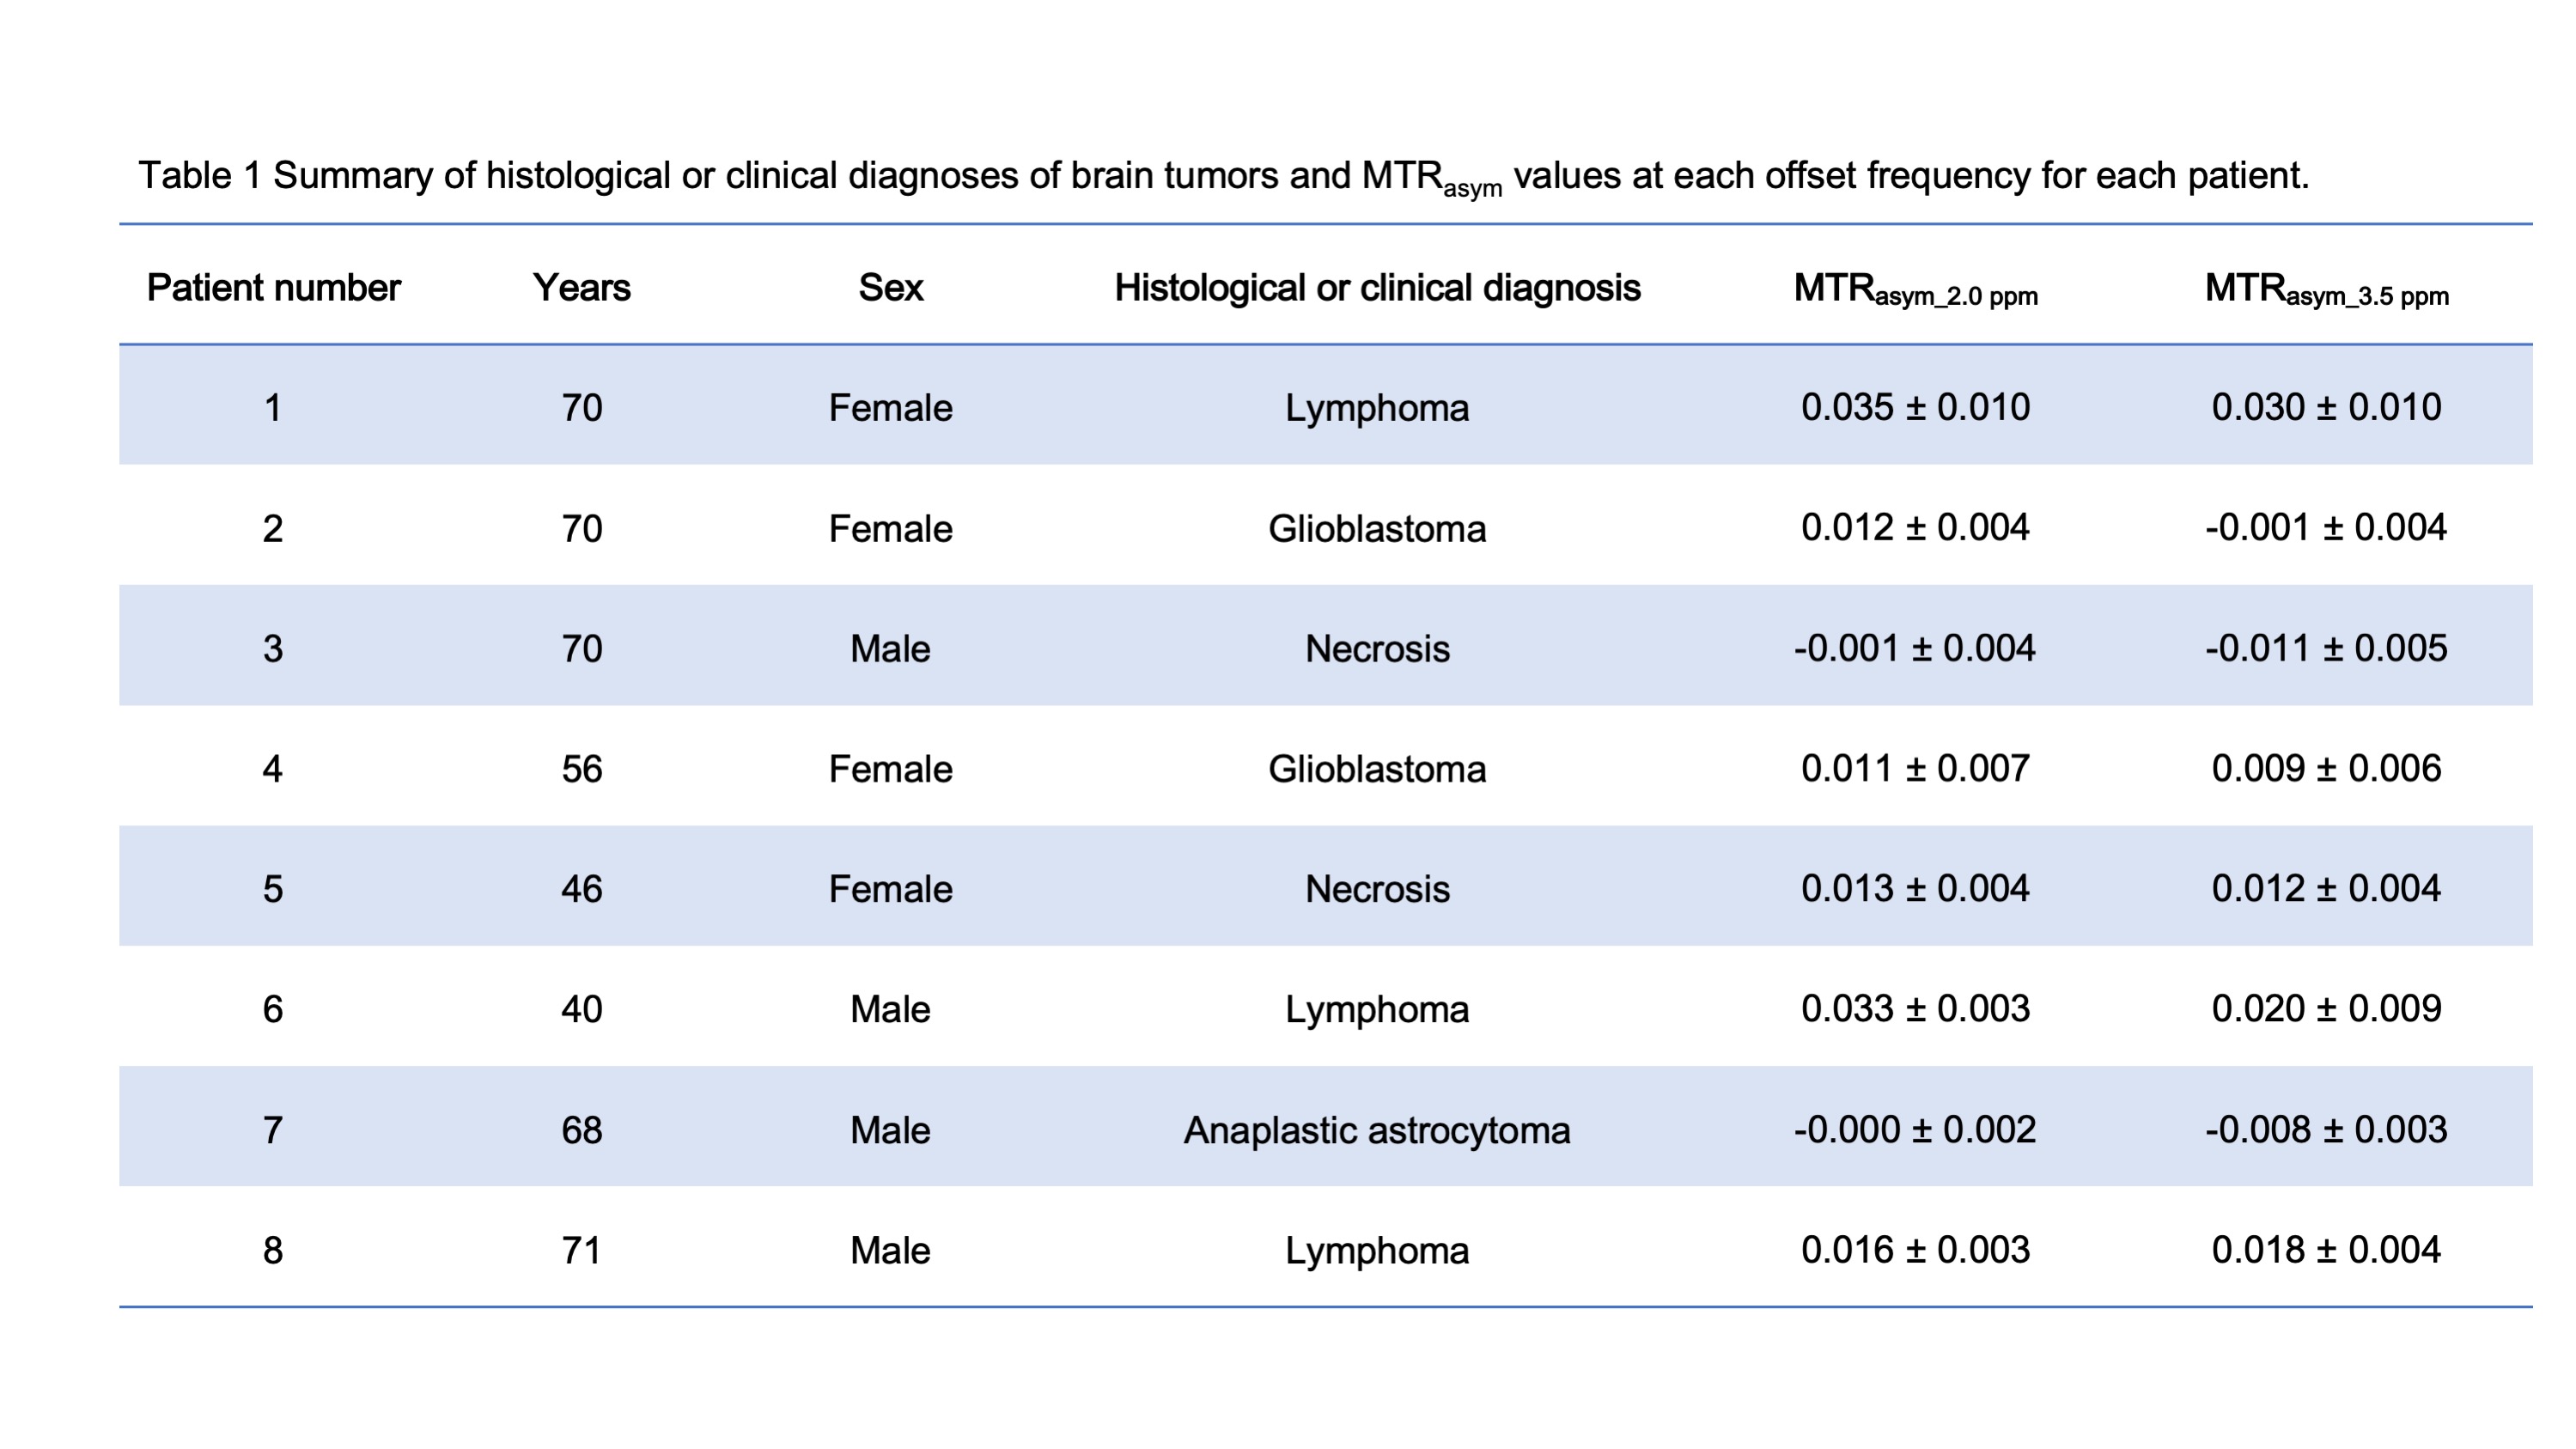
Table 1 Summary of histological or clinical diagnoses of brain tumors and MTRasym values at each offset frequency for each patient.
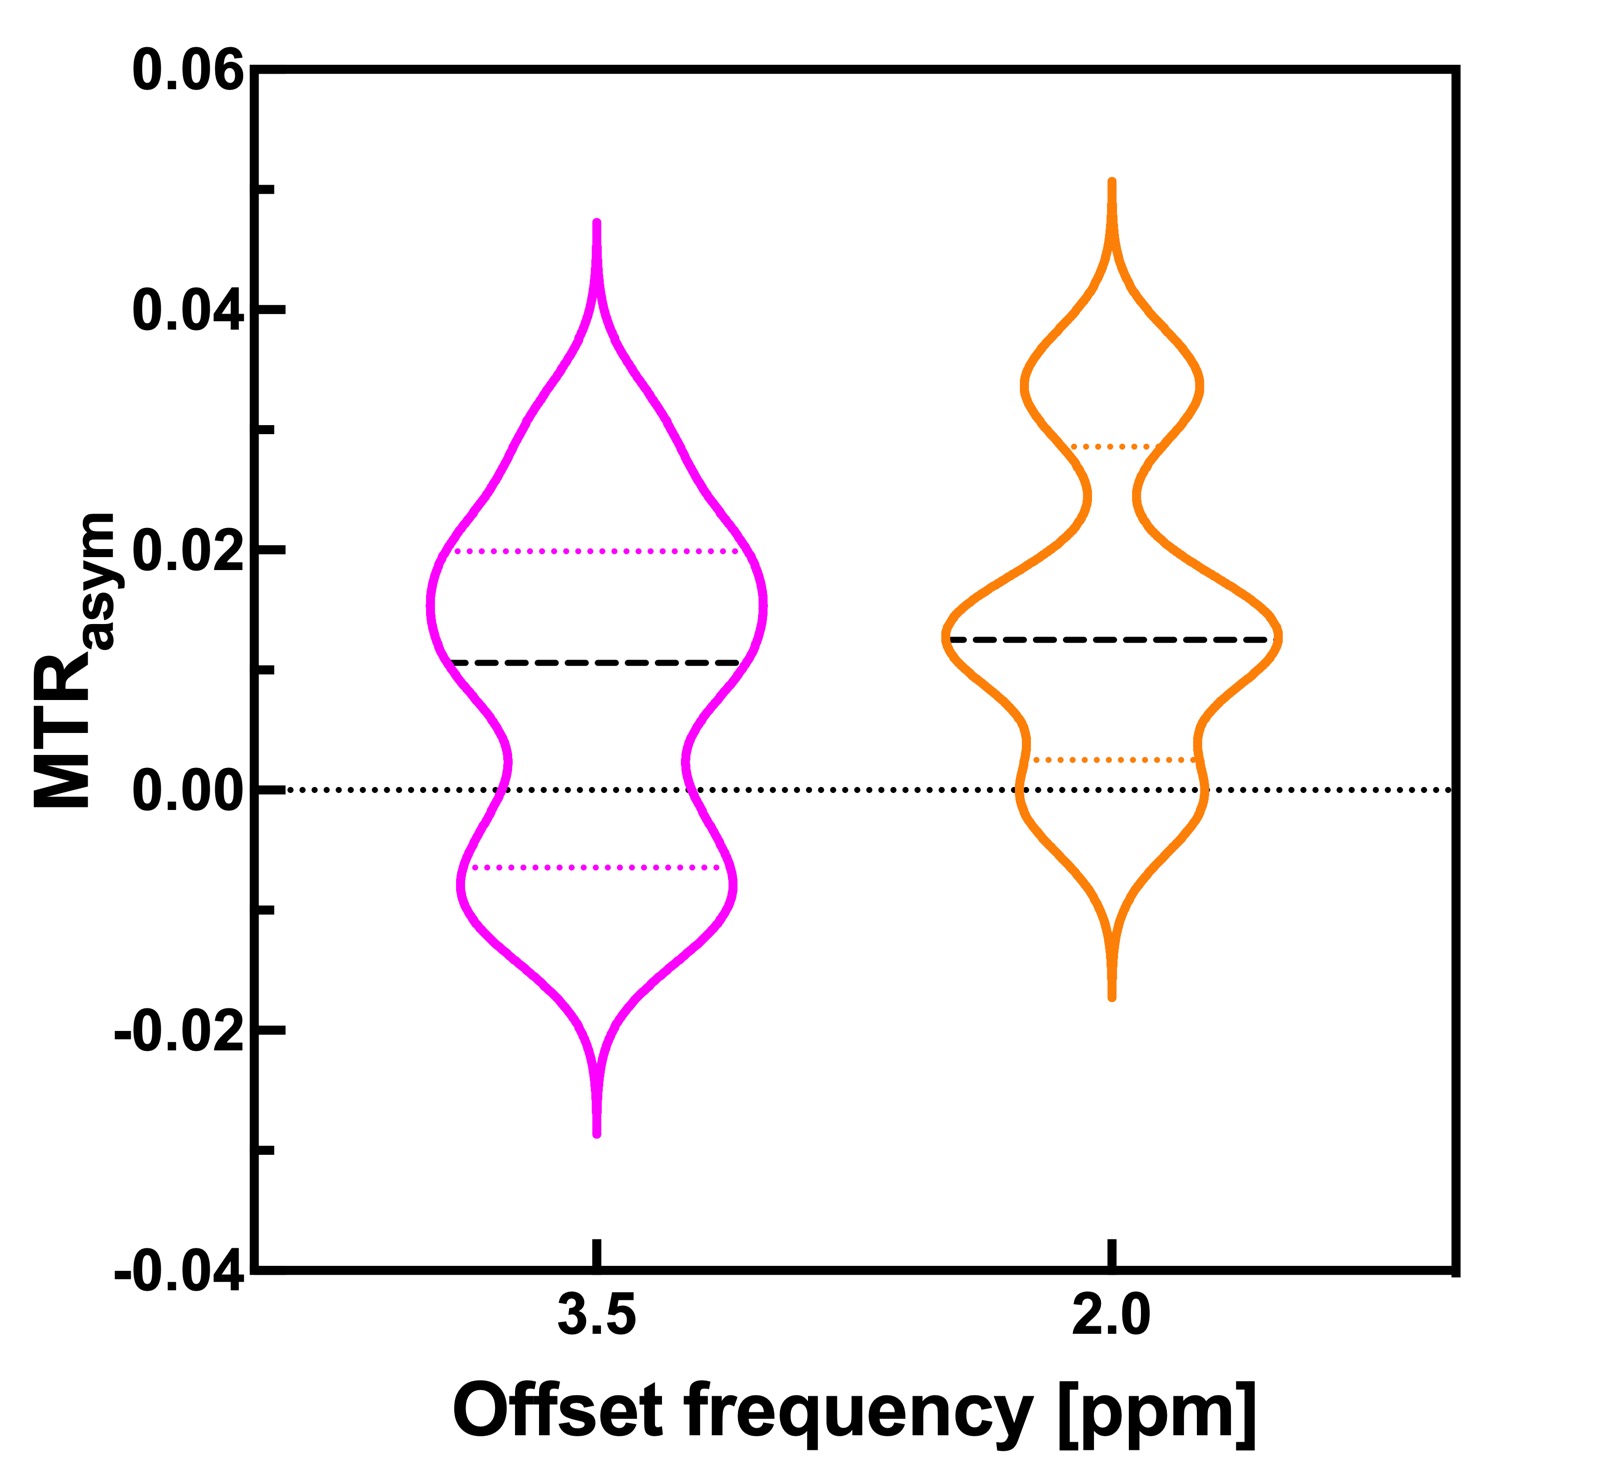
Figure 1 Violin plots of measured values of each MTRasym value in brain tumor regions.
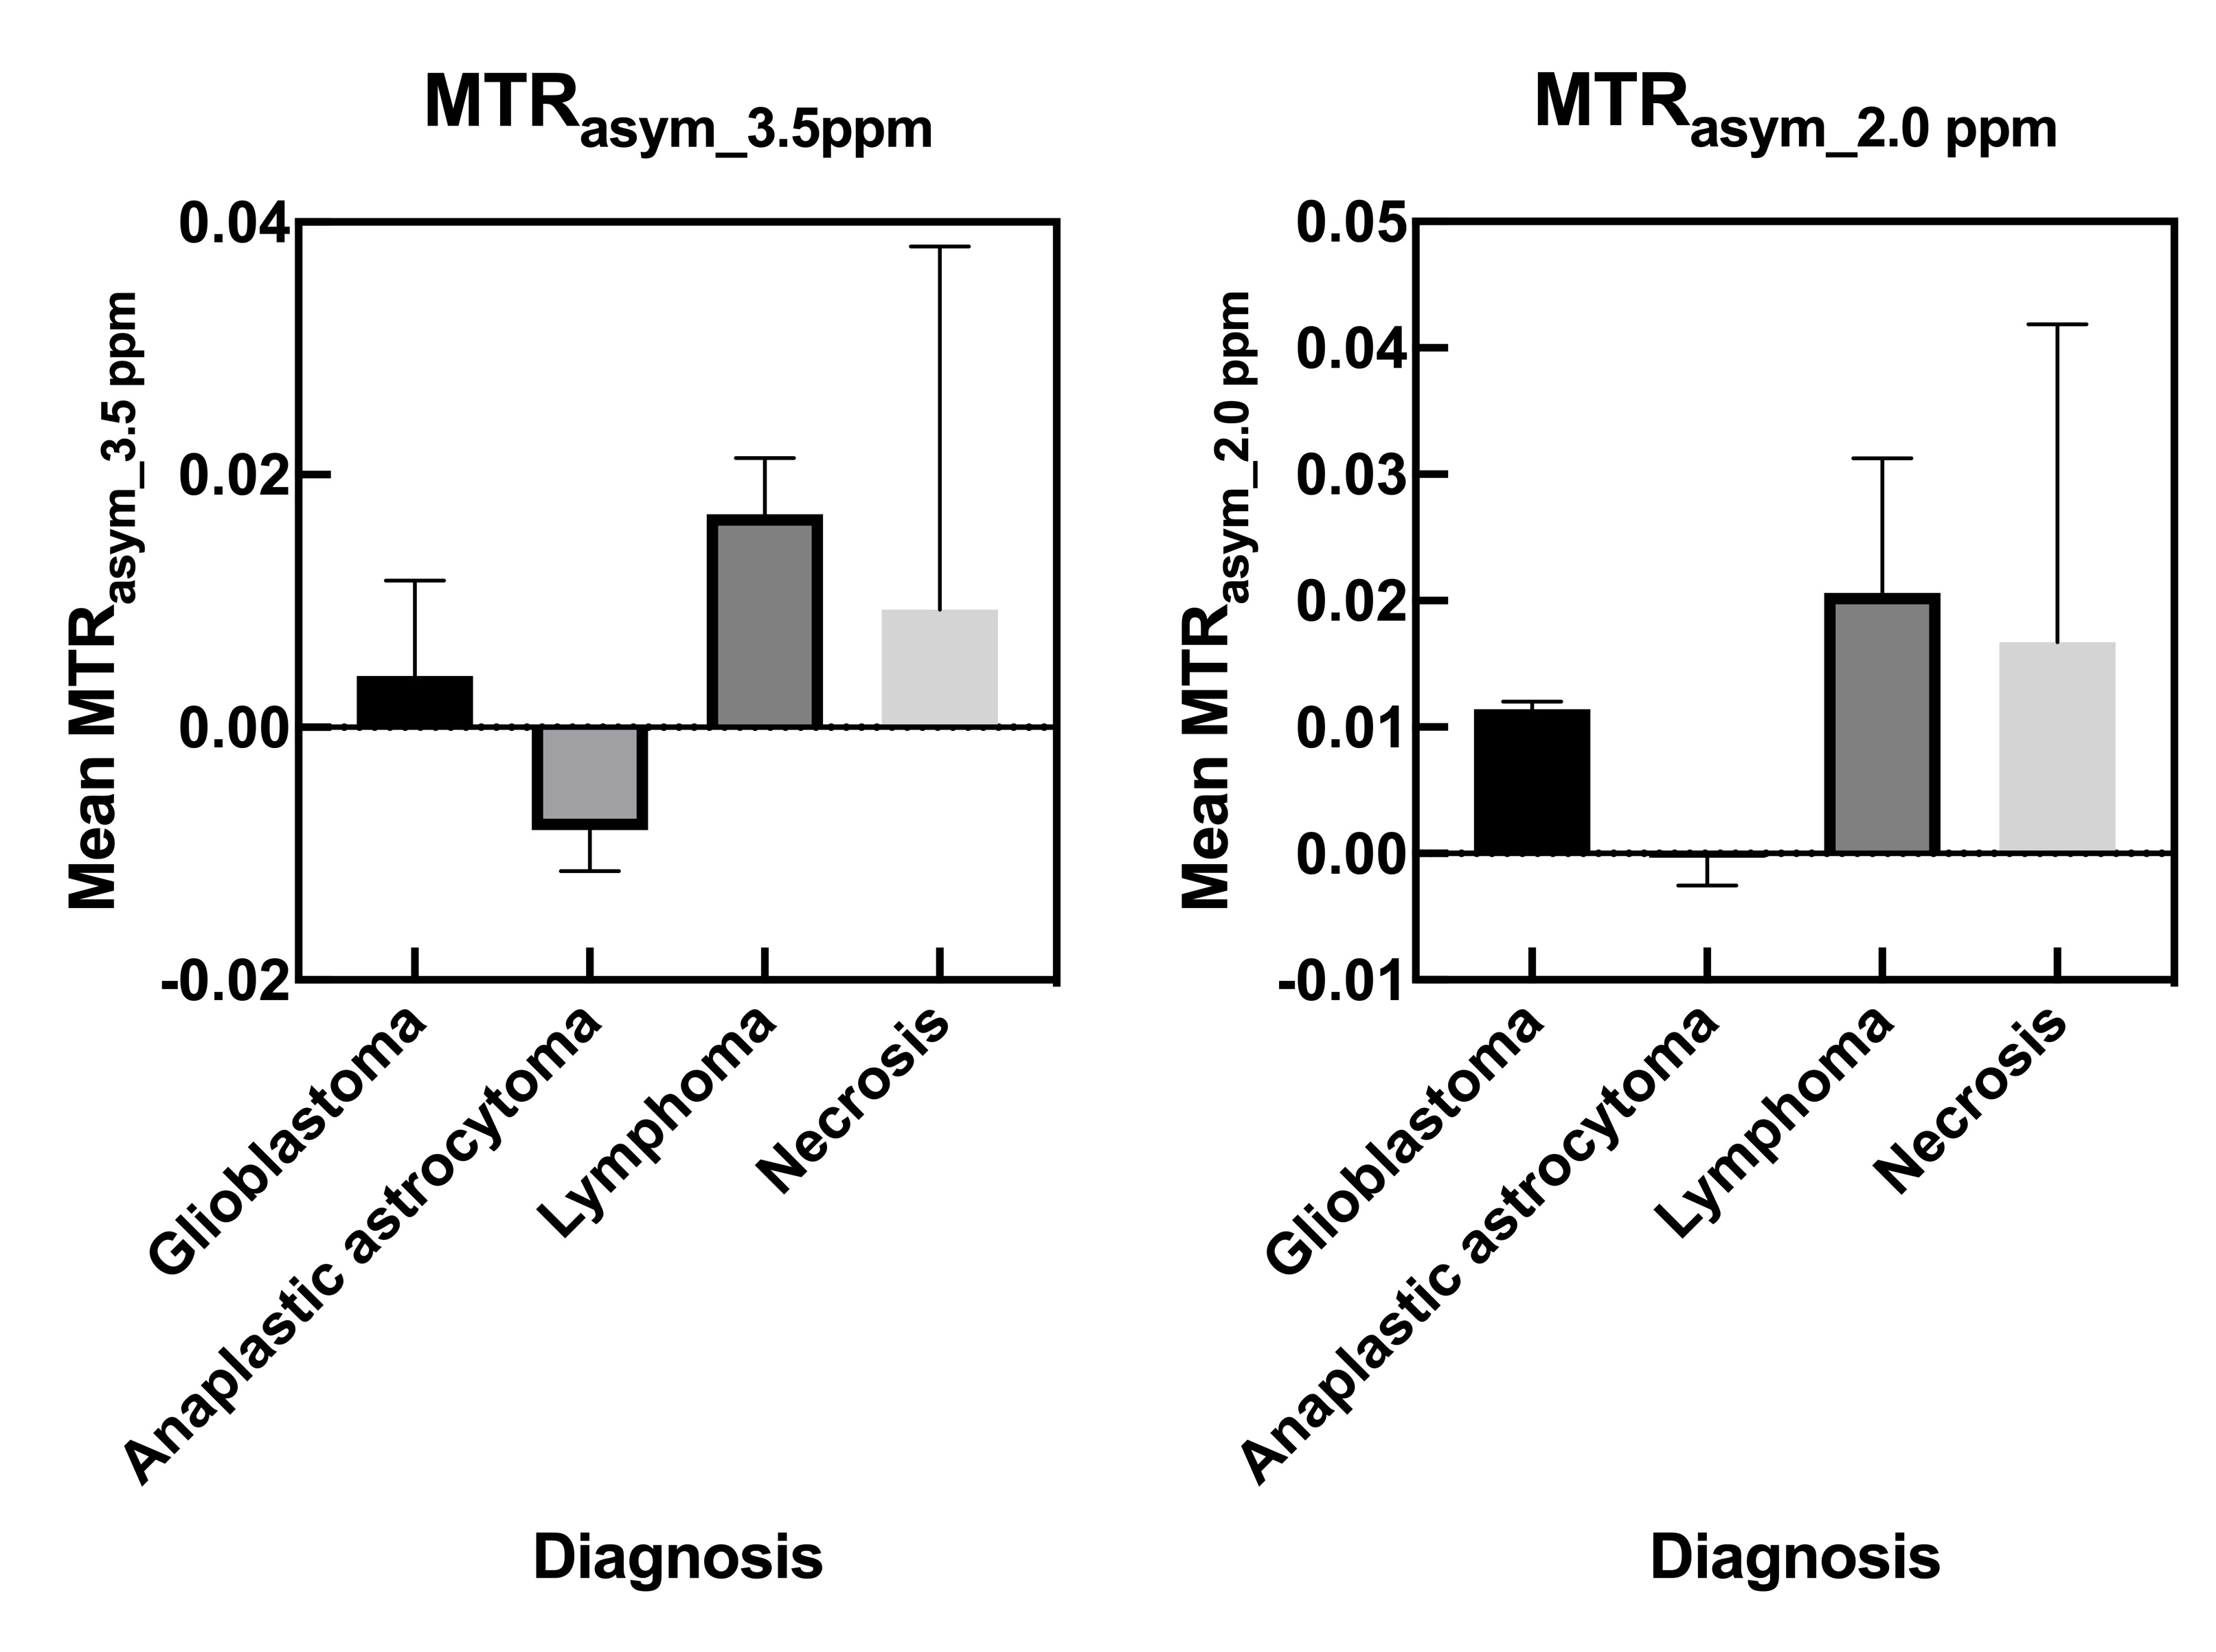
Figure 2 Bar graphs of each mean MTRasym value for each diagnosis.
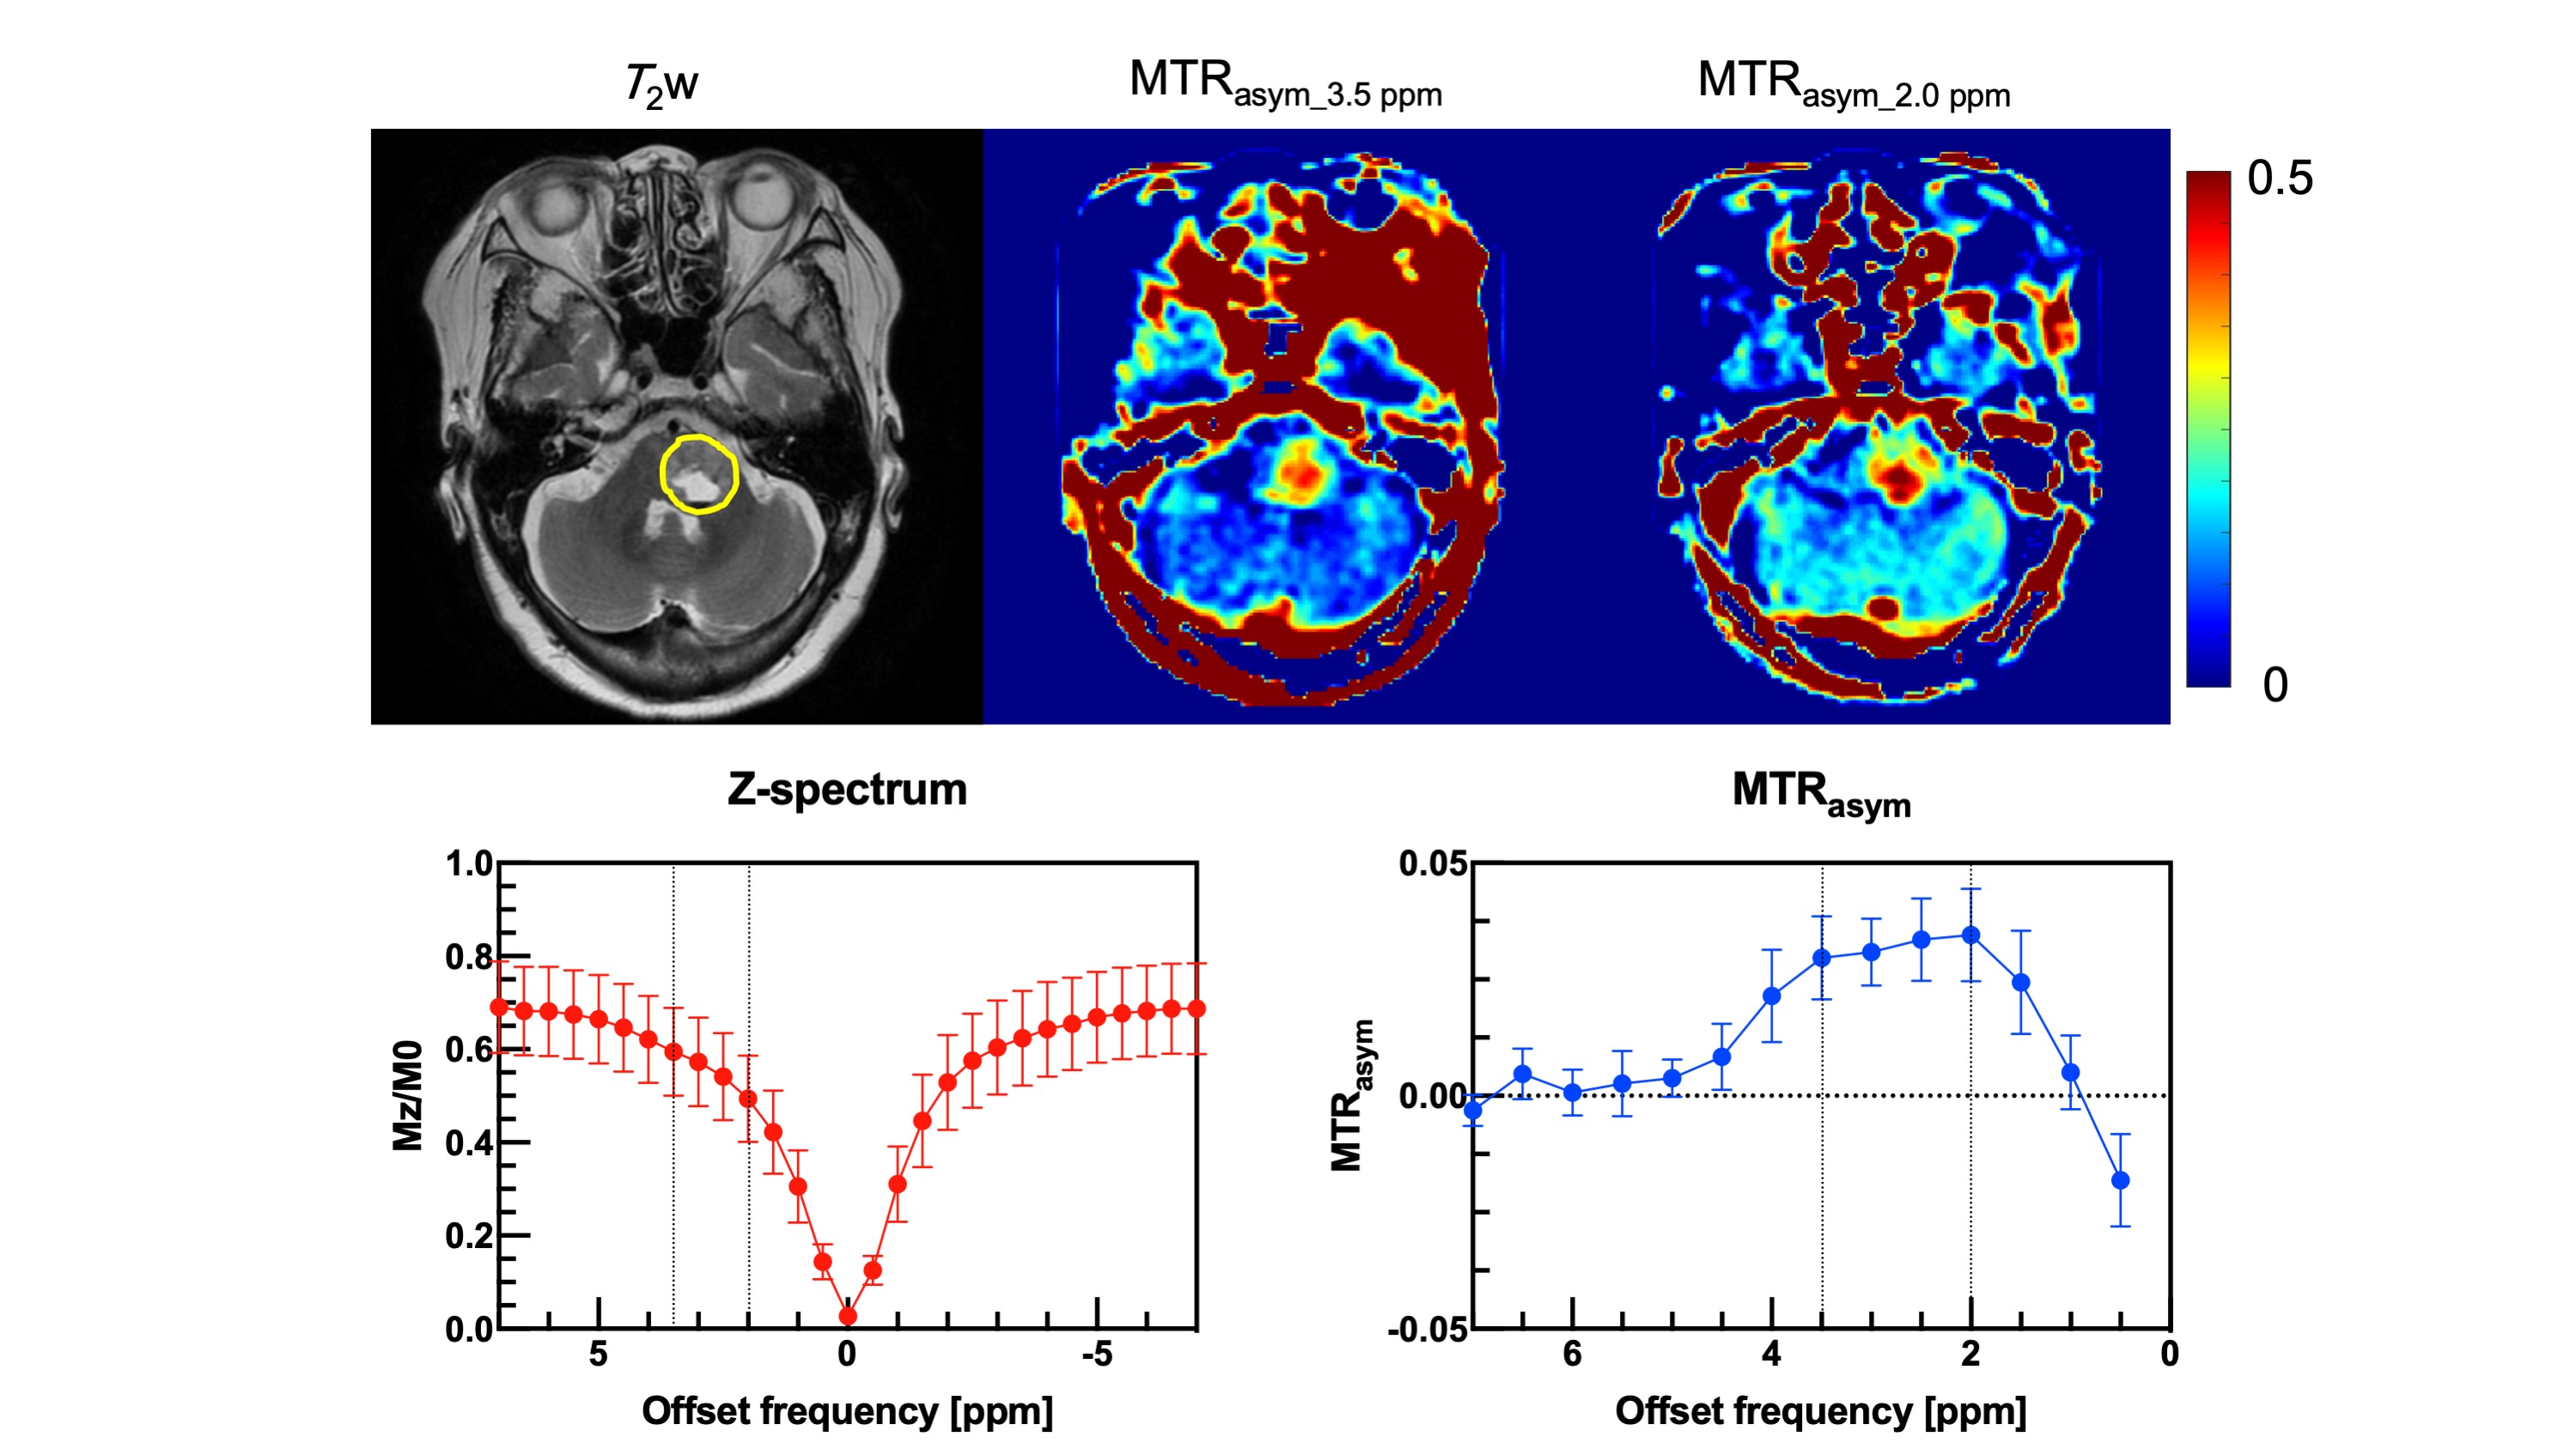
Figure 3 A 70-year-old female with radiation necrosis (patient No. 1). A yellow ellipse on the T2 weighted image indicates ROI.
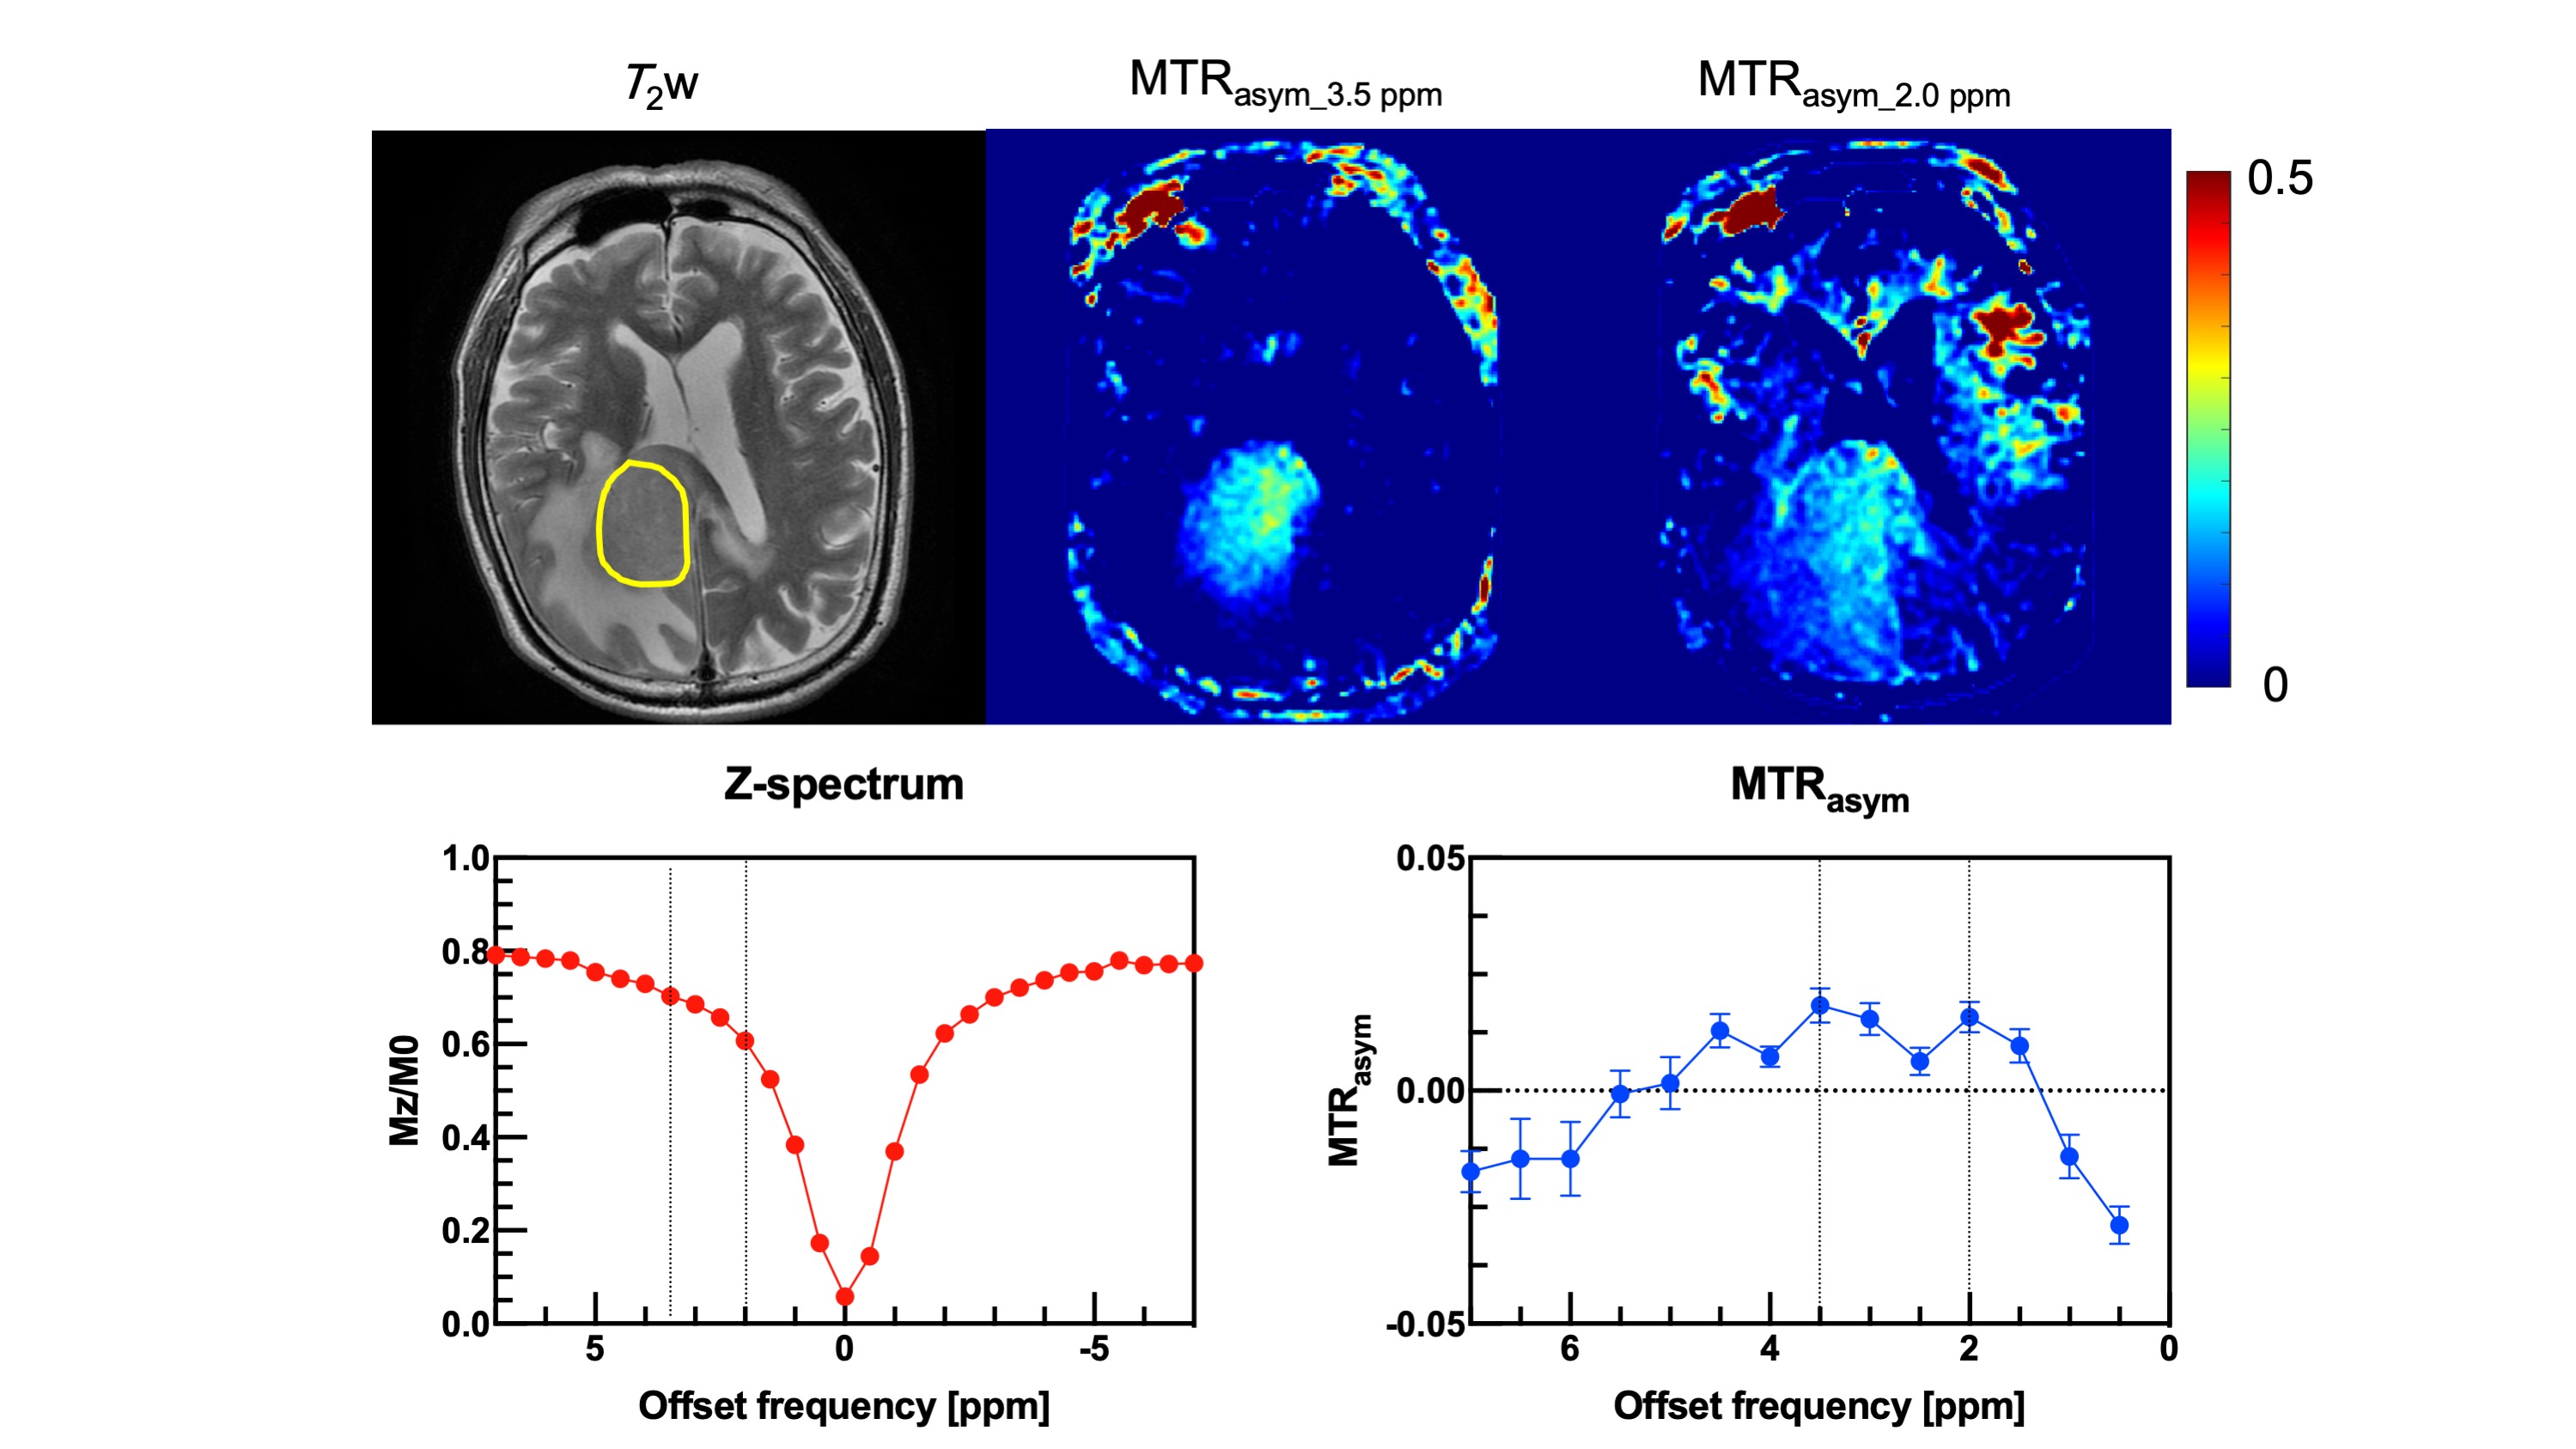
Figure 4 A 71-year-old male with lymphoma (patient No. 8). A yellow ellipse on the T2 weighted image indicates ROI.
DOI: https://doi.org/10.58530/2022/4285