4284
Diffusion-kurtosis based texture features for differential diagnosis between prostate cancer and benign prostatic hyperplasia1The First Affiliated Hospital of Dalian Medical University, Dalian, China, 2Philips Healthcare, Beijing, China
Synopsis
The differential diagnosis between prostate cancer (PCa) and benign prostatic hyperplasia (BPH) remains challenging due to their overlapping atypical clinical symptoms and MRI features. This study aims to explore the performance of mean kurtosis (MK) based texture features in differentiation between PCa and BPH. Results show that the MK texture features can help distinguish PCa and BPH. The 90Percentile MK value show the best diagnostic performance (AUC: 0.93; sensitivity: 88%; specificity: 100%).
Introduction
Prostate cancer (PCa) is the second most common cancer and the sixth leading cause of death in men [1]. Normally, prostate cancer is indicated by the laboratory index of Prostate-Specific Antigen (PSA). However, the PSA has a gray area of 4-10 ng/ml, which is overlapped by PCa and benign prostatic hyperplasia (BPH), lead to the false positive and false negative results [2]. Diagnosis of PCa usually depends on the pathology, but it can be difficult to obtained the accurate pathological results, and some small lesions may be missed[3].Meanwhile,PCa and BPH overlaps in MR features in conventional MR examinations [4]. The diffusional kurtosis imaging (DKI)is a new type of MR technique based on the non-Gaussian diffusion model for water molecules. However, the information provided by mean kurtosis (MK) measured by DKI is limited and cannot explain the potential spatial distribution. Texture analysis is an emerging image analysis method, which has been widely used in the diagnosis and evaluation of malignant tumors [5-6]. Texture analysis based on imaging parameters makes full use of image features to provide richer information. This study aims to explore the performance of MK based texture features in differentiation between PCa and BPH.Methods
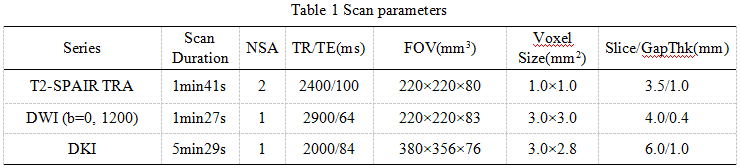
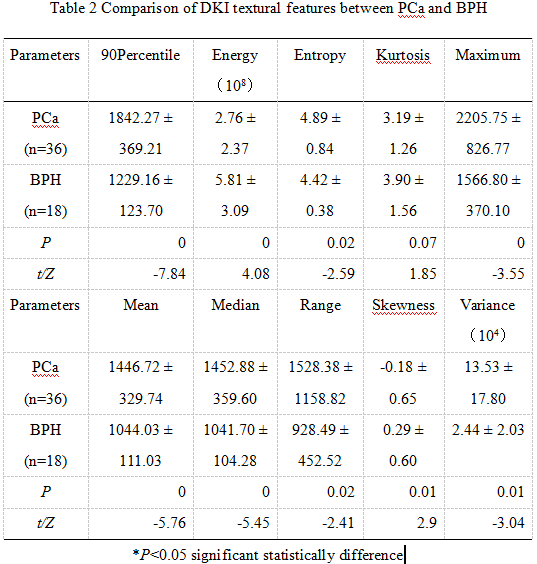
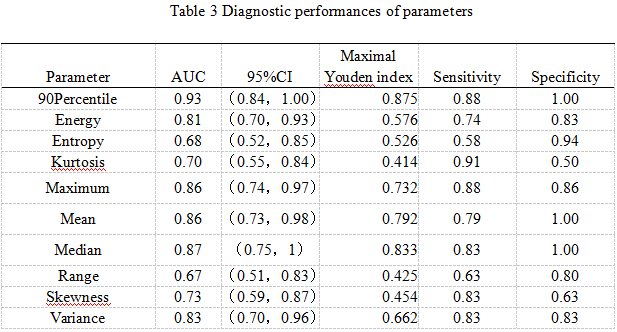
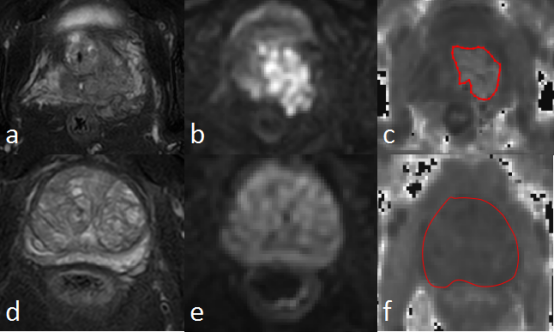
59 patients with prostate cancer or benign prostatic hyperplasia were collected in our hospital, and 24 cases of PCa (70.52±7.03 years) and 35 cases of BPH (66.15±6.42 years) were confirmed by pathology. All patients underwent pelvic MR scans before operation on a 3.0 T scanner (Ingenia CX, Philips Healthcare). Sequences included T1WI, T2WI, DWI and DKI were scanned with detail parameters listed in Table 1. The DKI data were transferred to the AW 4.6 workstation (GE Healthcare, Milwaukee, WI, USA) for post processing and calculation of MK maps. The ITK software was used to delineate ROIs of lesions. For PCa, ROIs were delineated along the edge of tumor with reference to T2WI and DWI images; for BPH, ROIs were delineated along the edge of the central gland of the prostate with reference to T2WI images (Figure). The AK software was used to extract quantitative values within the ROIs of lesions, and to calculate texture parameters of MK, including 10 percentile, 90 percentile, energy, entropy, kurtosis, maximum, mean, median, minimum, range, skewness, uniformity and variance. All statistical analyses were performed using SPSS 25.0 software. The normal distribution was tested using the Shapiro-Wilks test. The independent-sample test was used to compare the differences in texture values between PCa and BPH (Table 2). Receiver operating curve (ROC) analysis was used to evaluate diagnostic performance (Table 3).Results
Results shown that the texture parameters including 90 percentile, energy, entropy, kurtosis, maximum, mean, median, range, skewness and variance have significant differences between PCa and BPH groups, with AUC values of 0.93, 0.81, 0.68, 0.70, 0.86, 0.86, 0.87, 0.67, 0.73 and 0.83, respectively. Among them, the 90Percentile has the highest diagnostic efficiency (AUC: 0.93), and the diagnostic sensitivity and specificity of the median MK value were 88% and 100% respectively.Discussion
The 90 percentile MK value shown the highest diagnostic efficiency (AUC: 0.93) (table 3). The 90 percentile is a metric used in statistics, and it refers to the value below which 90% of the observations fall. Energy reflects the uniformity of signal intensity level distribution. Because of the relatively complex internal structure of tumors, the energy of prostate cancer is relatively small, which is consistent with the results of this study. The average or median show the general condition of the lesions, and have a good reflection on the overall lesions. As shown in table 2, all the MK-based texture parameters except energy, energy and skewness were significantly higher in PCa than BPH. These texture parameters showed the efficiency for differential diagnosis between PCa and BPH.Conclusion
In summary, we propose a DKI-based texture strategy to identify PCa and BPH before surgery, and it may serve as a promising method for clinical diagnosis of prostate cancer.Acknowledgements
No
References
[1] Torre LA, Bray F, Siegel RL, et al. Global cancer statistics, 2012 [J]. CA: a cancer journal for clinicians, 2015, 65(2): 87-108.
[2] Stephan C, Lein M, Jung K, et al. The influence of prostate volume on the ratio of free to total prostate specific antigen in serum of patients with prostate carcinoma and benign prostate hyperplasia [J]. Cancer, 1997, 79: 104-9.
[3] Li C, Chen M, Wan B, et al. A comparative study of Gaussian and non-Gaussian diffusion models for differential diagnosis of prostate cancer with in-bore transrectal MR-guided biopsy as a pathologicalreference [J]. Acta Radiol, 2018, 59: 1395-1402.
[4] Chatterjee A, Thomas S, Oto A. Prostate MR: pitfalls and benign lesions [J]. Abdom Radiol (NY), 2019, undefined: undefined.
[5] Tamura C, Shinmoto H, Soga S, et al. Diffusion kurtosis imaging study of prostate cancer: preliminary findings [J]. Journal of magnetic resonance imaging, 2014, 40(3): 723-9.
[6] Van CS, Veraart J, Sijbers J, et al. Gliomas: diffusion kurtosis MR imaging in grading [J]. Radiology, 2012, 263(2): 492-501.
Figures