4282
Application of ultra-high b value diffusion weighted aquaporin imaging for discrimination of prostate cancer from benign prostatic hyperplasia1The First Affiliated Hospital of Dalian Medical University, Dalian, China, 2Philips Healthcare, Beijing, China
Synopsis
In this study, the ADC value (AQP-ADC) fitted by ultra-high b value diffusion weighted images (UHB-DWI) was used for discrimination between prostate cancer (PCa) from benign prostatic hyperplasia (BPH). The AQP-ADC value was observed to significantly higher in PCa than in BPH. And AQP-ADC may serve as a potential biomarker for differentiation between benign and malignant prostate lesions.
Introduction
Prostate cancer (PCa) is the second most common cancer and the sixth leading cause of death in men [1], which is extremely harmful to men’s health. Accurate and timely diagnosis of prostate cancer is particularly important for the treatment and prognosis of patients. It is also difficult for conventional MRI to distinguish prostate cancer from benign lesions of the prostate, especially from benign prostatic hyperplasia (BPH) [2]. Elevated prostate specific antigen (PSA) combined with prostate biopsy under the guidance of rectal ultrasound (TRUS) is the current standard method for the diagnosis of prostate cancer, but the risk of missed diagnosis is high, and the accuracy rate is only 40% [3]. MRI occupies an increasingly important position in the diagnosis of prostate cancer. Studies [4] have found that the ADC value fitted by ultra-high b value diffusion weighted images (UHB-DWI) can reflect the expression level of aquaporin (AQP) to a certain extent; and the fitted value is so called the AQP-ADC value and has been used to solve some clinical problems. Previous studies have involved the AQP-ADC value for diagnosis and prognosis analysis of glioma and rectal cancer [5,6], but rare related studies have been reported on prostate diseases. Moreover, the significant difference in expression of AQP has pathologically conformed between prostate cancer and prostate hyperplasia [7]. Therefore, in this study, we aimed to explore the value of AQP-ADC in distinguishing PCa from BPH.Methods
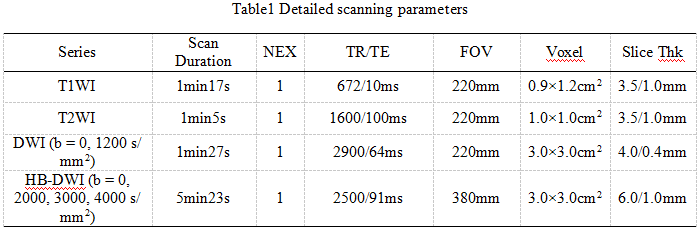
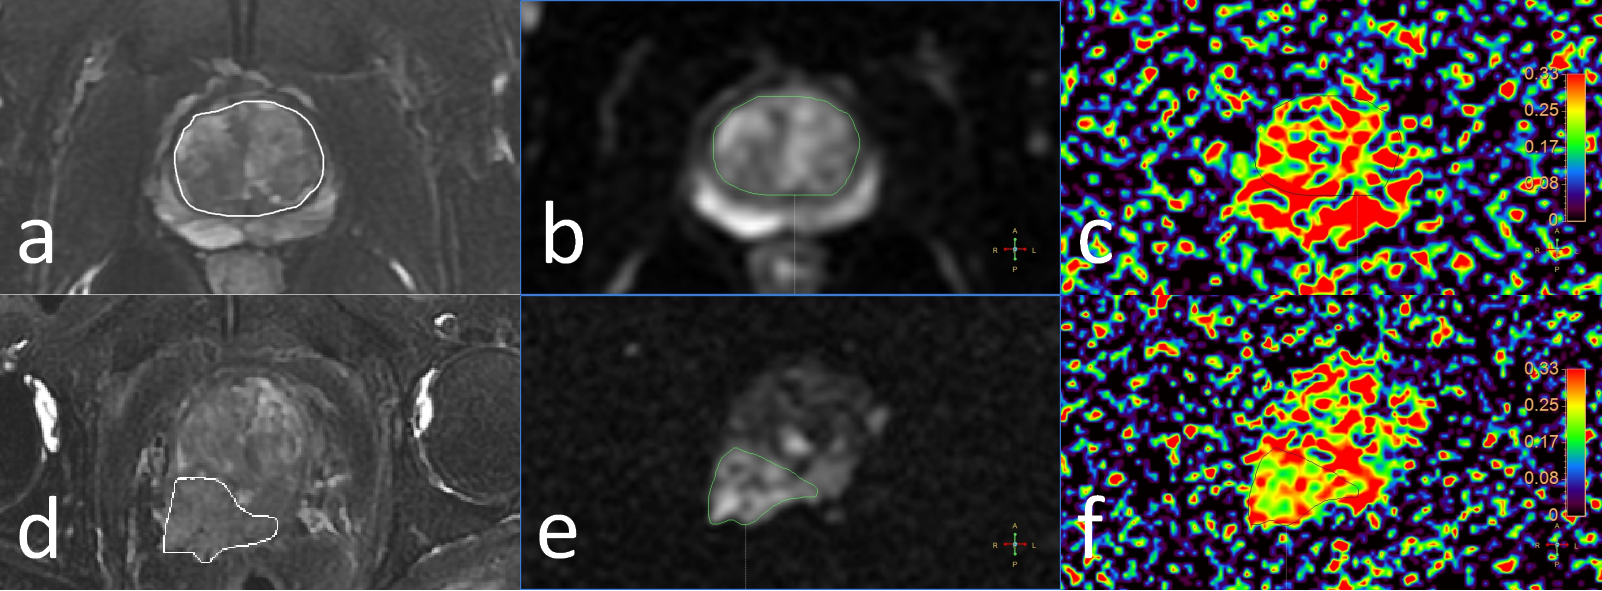
68 patients with pathologically confirmed prostate cancer or prostate hyperplasia were involved, including 34 patients in the BPH group with an average age of (71.65±7.29) years and 34 patients in the PCa group with an average age of (69.32±7.80) years. All patients underwent MR scans on a 3.0-T MR scanner (Ingenia CX, Philips Healthcare, Best, the Netherlands) with a 32-channel phased array body coil, and the sequences included T1WI, T2WI, DWI and UHB-DWI scans. Detailed scan parameters are shown in Table 1. The UHB-DWI data were transferred to the Intelli space Portal workstation (ISP v10.0, Philips Healthcare), where the ADA (advanced diffusion analysis) software was used to fit the UHB-DWI data for generation of the AQP-ADC map. Two radiologists independently draw the regions of interest (ROIs) to measure the AQP-ADC values for PCa and BPH lesions. For prostate hyperplasia, the ROIs were delineated along the edge of the central gland of prostate on the slice with the largest diameter of the prostate with reference to T2WI. For ROI of prostate cancer, the convention DWI images were used as reference to localize the lesions. All ROI were deliciated with the best exclusion of blood vessels, calcification and necrosis. Statistical analysis was performed using SPSS 25.0. The independent sample t test was used to analyze the difference of the AQP-ADC values between PCa and BPH. The receiver operating characteristic (ROC) curve was used to test the performance of AQP-ADC to distinguish the two types of lesions.Results
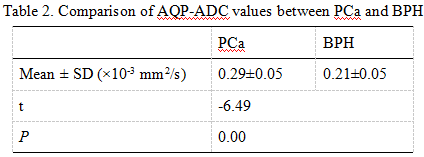
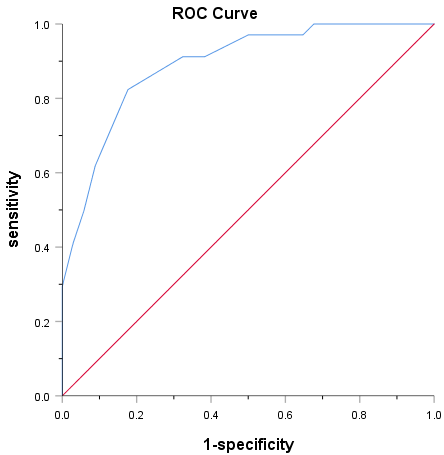
The AQP-ADC value was observed to be significantly higher in PCa that in BPH (0.29±0.05 vs. 0.21±0.05, p<0.05, Table 2). The area under ROC curve (AUC) of AQP-ADC for discrimination of PCa and BPH was 0.89 (Figure 2). When setting the cut-off AQP-ADC value to be 0.26×10⁻³ mm2/s, the sensitivity and specificity were 0.82 and 0.82, respectively.Discussion and Conclusion
The UHB-DWI based AQP-ADC measurements can reflect the express level of AQP in the membrane. We found that the AQP-ADC values of PCa were significantly higher than those of BPH, which was basically agreed with the fact that the expression level of AQP in prostate cancer was higher than that in benign prostatic hyperplasia [7]. In conclusion, the AQP-ADC may serve as a potential biomarker for differentiation between benign and malignant prostate lesions.Acknowledgements
NoReferences
[1] Torre LA, Bray F, Siegel RL, et al. Global cancer statistics, 2012. CA: a cancer journal for clinicians, 2015, 65(2): 87-108.
[2] Chatterjee A, Thomas S, Oto A. Prostate MR: pitfalls and benign lesions.[J] .Abdom Radiol (NY), 2019, undefined: undefined.
[3] Li C, Chen M, Wan B, et al. A comparative study of Gaussian and non-Gaussian diffusion models for differential diagnosis of prostate cancer with in-bore transrectal MR-guided biopsy as a pathologicalreference.Acta Radiol, 2018, 59: 1395-1402.
[4] Xueying L, Zhongping Z, Zhoushe Z, Li G, Yongjin T, Changzheng S, et al. . Investigation of apparent diffusion coefficient from ultra-high b-values in Parkinson’s disease. Eur Radiol 2015; 25: 2593–600.
[5] Tan Y, Zhang H, Wang X, et al. The value of multi ultra high-b-value DWI in grading cerebral astrocytomas and its association with aquaporin-4. Br J Radiol, 2018, 91: 20170696.
[6] Zhang G, Ma W, Dong H, et al. Based on Histogram Analysis: ADC Derived from Ultra-high b-Value DWI could be a Non-invasive Specific Biomarker for Rectal Cancer Prognosis. Sci Rep, 2020, 10: 10158.[7] Bründl J,Wallinger S,Breyer J et al. Expression, localisation and potential significance of aquaporins in benign and malignant human prostate tissue. BMC Urol, 2018, 18: 75.
Figures