4281
Magnetic resonance elastography imaging for the evaluation of MVI of T1 staging renal clear cell carcinoma preoperatively1Radiology, Sichuan University, West China Hospital, Chengdu, Sichuan, China, 2Urology, Sichuan University, West China Hospital, Chengdu,Sichuan, China
Synopsis
This prospective study evaluated the performance of 3D magnetic resonance elastography imaging for predicting microvascular invasion(MVI) of T1 staging renal clear cell carcinoma. 80 consecutive patients were enrolled. The mean MRE stiffness value has significant difference between the tumor with MVI (5.4±0.6 Kpa) or without MVI (4.1±0.3 Kpa) (p<0.05). The sensitivity, specificity, positive predictive value, negative predictive value, AUC of stiffness value to predict MVI were 100%, 75%, 63%, 96%, 0.87, respectively. 3D MRE imaging has promising diagnostic performance for T1 staging renal clear cell carcinoma MVI.
Introduction
Introduction: For focal renal cell carcinoma T1N0M0, high quality evidence suggests that surgery is the best therapy strategy[1]. The surgical strategy mainly contains radical nephrectomy (RN) and partial nephrectomy (PN). For tumors less than 4 cm in diameter, partial resection is more likely to be chosen. In the Kidney Cancer Management Guide, For RCC with a tumor diameter greater than 4 cm and less than 7 cm, there is no high-quality evidence to support which procedure (RN or PN) should be chosen. It is also mentioned in the guidelines that for patients with venous tumor thrombus, radical nephrectomy is currently recommended [1]. Sugino et al. [2] suggests that the first step in the invasion of tumor cells into large blood vessels is to grow in the efferent veins (i.e. venules) and then gradually spread to the large and medium veins. The venules belong to the category of the microvascular, and the microvascular is blood vessels that can only be seen under the microscope. If microvascular invasion (MVI) can be accurately predicted before surgery, the surgical strategy for patients with renal cell carcinoma will be more confident. This study aimed to evaluate the performance of 3D magnetic resonance elastography (MRE) imaging for predicting MVI of T1 staging renal clear cell carcinoma (ccRCC).Methods
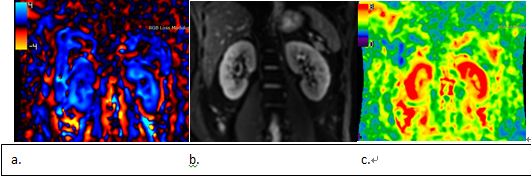
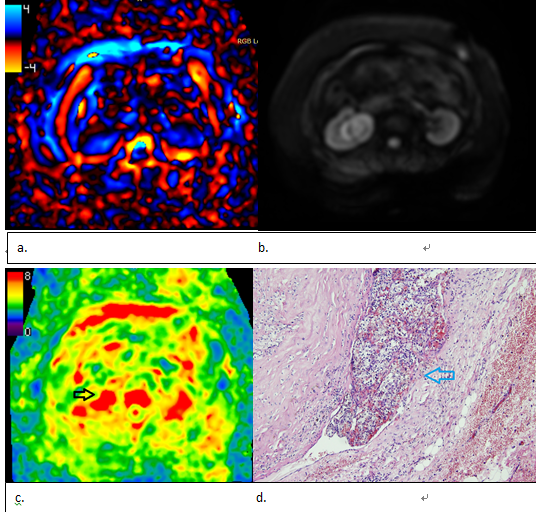
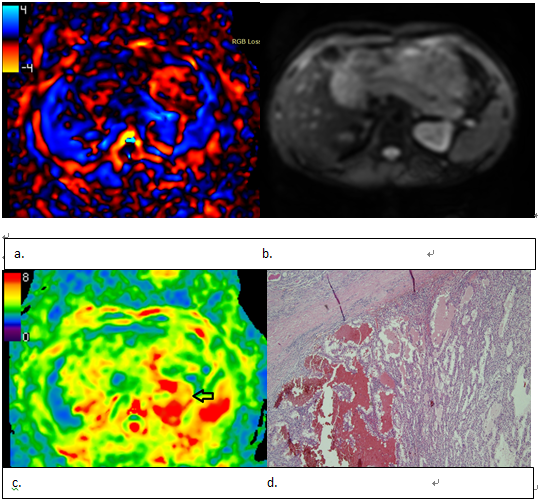
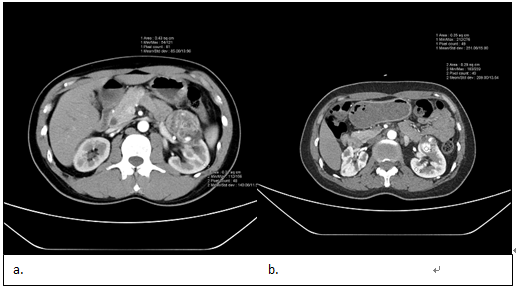
Methods: This prospective single-center cohort study was performed between January 2020 and January 2021, and 80 consecutive patients were enrolled in the study. All patients underwent pre-surgical imaging using a clinical 3.0 T MRI system. The MRE was acquired along the coronal plane of kidneys. 3D-SE MRE sequence was used to determine tissue displacement caused by the propagation of shear waves. Imaging parameters were as follows: TR 1300ms, TE 45.3ms, the frequency of applied motion was 90Hz. Slice thickness was 3.6 mm, number of slices was 32, to cover the whole kidney mass [3]. 3D MRE stiffness map was generated and transferred to the post-processing workstation, where stiffness value of the kidney parenchyma and tumors were measured. Since MVI was related to tumor blood supply, for comparison, pre-surgical contrast-enhanced CT was conducted to calculate tumor enhancement ratio. MVI was judged by histopathological analysis. All the statistical analyses were performed in SPSS 19.0 software (SPSS, Chicago, IL, USA). The calculated minimum sample sizes for predicting MVI by MRE and CT were 60, 55 respectively. Intra-class correlation coefficient (ICC) was used to assess the inter-observer reproducibility of MRE and CT enhancement ratio. Differences in mean stiffness value and CT tumor enhancement ratio between tumors with or without MVI were assessed. The relationship between MRE stiffness value/ CT tumor enhancement ratio and MVI by histopathological analysis was assessed using Pearson’s contingency coefficient, respectively. The diagnostic performance for predicting MVI was assessed.Results
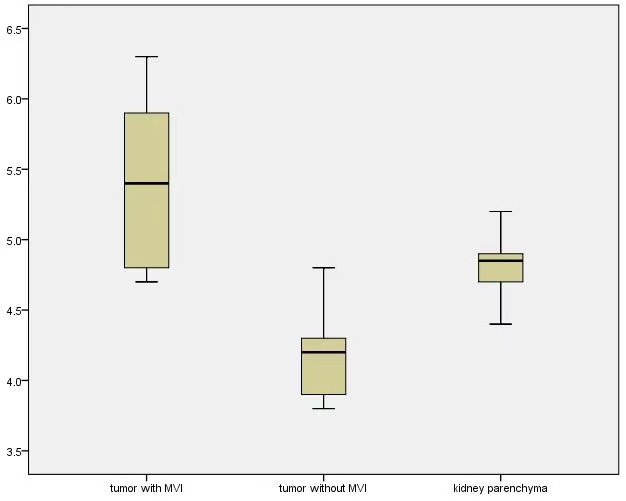
Results: 80 patients (Male number 45, female number 35, mean age 46.7±13.2 years-old) received radical nephrectomy were enrolled in this study, 22 of whom had tumor MVI. For inter-observer reproducibility, the ICC was 0.75 (95% CI, 0.7 to 0.82) for MRE, and 0.82 (95% CI, 0.73 to 0.89) for CT images, respectively. The mean MRE stiffness value of the kidney parenchyma and the kidney tumor is 4.8±0.2 Kpa and 4.5±0.7 Kpa, respectively. The mean MRE stiffness value has significant difference between the tumor with MVI (5.4±0.6 Kpa) or without MVI (4.1±0.3 Kpa) (p<0.05). The mean kidney tumor enhancement ratio in cortical-medullar phase is 2.6. Within the tumor, the mean kidney tumor enhancement ratio with MVI and without MVI is 3.1±0.6 and 1.7±0.3, respectively. The sensitivity, specificity, positive predictive value, negative predictive value, AUC of stiffness value to predict MVI were 100%, 75%, 63%, 96%, 0.87, respectively, and 90%, 80%, 63%, 96%, 0.88, respectively, for CT tumor enhancement ratio. Pearson’s contingency coefficient was 0.63 /0.61 between MRE stiffness value/ CT kidney tumor enhancement ratio and MVI.Discussion
Discussion: This is the first study to use 3D MRE to predict MVI of renal clear cell carcinoma, and the result showed that 3D MRE had promising diagnostic performance. MVI of kidney tumors is important for choosing the best therapy strategy since it is the former step of venous tumor thrombus. MRE imaging is a new functional magnetic resonance imaging. 3D MRE enables encoding of motion in all three dimensions and processing of non-planar waves with better evaluation of lesions. In our study, tumor with MVI has relatively higher stiffness value, this may due to tumor with MVI is more invasive, with higher cellular density, more extracellular collagen, higher blood flow, which influence the tissue stiffness. Positive predictive value was relatively low, indicated a part of tumors without MVI has high tumor tissue stiffness, this may reflect complex factors influence the tissue stiffness, other functional MRI techniques combined with MRE might be applied for increasing the positive predictive value. Tumors without MVI were softer (lower stiffness) than renal parenchyma, this may due to ccRCC usually was heterogeneous, the whole blood flow (including the cystic/necrotic part) may be lower than the renal parenchyma.Conclusions
Conclusions: 3D MRE imaging has promising diagnostic performance for T1 staging renal clear cell carcinoma MVI, which is compared to CT kidney tumor enhancement ratio.Acknowledgements
This work was supported by the China National Institutes of Health [grant number: 81801671] and Sichuan Provincial Science and Technology plan Grans [grant number: 2019YFS0445].References
1. Ljungberg B, Bensalah K, Canfield S et al. EAU guidelines on renal cell carcinoma: 2014 update. Eur Urol. 2015; 67:913-924
2. Sugino T, Yamaguchi T, Hoshi N et al. Sinusoidal tumor angiogenesis is a key component in hepatocellular carcinoma metastasis. Clin Exp Metastasis. 2008; 25:835-841
3. Qu Y, Middleton MS, Loomba R et al. Magnetic resonance elastography biomarkers for detection of histologic alterations in nonalcoholic fatty liver disease in the absence of fibrosis. Eur Radiol. 2021;31:8408-8419
4. Hectors SJ, Lewis S. Tomoelastography of the Prostate: Use of Tissue Stiffness for Improved Cancer Detection. Radiology 2021;299:371-373
Figures