4279
Apparent Diffusion Coefficient of Different Diffusion Times for Differentiation of Benign and Malignant Breast Tumors1Medical Imaging Center, People's Hospital of Ningxia Hui Autonomous Region, Yinchuan, China, 2Philips Healthcare, Beijing, China
Synopsis
Some novel biomarkers has emerged from the fact that apparent diffusion coefficient (ADC) depends strongly on the diffusion time, such as the rate of ADC change using two diffusion times for the differentiation of breast tumor types and a cell size modeling. In this study, we propose to use Multiband (MB) SENSE to accelerate the data acquisition of OGSE and PGSE sequences and compare the diagnostic value of ADC at different diffusion times for breast tumor. Our data showed superior diagnostic performance between benign and malignant breast lesions using ADC at a short diffusion time.
Introduction
Apparent diffusion coefficient (ADC) has been widely established as a diagnostic biomarker. Some novel biomarkers has emerged from the fact that ADC depends strongly on the diffusion time, such as the rate of ADC change using two diffusion times for the differentiation of breast tumor types1 and a cell size modeling technique call IMPULSED using three diffusion times2. These novel techniques typically use a combination of oscillating gradient spin echo (OGSE) and pulsed gradient spin echo (PGSE) sequences for data acquisition1,2, which usually requires a long TR, hence long scan time for the acquisition of multiple b values, diffusion times and large spatial coverage. In this study, we propose to use Multiband (MB) SENSE to accelerate the data acquisition and compare the diagnostic value of ADC from different diffusion times for breast tumor.Methods
Data acquisitionBoth OGSE and PGSE sequences were implemented and data were acquired on a Philips 3T scanner (Ingenia CX, Best, The Netherlands). 34 consecutive female patients (mean age, 50.18years) suspected of breast tumor/cancer were recruited between Feb 2021 to Oct 2021 and 34tumors were analyzed (18 benign and 16 malignant). The study was approved by the IRB of of People's Hospital of Ningxia Hui Autonomous Region and written informed consent was obtained from all the patients. The breast imaging protocol consisted of routine sequences (T1w, T2w, DCE) and an IMPULSED protocol, using MB=2. The sequence parameters for the IMPULSED protocol were listed in Table 1. Two OGSE sequences of 50Hz and 25 Hz and one PGSE sequence was used as reported in a previous study(2) (the corresponding diffusion time = 5 ms, 10 ms and 74 ms respectively). FOV =340×255mm2, in-plane resolution = 3*3 mm2, 16 slices with 5 mm slice thickness and 1 mm gap.
Data analysis
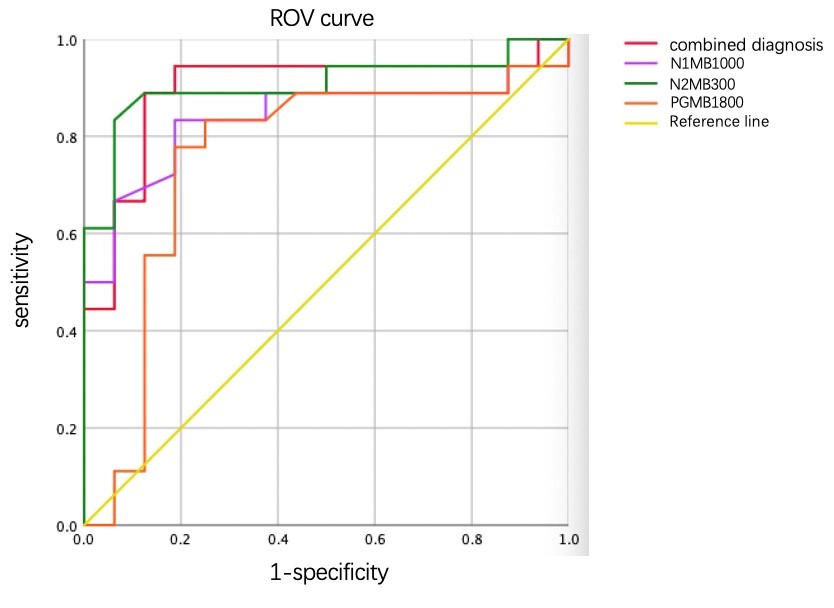
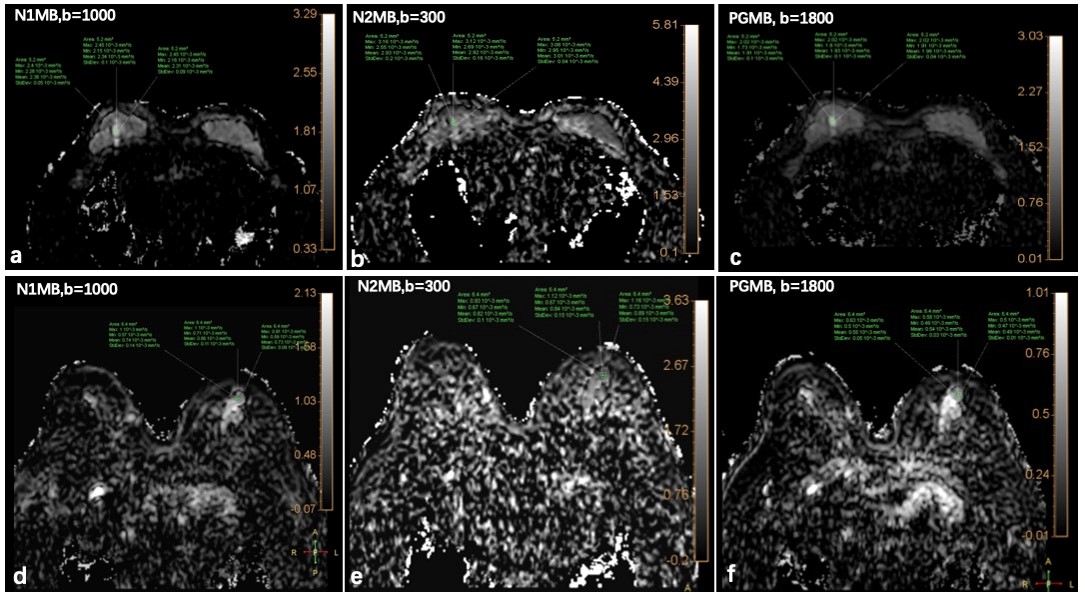
The ADC spectrum ADC(b, Δ) was calculated for each b value and diffusion time. 3 regions of interest (ROIs) were drawn on each lesion by a radiologist with 3 years of experience, referring to the DCE images, avoiding cyst and necrosis regions. The diagnostic performances to differentiate malignant and benign breast tumors for ADC calculated using b=0 and the largest b value for each sequence at the three diffusion times independently were investigated using the areas under the receiver operating characteristic curves (AUCs). The diagnostic performance using the combination of the ADC from three diffusion times was also investigated. The cutoff values were determined using Youden index.
Results
The ROI placement and mean ADC of one patient was shown in Figure 2, The AUC of ADC5ms, ADC10ms, ADC74ms and the combination of the three were 0.91, 0.84, 0.76, and 0.90 respectively. The sensitivity and specificity and the cutoff values were listed in Table 2.Discussion and conclusion
The ADC calculated using the shortest diffusion time showed the highest diagnostic performance, slightly higher than using three ADCs jointly. Although the effect of b value should also be accounted for, the largest achievable diffusion weighting for different diffusion times was restricted by the gradient performance of the system, especially for OGSE with high frequency. Specifically, the highest b value for OGSE at 50 Hz was about 300 s/mm2 on our current system and sequence implementation. However, for PGSE with a long diffusion time, the achievable b value was much higher. Our data showed superior diagnostic performance between benign and malignant breast lesions using ADC at a short diffusion time. Although further analysis should include the whole ADC spectrum to utilize the effect of diffusion weighting as well.Acknowledgements
No acknowledgement found.References
1. Iima M, Kataoka M, Honda M, et al. The Rate of Apparent Diffusion Coefficient Change With Diffusion Time on Breast Diffusion-Weighted Imaging Depends on Breast Tumor Types and Molecular Prognostic Biomarker Expression. Investigative radiology 2021;56(8):501-508.
2. Xu J, Jiang X, Li H, et al. Magnetic resonance imaging of mean cell size in human breast tumors. Magnetic resonance in medicine 2020;83(6):2002-2014.
Figures