4275
Clinical Value of Synthetic MRI and DCE-MRI in the Differentiation of Benign and Malignant Breast Lesions
jinrui liu1, mengyin xu1, zhihao li2, jialiang ren3, and zhaohui an1
1General Hospital of Ningxia Medical University, Yinchuan, China, 2GE Healthcare China, Xi’an, China, 3GE Healthcare China, Beijing, China
1General Hospital of Ningxia Medical University, Yinchuan, China, 2GE Healthcare China, Xi’an, China, 3GE Healthcare China, Beijing, China
Synopsis
In this study, an evaluation was proposed based on the clinical value of synthetic MRI parameters in distinguishing benign and malignant breast lesions. From conclusion, the T2-pre values and PD-pre values were statistically significant different between benign and malignant lesion. The combined T2-pre, PD-pre with BI-RADS outperformed BI-RADS only in discriminating malignant and benign lesions, which has potential clinical value for improving diagnostic accuracy of breast lesions.
Introduction
Female breast cancer has surpassed lung cancer as the most common diagnosed cancer1,which threatened women's health seriously. Dynamic Contrast-Enhanced MRI (DCE-MRI) has been widely used in the breast diseases due to good soft tissue resolution and multi-directional imaging advantages. Many studies have shown that MRI can significantly improve the diagnostic accuracy of breast disease2-6. DCE-MRI is a sharp tool to detect breast cancer, with a reported sensitivity of 94–100%, however, the specificity of DCE-MRI has been reported to be as low as 37–97%7-9, brings obstacles to clinical diagnosis and adds unnecessary histological biopsy as well.Synthetic MRI (SynMRI) is a recently developed MRI technique that uses multi-echo and multi-delay acquisition methods for simultaneous measurement of quantitative values such as T1 and T2 relaxation times, and proton density (PD) image mapping10-12. SynMRI technology has been widely applied to the study of diseases within brain, prostate, and musculoskeletal system 13-15. However, there are few studies on the diagnosis of breast diseases, which conclusions are not consistent. Our study is intended to explore the parameters of synMRI in the diagnosis of breast cancer.
Material and Methods
Two hundred and eleven patients with suspicious breast lesions were enrolled from September 2020 to March 2021. All patients underwent MR exams on a 3.0 T whole body scanner (GE Healthcare, Milwaukee, USA) with an 8-channel breast coil. The scan sequences included routine axial T2-weighted and T1-weighted imaging.SynMRI, DWI and DCE imaging were performed at the same time.All the SynMRI quantitative values were measured, including non-contrast MRI values (T1-pre, T2-pre, PD-Pre) and contrast MRI values (T1-Gd, T2-Gd, PD-Gd). Next, Delta-T1, Delta-T2, Delta-PD,T1-ratio and T2-ratiowere calculated before and after enhancement. According to the pathological results, patients were divided into benign and malignant groups. All those parameters of SynMRI were compared by Mann-Whitney U test. Univariate and multivariate analysis were developed to select indicators in diagnosing breast cancer. The receiver operating characteristic curve (ROC) was using to evaluate the diagnostic performance among MRI quantitative values.
DEC-MRI image evaluation refers to BI-RADS to classify the lesions. According to clinical practical applications, BI-RADS 4a and above are classified as benign, and BI-RADS 4b and below (BI-RADS 4c, BI-RADS 5, BI-RADS 6) is classified as malignant. The imaging diagnosis results are compared with the pathological results, and the sensitivity, accuracy and other indicators of the diagnosis are calculated.
Results
Overall, 116 lesions were included, of which 27 lesions were benign and 89 lesions were malignant. The T2-pre, PD-pre, T2-Gd, PD-Gd, Delta-T2, T1-ratio and T2-ratio values of malignant lesions were much lower than those of benign lesions . The univariate and multivariate analysis showed that the T2-pre, PD-pre values were important indicators for breast cancer diagnosis. The combined T2-pre and PD-pre model had good performance with AUC, accuracy, sensitivity, specificity, positive predictive value and negative predictive value of 0.84, 0.87, 0.68, 0.92 and 0.56 respectively. In addition, the combined T2-pre, PD-pre and BI-RADS model showed the best performance with AUC of 0.95, compared with AUC of 0.92 (p=0.0294) for BI-RADS only. By evaluating the diagnostic value, some key parameters for combined model are much higher than those for BI-RADS only. Key parameters include accuracy, sensitivity, specificity, positive predictive and negative predictive value with values of 0.95, 0.97, 0.89, 0.97, 0.89 for combined model, 0.91, 0.94, 0.79, 0.93, 0.81 for BI-RADS only.Discussion and Conclusion
Our study demonstrated that there were significant differences in the T2-Pre and PD-Pre values between the benign and malignant breast lesions. It is consistent with previous studies that T2 relaxation time can be used as a new auxiliary method for MRI diagnosis of breast cancer10. Our study likewise found that PD-pre is an important parameter to distinguish benign and malignant breast lesions. The PD-pre value of malignant lesions is lower than that of benign lesions, and the area under the ROC curve of PD-pre alone is 0.77. This result is consistent with the result that Gao16 reported that the AUC of PD in the diagnosis of breast cancer was 0.79, suggesting that the PD value can be used as an effective diagnostic parameter.In addition, through the combination of BI-RADS and Synthetic MRI parameters, a higher diagnostic performance (AUC of 0.95) than BI-RADS (AUC of 0.92) was obtained, some higher parameters values than BI-RADS includes sensitivity, specificity, accuracy, positive predictive value, negative predictive value are obtained as well. This combination effectively improve the specificity of BI-RADS examination and avoid unnecessary clinical biopsy. Nonetheless, one of the major limitations in our study is the relatively small number of lesions. Hence, future study with more cohort of subject is warranted. To be concluded, Synthetic MRI parameters can significantly improve the diagnostic efficacy of BI-RADS in the differential diagnosis of benign and malignant breast lesions.
Acknowledgements
We would like to thank Professor Chen for his encouragement and guidance throughout this project.References
1.Sung, H., et al., Global cancer statistics 2020: GLOBOCAN estimates of incidence and mortality worldwide for 36 cancers in 185 countries. CA Cancer J Clin, 2021.2.Partridge, S.C., et al., Quantitative diffusion-weighted imaging as an adjunct to conventional breast MRI for improved positive predictive value. AJR Am J Roentgenol, 2009. 193(6): p. 1716-22.
3.Baltzer, A., et al., Combined reading of Contrast Enhanced and Diffusion Weighted Magnetic Resonance Imaging by using a simple sum score. Eur Radiol, 2016. 26(3): p. 884-91.
4.Pinker, K., et al., Combined contrast-enhanced magnetic resonance and diffusion-weighted imaging reading adapted to the "Breast Imaging Reporting and Data System" for multiparametric 3-T imaging of breast lesions. Eur Radiol, 2013. 23(7): p. 1791-802.
5.Ei, K.R., et al., Diffusion-weighted imaging improves the diagnostic accuracy of conventional 3.0-T breast MR imaging. Radiology, 2010. 256(1): p. 64-73.
6.Pinker, K., et al., Diffusion-Weighted Imaging With Apparent Diffusion Coefficient Mapping for Breast Cancer Detection as a Stand-Alone Parameter: Comparison With Dynamic Contrast-Enhanced and Multiparametric Magnetic Resonance Imaging. Invest Radiol, 2018. 53(10): p. 587-595.
7.Al-Khawari, H., et al., Accuracy of the Fischer scoring system and the Breast Imaging Reporting and Data System in identification of malignant breast lesions. Ann Saudi Med, 2009. 29(4): p. 280-7.
8.Bluemke, D.A., et al., Magnetic resonance imaging of the breast prior to biopsy. JAMA, 2004. 292(22): p. 2735-42.
9.Orel, S.G. and M.D. Schnall, MR imaging of the breast for the detection, diagnosis, and staging of breast cancer. Radiology, 2001. 220(1): p. 13-30.
10.Liu, L., et al., Role of quantitative analysis of T2 relaxation time in differentiating benign from malignant breast lesions. J Int Med Res, 2018. 46(5): p. 1928-1935.
11.Warntjes, J.B., O. Dahlqvist and P. Lundberg, Novel method for rapid, simultaneous T1, T2*, and proton density quantification. Magn Reson Med, 2007. 57(3): p. 528-37.
12.Hagiwara, A., et al., SyMRI of the Brain: Rapid Quantification of Relaxation Rates and Proton Density, With Synthetic MRI, Automatic Brain Segmentation, and Myelin Measurement. Invest Radiol, 2017. 52(10): p. 647-657.
13.Hagiwara, A., et al., Synthetic MRI in the Detection of Multiple Sclerosis Plaques. AJNR Am J Neuroradiol, 2017. 38(2): p. 257-263.
14.Hoang, D.A., et al., Characterization of prostate cancer using T2 mapping at 3T: a multi-scanner study. Diagn Interv Imaging, 2015. 96(4): p. 365-72.
15.Yi, J., et al., Clinical Feasibility of Synthetic Magnetic Resonance Imaging in the Diagnosis of Internal Derangements of the Knee. Korean J Radiol, 2018. 19(2): p. 311-319.
16.Gao, W., et al., Investigation of Synthetic Relaxometry and Diffusion Measures in the Differentiation of Benign and Malignant Breast Lesions as Compared to BI-RADS. J Magn Reson Imaging, 2020.
Figures
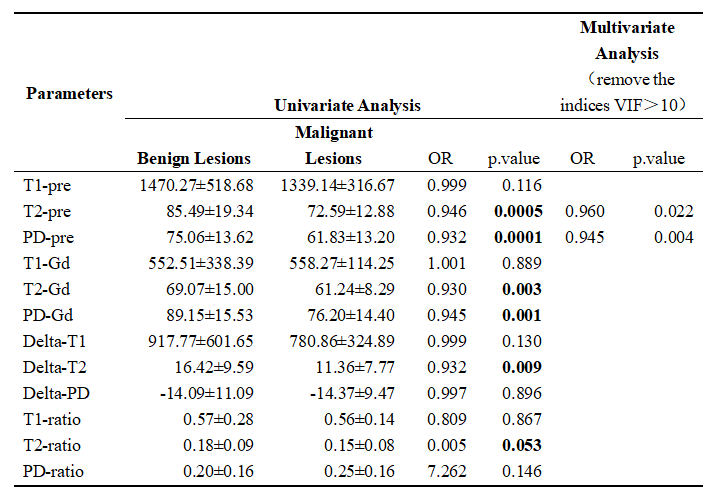
Table 1. Univariate and multivariate analysis of parameters of synthetic MRI in the Differentiation of Benign and Malignant Breast Lesions.
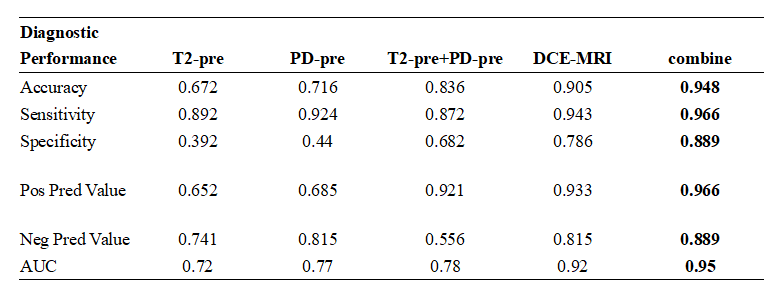
Table 2. Comparison of the diagnostic performance between MRI quantitative values and DCE-MRI.
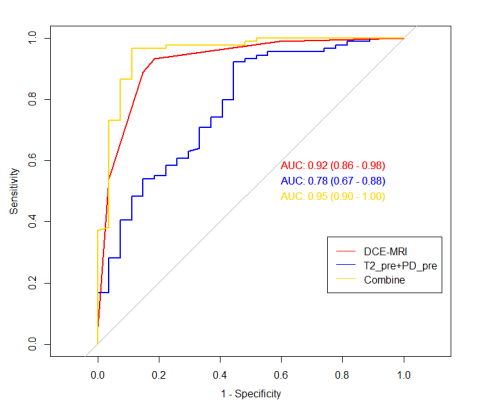
Figure 1. The ROC curves of Synthetic MRI type, DCE-MRI type, and DCE-MRI + Synthetic MRI type for discrimination between benign and malignant breast masses.
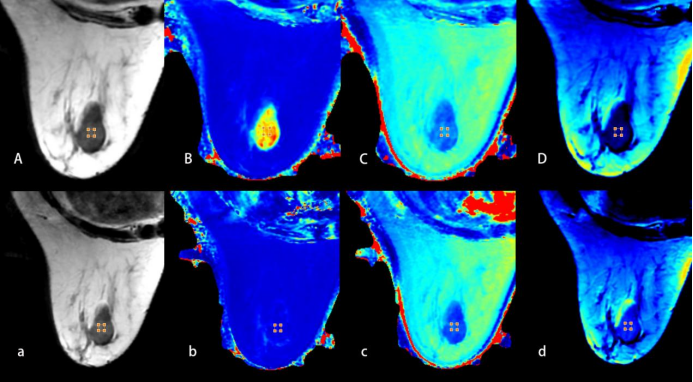
Figure 2. A 71-year-old woman with fibroadenoma of the right breast.
A, B, C, D and a, b, c, d are quantitative images obtained before and after contrast agent injection respectively. (A and a) T2 (synthetic); (B and b) T1 map; (C and c) T2 map; (D and d) PD map.
The ROI showed the quantifications: T1-Pre = 1.61 10-3ms, T2-Pre = 83.00ms, PD-Pre = 66.30pu;T1-Gd = 0.47 10-3ms, T2-Gd = 71.00ms, PD-Gd = 83.80pu
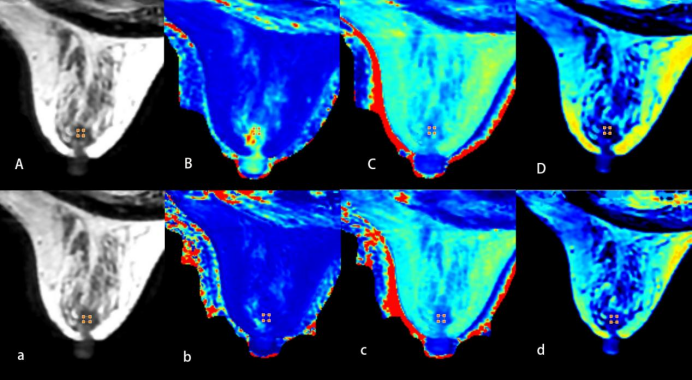
Figure 3. A 46-year-old woman with invasive ductal carcinoma of the right breast. A、B、C、D and a、b、c、d are quantitative images obtained before and after contrast agent injection respectively.(A and a) T2(synthetic); (B and b) T1 map; (C and c) T2 map; (D and d) PDmap. The ROI showed the quantifications: T1-Pre = 1.36 10-3ms, T2-Pre = 73.00 ms, PD-Pre = 58.70 pu;T1-Gd = 0.45 10-3ms, T2-Gd = 65.00 ms, PD-Gd = 71.00 pu
DOI: https://doi.org/10.58530/2022/4275