4274
Mean Apparent Propagator-MRI: A Novel Diffusion-Based Approach for Quantitative Assessment of Tumor-Stromal Ratio in Breast Carcinoma1Sun Yat-Sen Memorial Hospital, Sun Yat-Sen University, Guangzhou, China, 2MR Scientific Marketing, Siemens Healthineers, Guangzhou, China, 3Shanghai Key Laboratory of Magnetic Resonance, School of Physics and Electronic Science, East China Normal University, Shanghai, China
Synopsis
Mean apparent propagator (MAP)-MRI establishes a robust analytical framework based on the random motion distribution of natural water molecules. This study investigated the application of quantitative parameters derived from MAP-MRI in patients with breast cancer and determined whether MAP-MRI can be adopted as a better method than apparent diffusion coefficient (ADC) from conventional DWI to preoperative diagnosis tumor-stromal ratio. The results suggested that quantitative assessment with MAP-MRI showed superior predictive performance than conventional DWI for preoperative diagnosis of tumor-stromal ratio in patients with breast cancer.
Introduction
Breast cancer has overtaken lung cancer as the leading cause of global cancer and remains the female tumor-induced mortality in 2020 (1). Diffusion MRI techniques, such as MAP-MRI, have emerged as a powerful tool to evaluate brain microstructure in vivo, as they can provide new insights into the complexity and inhomogeneity of the brain microstructure (2). Nonetheless, whether MAP-MRI could be used to predict the microenvironment of breast cancer remains a paucity of data. Tumor stroma is a critical component of the tumor microenvironment that contributes to the initiation and progression of the tumor. Tumor stromal ratio (TSR), referring to the ratio of the tumor proportion to the stromal component in a pathologic section, can be used as a therapeutic response indicator and prognostic predictor for breast cancer (3, 4). Suppose the accurate prediction of TSR status that reflects the tumor microenvironment of breast cancer based on MAP-MRI-derived parameters is possible. In that case, it will improve practitioners' clinical decision-making confidence, such as predicting tumor stroma-related therapeutic response and prognosis. We hypothesized that the MAP-MRI-derived quantitative parameters were expected to reflect breast cancer's tumor-stromal status accurately. In our study, MAP-MRI and conventional DWI were performed in patients with invasive ductal breast carcinoma. The MAP-MRI quantitative multi parameters and ADC values were obtained and compared.Methods
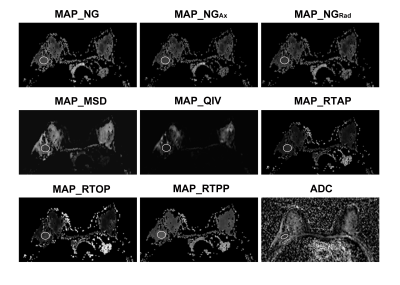
A total of 81 female patients (average age, 50 years; range, 26-78 years) with pathologic-proved invasive ductal breast carcinomas were prospectively recruited. Pathologic assessment of TSR was performed by the pathologist on hematoxylin and eosin-stained sections, and they were divided into the stroma-poor group (stromal component percentage < 50%, indicating a high TSR) and the stroma-rich group (stromal component ≥ 50%, indicating a low TSR). All patients underwent breast MRI on a 3T MR scanner (MAGNETOM Skyra, Siemens Healthcare, Erlangen, Germany) with a dedicated phased-array bilateral breast coil. MR examination, including conventional DWI and diffusion spectral imaging (DSI) sequence, was sequentially performed. The DSI data was composed of 100 diffusion q-space samples using a grid sampling scheme in spectral attenuated inversion recovery fat suppression, with nine b-values (0, 200, 450, 650, 900, 1100, 1350, 1800, and 2000 msec/mm2), along 2, 6, 12, 8, 6, 24, 24, 12 and 6 directions, respectively. The other acquisition parameters of DSI were as follows: repetition time/echo time = 6600/97 msec, field of view = 350 × 350 mm2, acquisition matrix = 174 × 174, slice thickness = 4 mm, slice gap = 0.8 mm, and acquisition time = 11 mins 33 secs. The DWI incorporated two b values (0 and 800 sec/mm2) with fat suppression. In a total of eight sets of quantitative maps derived from MAP-MRI, including non-Gaussianity (NG), axial non-Gaussianity (NGAx), radial non-Gaussianity (NGRad), mean squared displacement (MSD), q-space inverse variance (QIV), return-to-axis probability (RTAP), return-to-origin probability (RTOP), and return-to-plane probability (RTPP), were calculated using an in-house developed software called NeuDiLab, which is based on an open-resource tool DIPY (Diffusion Imaging in Python, http://nipy.org/dipy). The ADC maps derived from the conventional mono-exponential model were obtained automatically on the MR scanner. The MAP-MRI quantitative parameters and ADC value were measured on corresponding quantitative images, as shown in Figure 1. Univariable and multivariable binary logistic regression analyses were used to determine the independent risk factors of MRI quantitative parameters for the discriminating of the TSR. The receiver operating characteristic curves (ROCs) of the single and combination of MAP-MRI quantitative parameters were delineated, respectively, and the area under the curves (AUCs), sensitivities, specificities, and accuracies were also calculated.Results
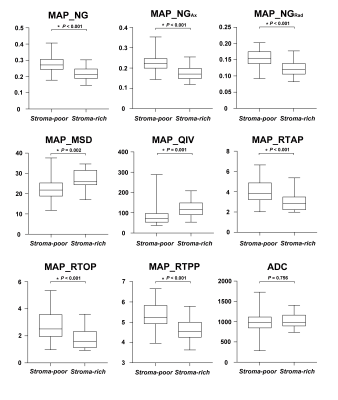
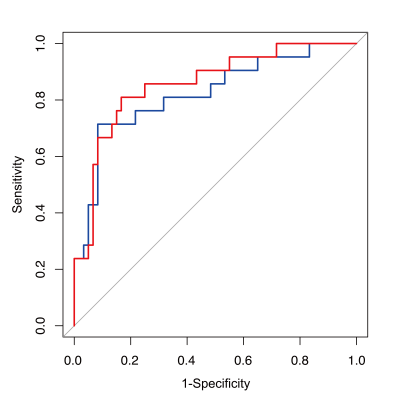
As shown in Figure 2, between the stroma-poor group and stroma-rich group, there were significant differences in all the eight MAP-MRI quantitative parameters (P < 0.001 to P = 0.002), while no significant difference was found in ADC value (P = 0.756). Figure 3 and Table 1 demonstrated that the AUCs of MAP-MRI quantitative parameters were all above 0.7. Univariable logistic regression analysis showed that among MAP-MRI quantitative parameters and ADC value, all the MAP-MRI quantitative parameters were predictors for discriminating stroma-rich and stroma-poor tumors (P < 0.001 to P = 0.002). Further multivariable logistic regression analysis showed that NGAx and RTAP were the independent predictors for the TSR diagnosis (P < 0.001 and P = 0.020, respectively) (Table 2). NGAx (AUC = 0.823, sensitivity = 71.4%, specificity = 91.7%, and accuracy = 86.4%), and NGAx and RTAP (AUC = 0.856, sensitivity = 80.9%, specificity = 83.3%, and accuracy = 82.7%) were the best single and combination of MAP-MRI quantitative parameters to distinguish TSR, respectively.Discussion and Conclusion
Our results demonstrate that both the single and combination of quantitative parameters derived from MAP-MRI showed superior predictive performance for the noninvasive discrimination of stroma-rich and stroma-poor status in patients with breast carcinoma. Our study suggests that MAP-MRI quantitative parameters could serve as a more favorable in vivo tool to reflect detailed histopathologic information of microenvironment, i.e., TSR, than conventional ADC value. This may help us understand how the tumor's biological heterogeneity influences imaging parameters, which might assist clinical applications, such as elucidating the disease mechanism, planning breast cancer treatment, and predicting prognosis.Acknowledgements
We thank all the participants in this study.References
1. Sung H, Ferlay J, Siegel RL, Laversanne M, Soerjomataram I, Jemal A, Bray F. Global Cancer Statistics 2020: GLOBOCAN Estimates of Incidence and Mortality Worldwide for 36 Cancers in 185 Countries. CA Cancer J Clin. 2021;71(3):209-249. doi: 10.3322/caac.21660.2.
2. Özarslan E, Koay CG, Shepherd TM, Komlosh ME, İrfanoğlu MO, Pierpaoli C, et al. Mean Apparent Propagator (MAP) MRI: a Novel Diffusion Imaging Method for Mapping Tissue Microstructure. Neuroimage. 2013;78:16-32. doi: 10.1016/j.neuroimage.2013.04.016. 3.
3. Vangangelt KMH, Green AR, Heemskerk IMF, Cohen D, van Pelt GW, Sobral-Leite M, Schmidt MK, Putter H, Rakha EA, Tollenaar RAEM, Mesker WE. The Prognostic Value of the Tumor-Stroma Ratio is Most Discriminative in Patients with Grade III or Triple-Negative Breast Cancer. Int J Cancer. 2020;146(8):2296-2304. doi: 10.1002/ijc.32857.
4. Vangangelt KMH, van Pelt GW, Engels CC, Putter H, Liefers GJ, Smit VTHBM, Tollenaar RAEM, Kuppen PJK, Mesker WE. Prognostic Value of Tumor-Stroma Ratio Combined with the Immune Status of Tumors in Invasive Breast Carcinoma. Breast Cancer Res Treat. 2018;168(3):601-612. doi: 10.1007/s10549-017-4617-6.
Figures

Figure 1. Measurement of quantitative parameters derived from the mean apparent propagator (MAP)-MRI and apparent diffusion coefficient (ADC) maps.

