4270
Multiband Accelerated IMPULSED Protocol for Breast Tumor Imaging1Medical Imaging Center, People's Hospital of Ningxia Hui Autonomous Region, Yinchuan, China, 2Philips Healthcare, Beijing, China
Synopsis
The investigation of time dependent diffusion imaging techniques such as IMPULSED is emerging for clinical research since recently made available on 3T scanners. IMPULSED requires the acquisition of diffusion images at different diffusion times and diffusion weightings. In this study, we proposed to use Multiband to accelerate the data acquisition for IMPULSED and compared the ADC spectrum for two protocols. Our results showed the consistency in ADC calculation for the Multiband accelerated protocol with the result without using Multiband.
Introduction
Cell size is a fundamental characteristic of all tissues, and changes in cell size in cancer reflect tumor status and response to treatments1. Recently, a diffusion imaging based technique called IMPULSED (imaging microstructural parameters using limited spectrally edited diffusion) was reported for cell size imaging on a clinical 3T scanner2. The data acquisition protocol for IMPULSED consists of oscillating gradient spin echo (OGSE) and pulsed gradient spin echo (PGSE) sequences using different diffusion times. Both OGSE and PGSE usually requires a long TR, hence long scan time for the acquisition of multiple b values, diffusion times and large spatial coverage. In this study, we propose to use Multiband (MB) SENSE to accelerate the IMPULSED protocol for breast tumor imaging.Methods
Data acquisitionBoth OGSE and PGSE sequences were implemented and data were acquired on a Philips 3T scanner (Ingenia CX, Best, The Netherlands). 21 consecutive female patients (mean age, 48.43 years) suspected of breast tumor were recruited between Feb 2021 to Oct 2021. The study was approved by the IRB of People's Hospital of Ningxia Hui Autonomous Region and written informed consent was obtained from all the patients. The breast imaging protocol consisted of routine sequences (T1w, T2w,DWI, DCE) and two IMPULSED protocols, one using MB=2(N1MB,N2MB,PGMB) and the other without MB (N1,N2,PG). The common sequence parameters for the two IMPULSED protocols were: two OGSE sequences of 25Hz(N1)and 50 Hz(N2)and one PGSE sequence as reported in a previous study2. FOV =340×255 mm2, in-plane resolution = 3×3 mm2, 16 slices with 5 mm slice thickness and 1 mm gap. The detailed parameters for the IMPULSED protocols were listed in Table 1.
Data analysis
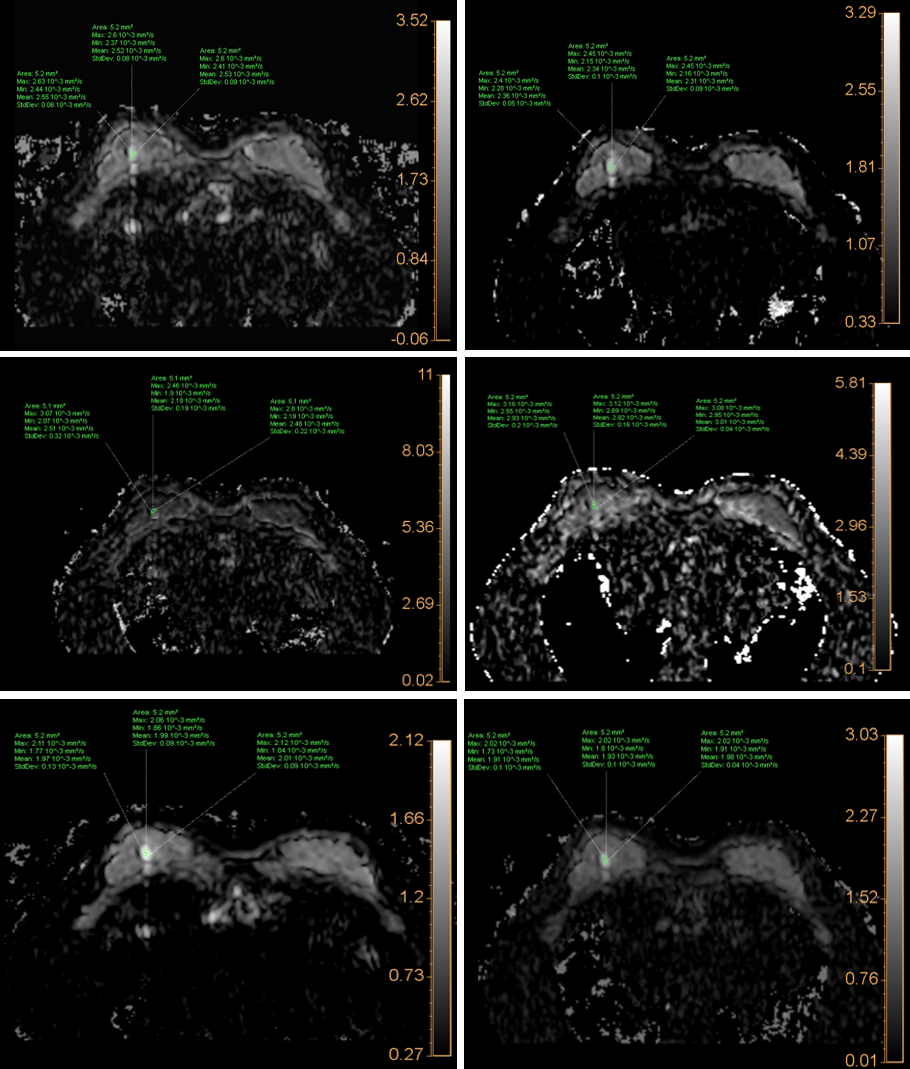
The ADC spectrum ADC(b, Δ) was calculated for each b value and diffusion time Δ. 3 regions of interest (ROIs) were drawn on each lesion by a radiologist with 3 years of experience, referring to the DCE images, with necrosis, hemorrhage and cyst excluded. Paired t test was used to compare the corresponding ADC from the two protocols. A p-value < 0.01 was considered to be statistically significant. All statistical analysis were performed using the SPSS software package (version 25, IBM SPSS, USA).
Results
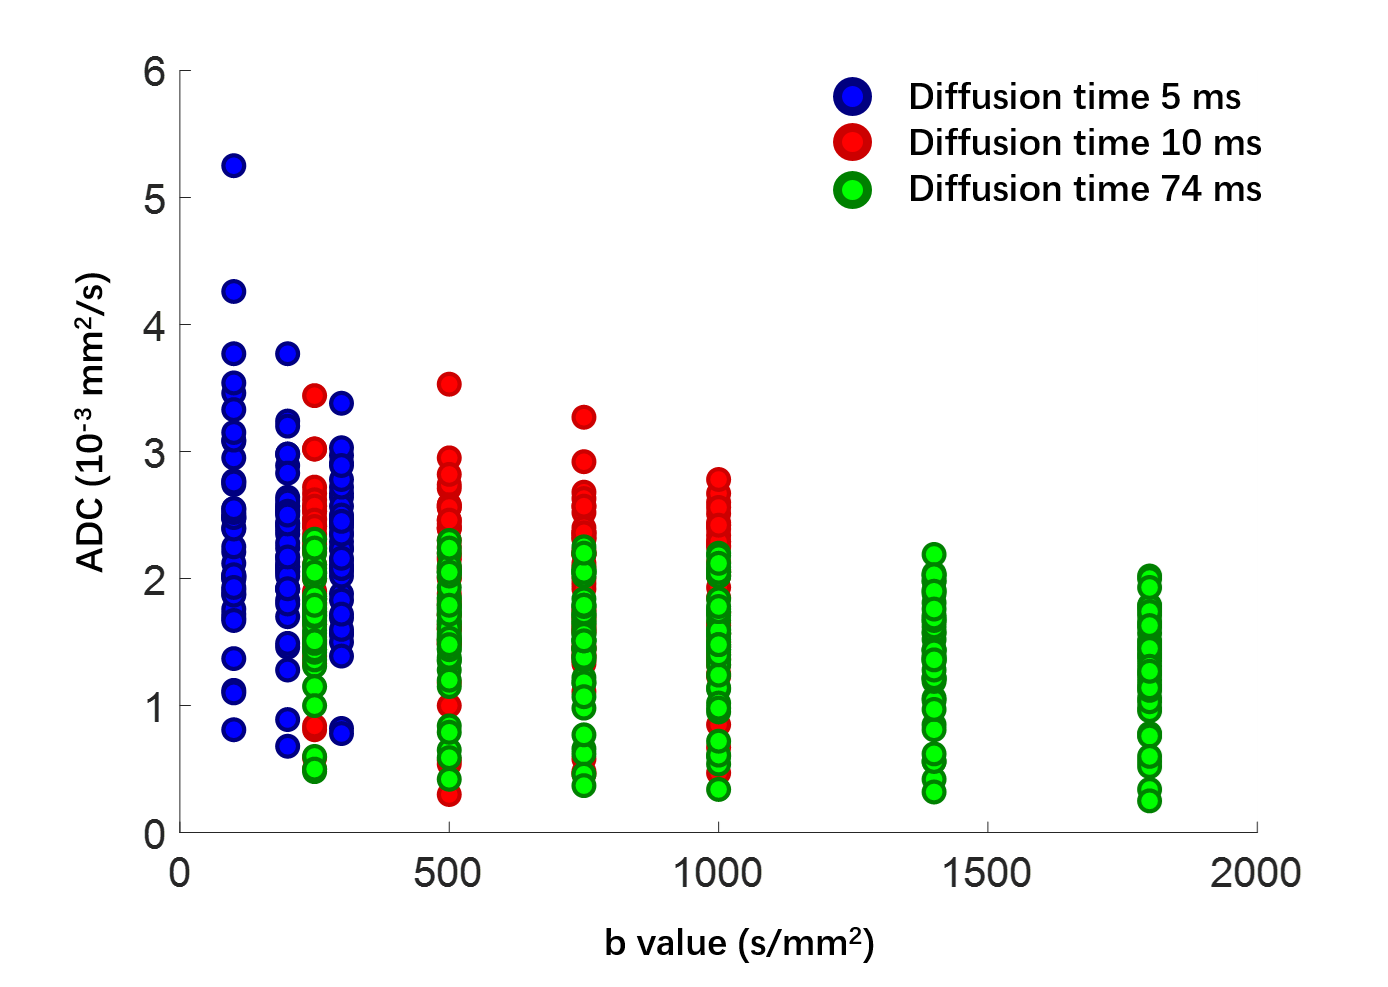
The results of the statistical analysis were shown in Table 2(a-c). There was no statistically significant difference for ADC comparison from all the b values and diffusion times. The ROI placement and mean ADC of one patient was shown in Figure 1(a-f). The scatter plot in Figure 2 showed the ADC spectrum of all ROIs. There’s a clear pattern that the ADC of shorter diffusion times is larger than those from long diffusion times. The total scan time of the protocol using MB=2 was 5 minutes shorter than that without using MB.Discussion and conclusion
OGSE and PGSE are typically gradient performance draining sequences although recently made available on clinical 3T scanners by a few research facilities. Multiband technique can reduce the need for frequent gradient switching and the scan time. Our results showed that, the ADC spectrums for the two IMPULSED protocols were highly consistent, which may lay the foundation for reliable model fitting using MB accelerated data, such as cell imaging.Acknowledgements
No acknowledgement found.References
1. Sun L, Sakurai S, Sano T, Hironaka M, Kawashima O, Nakajima T. High-grade neuroendocrine carcinoma of the lung: Comparative clinicopathological study of large cell neuroendocrine carcinoma and small cell lung carcinoma. Pathology International 2009;59(8):522-529.
2. Xu J, Jiang X, Li H, et al. Magnetic resonance imaging of mean cell size in human breast tumors. Magnetic resonance in medicine 2020;83(6):2002-2014.
Figures