4268
Constructing XGboost prediction model based on 3.0T diffusion kurtosis imaging improves the diagnostic performance for breast cancer1Radiology Department, Second Affiliated Hospital of Shantou University Medical College, Shantou, China, 2Institute of Health Monitoring,Inspection and Protection,Hubei Provincial Center for Disease Control and Prevention,Hubei Provincial Key Laboratory for Applied Toxicology, Wuhan, China, 3Shantou University,College Of Engineering, Shantou, China
Synopsis
This study demonstrated that MK derived from DKI was performed better than MD, ADC, Ve, Kep and Ktrans for differentiating between benign and malignant BLs. Also, MK has great potentialities in predict histological grades, lymph node status and Ki-67 expression of BCs. Finally, a XGboost model was constructed by combining MD, MK, age, shape and menstrual status, which exhibited superior diagnostic performance for BC characterization and an improved assessment of BLs. The findings of current study will aid the development of a novel noninvasive approach for BC screening and clinical diagnosis, therefore reducing unnecessary biopsies and patient`s anxiety.
Introduction
Breast cancer (BC) is the most common cancer and a leading cause of female mortality worldwide.1 Multi-parametric magnetic resonance imaging (MRI), a non-invasive modality that provides excellent soft-tissue contrast, is well-established for BC characterization, treatment planning, and post-operative prognostication.2 Breast MRI findings using the Breast Imaging-Reporting and Data System (BI-RADS) lexicon descriptors provides standardized language to define the final assessment categories for predicting the likelihood of malignancy, which allows radiologist to communicate important findings in a consistent and repeatable manner.3However, the malignant probability of MRI BI-RADS 4 ranges from 2% to 95%4, leading to unnecessary biopsies and even causing great anxiety in patients. Diffusion kurtosis imaging (DKI) follows a non-Gaussian distribution and our preliminary work with 3.0-T imaging revealed MK usefulness for predicting tumor aggressiveness5. The purpose of this study involved in larger sample sizes was to construct an optimal XGboost prediction model through a combination of MK independently or jointly with other MR imaging features and clinical characterization, which was expected to reduce false positive rate of MRI BI-RADS 4 and improve diagnosis efficiency of BC, thereby preventing unnecessary biopsies and optimizing personalized diagnosis and treatment.Methods
120 patients (median age: 44 years, range: 17–71 years) with 158 BLs were enrolled, which were divided into a test group (n=108, malignancy=53, benign=55), and a validation group (n=50, malignancy=25, benign=25) clinically diagnosed as MRI BI-RADS 4. Training group was used to construct a diagnostic model and validation group was used to verify the diagnostic accuracies of the model. T1-weighted imaging (T1WI), T2-weighted imaging (T2WI), DKI, DWI, 1H-MRS and DCE-MRI were performed on a 3.0-T scanner. Wilcoxon signed rank test and χ2 test were used to compare patient’s mean kurtosis (MK), mean diffusivity (MD), apparent diffusion coefficient (ADC) from DWI, total choline (tCho) peak, extracellular volume ratio reflecting vascular permeability (Ve), flux rate constant (Kep) and volume transfer coefficient reflecting vascular permeability (Ktrans). Receiver operating characteristic curve (ROC) analysis was used to analyze diagnostic performances of the imaging parameters. Spearman correlation analysis was performed to evaluate the associations of imaging parameters with prognostic factors and breast cancer molecular subtypes. The selection operator algorithm (Lasso) and Area Under the Curve (AUC) of imaging parameters were used to select the discriminative features for the diagnosis of benign and malignant breast lesions. Finally, the XGboost prediction model was constructed based on these selected features in the training group, of which the optimal feature subset was determined by fifty times trifold cross-validation.Result
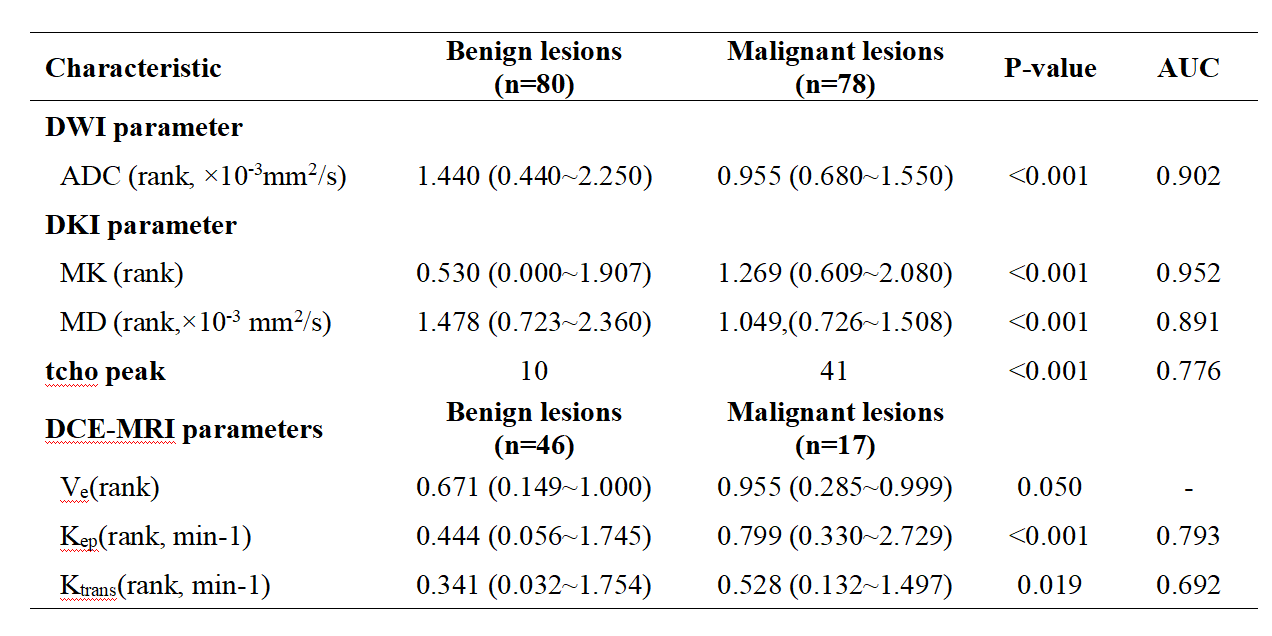
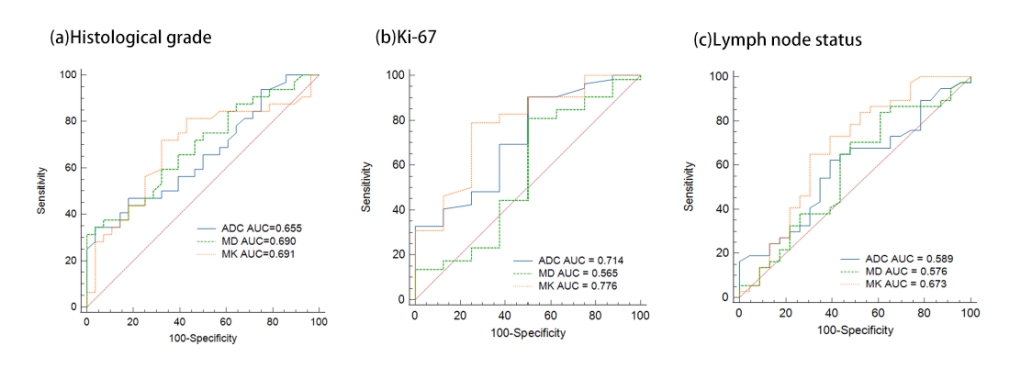
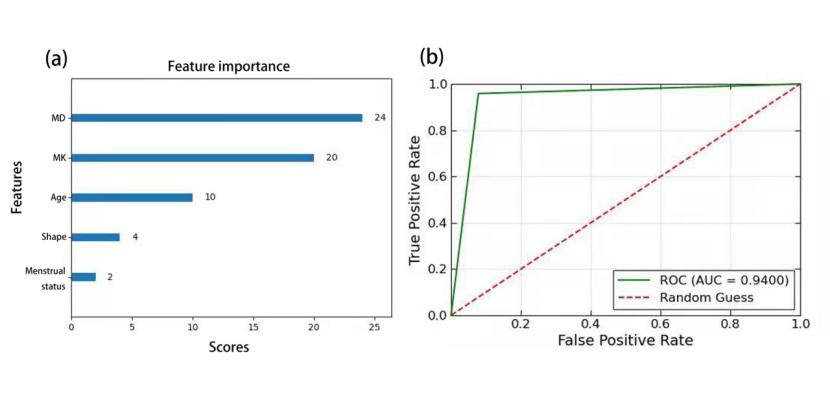
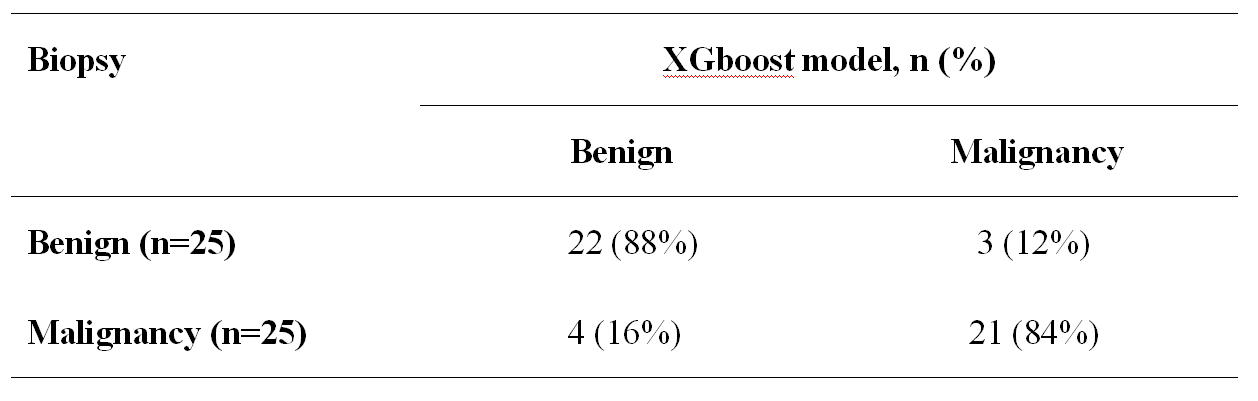
Relative to benign lesions, malignant lesions were associated with lower ADC values ([median 0.955, range 0.68~1.55]×10-3 mm2/s vs. [median 1.440, range 0.44~2.25]×10-3 mm2/s; p<0.001), lower MD values ([median 1.049, range 0.726~1.508]×10-3 mm2/s vs. [median 1.478, range 0.723~2.360] ×10-3 mm2/s; p<0.001), higher MK values ([median 1.269, range 0.609~2.080] vs. [median 0.530, range 0.000~1.907]; p<0.001), higher Kep value ([median 0.799, range 0.330~2.729] min-1 vs. [median 0.444, range 0.056~1.745] min-1; p<0.001), and higher Ktrans value ([median 0.528, range 0.132~1.497] min-1 vs. [median 0.341, range 0.032~1.754] min-1; p = 0.019) (Table 1). The Ve values did not show significant difference between benign and malignant masses. MK was better for differentiating between malignant and benign lesions (0.952), than ADC (0.902), MD (0.891), tCho (0.776) , Kep (0.793) and Ktrans (0.692)(Table 1). MK could well distinguish histological grades (AUC: 0.655) and lymph node status (AUC:0.589). Furthermore, MK was best at distinguishing between high-Ki67 and low-Ki67 breast cancer (AUC: 0.776; p<0.05) (Figure 1). 5 non-enhanced features including MD, MK, age, shape and menstrual status were selected to be the optimized feature subset to construct a XGboost model, which exhibited superior diagnostic ability for BC characterization in the test group, with a ROC value of 0.940 (Figure 2). To further verify the predictive reliability of this model for BC diagnosis, 50 MRI BI-RADS 4 breast masses (malignancy=25, benign=25) in validation group were introduced into this model, of which 21 cases were correctly diagnosed as malignant and 22 cases were correctly diagnosed as benign ones, with the diagnostic sensitivity and specificity of 84% and 88%, respectively(Table 2).Disscussion and Conclusion
This study demonstrated that MK derived from DKI was performed better than MD, ADC, Ve, Kep and Ktrans for differentiating between benign and malignant BLs. The reason might be due to the rapid proliferation of malignant tumor. MK reflects the displacement of Gaussian diffusion and tissue complexity, which is considered proportional to the neoplasm’s cellular microstructural heterogeneity and tissue complexity. And in malignant tissues, water molecule diffusion is usually restricted by intracellular, extracellular, and intravascular spaces, as well as by tightened cellular membrane microstructures, leading to lower MD values. An optimized XGboost model that included DKI and clinical features (age, shape and menstrual status) is effective to improve the diagnostic specificity of MRI BI-RADS 4 masses, therefore preventing unnecessary biopsies and optimizing personalized diagnosis and treatment.Acknowledgements
This study was supported by grants from the National Natural Science Foundation of China (82071973, 82020108016) and Natural Science Foundation of Guangdong Province (2020A1515011022).References
1. Latest global cancer data: Cancer burden rises to 19.3 million new cases and 10.0 million cancer deaths in 2020.
2. Kuhl CK. The Changing World of Breast Cancer: A Radiologist's Perspective. Invest Radiol 2015; 50(9): 615-28.
3. D’Orsi CJ SE, Mendelson EB. ACR BI-RADSR Atlas, Breast Imaging Reporting and Data System. 5th ed, Reston, VA: American College of Radiology; 2013.
4. Leithner D, Wengert G, Helbich T, Morris E, Pinker K. MRI in the Assessment of BI-RADS(R) 4 lesions. Top Magn Reson Imaging 2017; 26(5): 191-9.
5. Huang Y, Lin Y, Hu W, et al. Diffusion Kurtosis at 3.0T as an in vivo Imaging Marker for Breast Cancer Characterization: Correlation With Prognostic Factors. J Magn Reson Imaging 2019; 49(3): 845-56.
Figures