4261
Quantitative Evaluation of Liver Function using Normalized Gadoxetic Acid Concentration in Hepatobiliary Phase1Graduate School of Health Sciences, Kumamoto University, Kumamoto, Japan, 2Department of Medical Image Sciences, Faculty of Life Sciences, Kumamoto University, Kumamoto, Japan, 3Department of Radiology, Fukuoka University Chikushi Hospital, Fukuoka, Japan
Synopsis
The purpose of this study was to clarify whether gadoxetic acid concentration in the hepatic focal area at hepatobiliary phase (CHep), normalized by dose (normalized CHep), could be used as an index for quantitative liver function assessment. In severe liver dysfunction, a moderate correlation was observed between gadoxetic acid concentration and dose. Normalized CHep with bias correction based on the dose of gadoxetic acid may be used as an index of liver function, especially in the stratification of severe liver dysfunction.
INTRODUCTION
Liver function assessment is of great significance for the diagnosis of preoperative liver reserve. The indocyanine green test has been used to evaluate liver function in clinical practice. However, it cannot accurately predict liver reserve in the presence of partial liver decompensation1. Therefore, it is necessary to establish a morphology-based liver function assessment method. Gadoxetic acid-enhanced magnetic resonance imaging (MRI) has been proposed as a method to evaluate liver function2–4. Gadoxetic acid is a hepatocyte-specific contrast agent used for liver MRI. The T1 value of the liver in the hepatobiliary phase shortens with higher concentration of gadoxetic acid. Because the uptake of gadoxetic acid by hepatocytes is related to its function, previous studies have reported that the rate of reduction in T1 values of the liver (T1 reduction rate) after the administration of gadoxetic acid is a valuable biomarker of liver function3,4. However, in severe liver dysfunction, it is challenging to accurately assess liver function using the T1 reduction rate. Motosugi et al. reported that the signal intensity of the liver in the hepatobiliary phase in patients with severe liver function abnormalities increased with larger doses of gadoxetic acid, and that the concentration of the contrast agent in the hepatic focal area was dependent on the administered dose of gadoxetic acid5. Therefore, the uptake of gadoxetic acid by hepatocytes may depend not only on liver function, but also on its dose. We hypothesized that bias correction by administration dose of gadoxetic acid can improve the accuracy of stratification of liver function. The purpose of our study was to clarify whether the dose-normalized gadoxetic acid concentration could be an index of local liver function.METHODS
Forty-two patients who underwent gadoxetic acid-enhanced MRI using a 3.0 T MRI scanner (Ingenia, Philips Healthcare, Best, The Netherlands) were enrolled in this study (mean age, 67.3 years; age range, 26–85 years). They were allocated to groups according to their Child-Pugh classification scores. There were 13 patients with normal liver function (NLF), 18 categorized with Child-Pugh A (CPA), 8 with Child-Pugh B (CPB), and 3 with Child-Pugh C (CPC). A 3D phase-sensitive inversion recovery (PSIR) sequence was performed before and 15 min after the injection of gadoxetic acid. The T1 values of the liver were calculated on a pixel-by-pixel basis using the signal intensities observed in the PSIR and reference images obtained from the imaging, as previously reported. The following formula was used to calculate the T1 reduction rate, gadoxetic acid concentration in the hepatic focal area at hepatobiliary phase (CHep), and normalized CHep:T1 reduction rate (in %) = (T1pre-T1post) × 100/T1pre
CHep = (1/r1) × (1/T1post-1/T1pre)
where r1 represents the relaxivity of gadoxetic acid in hepatocytes at 3.0 T
Normalized CHep = CHep/Dose
where ”Dose” represents the dose of gadoxetic acid
The Steel-Dwass test was used to compare the differences in the T1 reduction rate, CHep, and normalized CHep between the NLF, CPA, and CPB+CPC groups. The Spearman rank correlation analysis was performed to assess the correlation coefficients between each index and the biochemical data (the total bilirubin, albumin, and Child-Pugh score) and between CHep and dose. Receiver operating characteristic (ROC) analysis was used to evaluate the discrimination of each index between the NLF+CPA and CPB+CPC groups.
RESULTS
Figure 1 shows the representative quantitative images of T1 reduction rate, CHep, and normalized CHep for NLF, CPA, CPB+CPC, respectively. The T1 reduction rate and CHep showed statistically significant differences between the NLF and CPA groups and between the NLF and CPB+CPC groups (P < 0.05), but not between the CPA and CPB+CPC groups (P > 0.05). Normalized CHep showed statistically significant differences between all groups (P < 0.05)(Fig. 2). Normalized CHep was moderately correlated with the biochemical data (Table 1). The area under the ROC curves of T1 reduction rate, CHep, and normalized CHep were 0.81, 0.81, and 0.87, respectively (Table 2, Fig. 3). The CHep showed no correlation with the dose of gadoxetic acid in the NLF and CPA groups and moderate correlation in the CPB+CPC group.DISCUSSION
We showed that normalized CHep could be accurately assessed for liver function with a severe stage. In the CPB+CPC group, there was a moderate correlation between the dose and gadoxetic acid concentration. The concentration of gadoxetic acid in the liver may be overestimated because of the additional residual gadoxetic acid in the extracellular space due to severe liver dysfunction. Therefore, bias correction based on the administration dose of gadoxetic acid may be effective, especially in stratifying patients with severe liver dysfunction.CONCLUSION
The use of normalized CHep allows for the accurate assessment of severe liver dysfunction.Acknowledgements
No acknowledgement found.
References
- Yamada A, Hara T, Li F, et al. Quantitative evaluation of liver function with use of gadoxetate disodium-enhanced MR imaging. Radiology. 2011;260(3):727–733.
- Tamada T, Ito K, Higaki A, et al. Gd-EOB-DTPA-enhanced MR imaging: Evaluation of hepatic enhancement effects in normal and cirrhotic livers. Eur J Radiol. 2011;80(3):311–316.
- Haimerl M, Verloh N, Zeman F, et al. Assessment of clinical signs of liver cirrhosis using T1 mapping on Gd-EOB-DTPA-enhanced 3T MRI. PLoS One. 2013;8(12).
- Kamimura K, Fukukura Y, Yoneyama T, et al. Quantitative evaluation of liver function with T1 relaxation time index on Gd-EOB-DTPA-enhanced MRI: Comparison with signal intensity-based indices. J Magn Reson Imaging. 2014;40(4):884–889.
- Motosugi U, Ichikawa T, Sano K, et al. Double-dose gadoxetic acid-enhanced magnetic resonance imaging in patients with chronic liver disease. Invest Radiol. 2011;46(2):141–145.
Figures
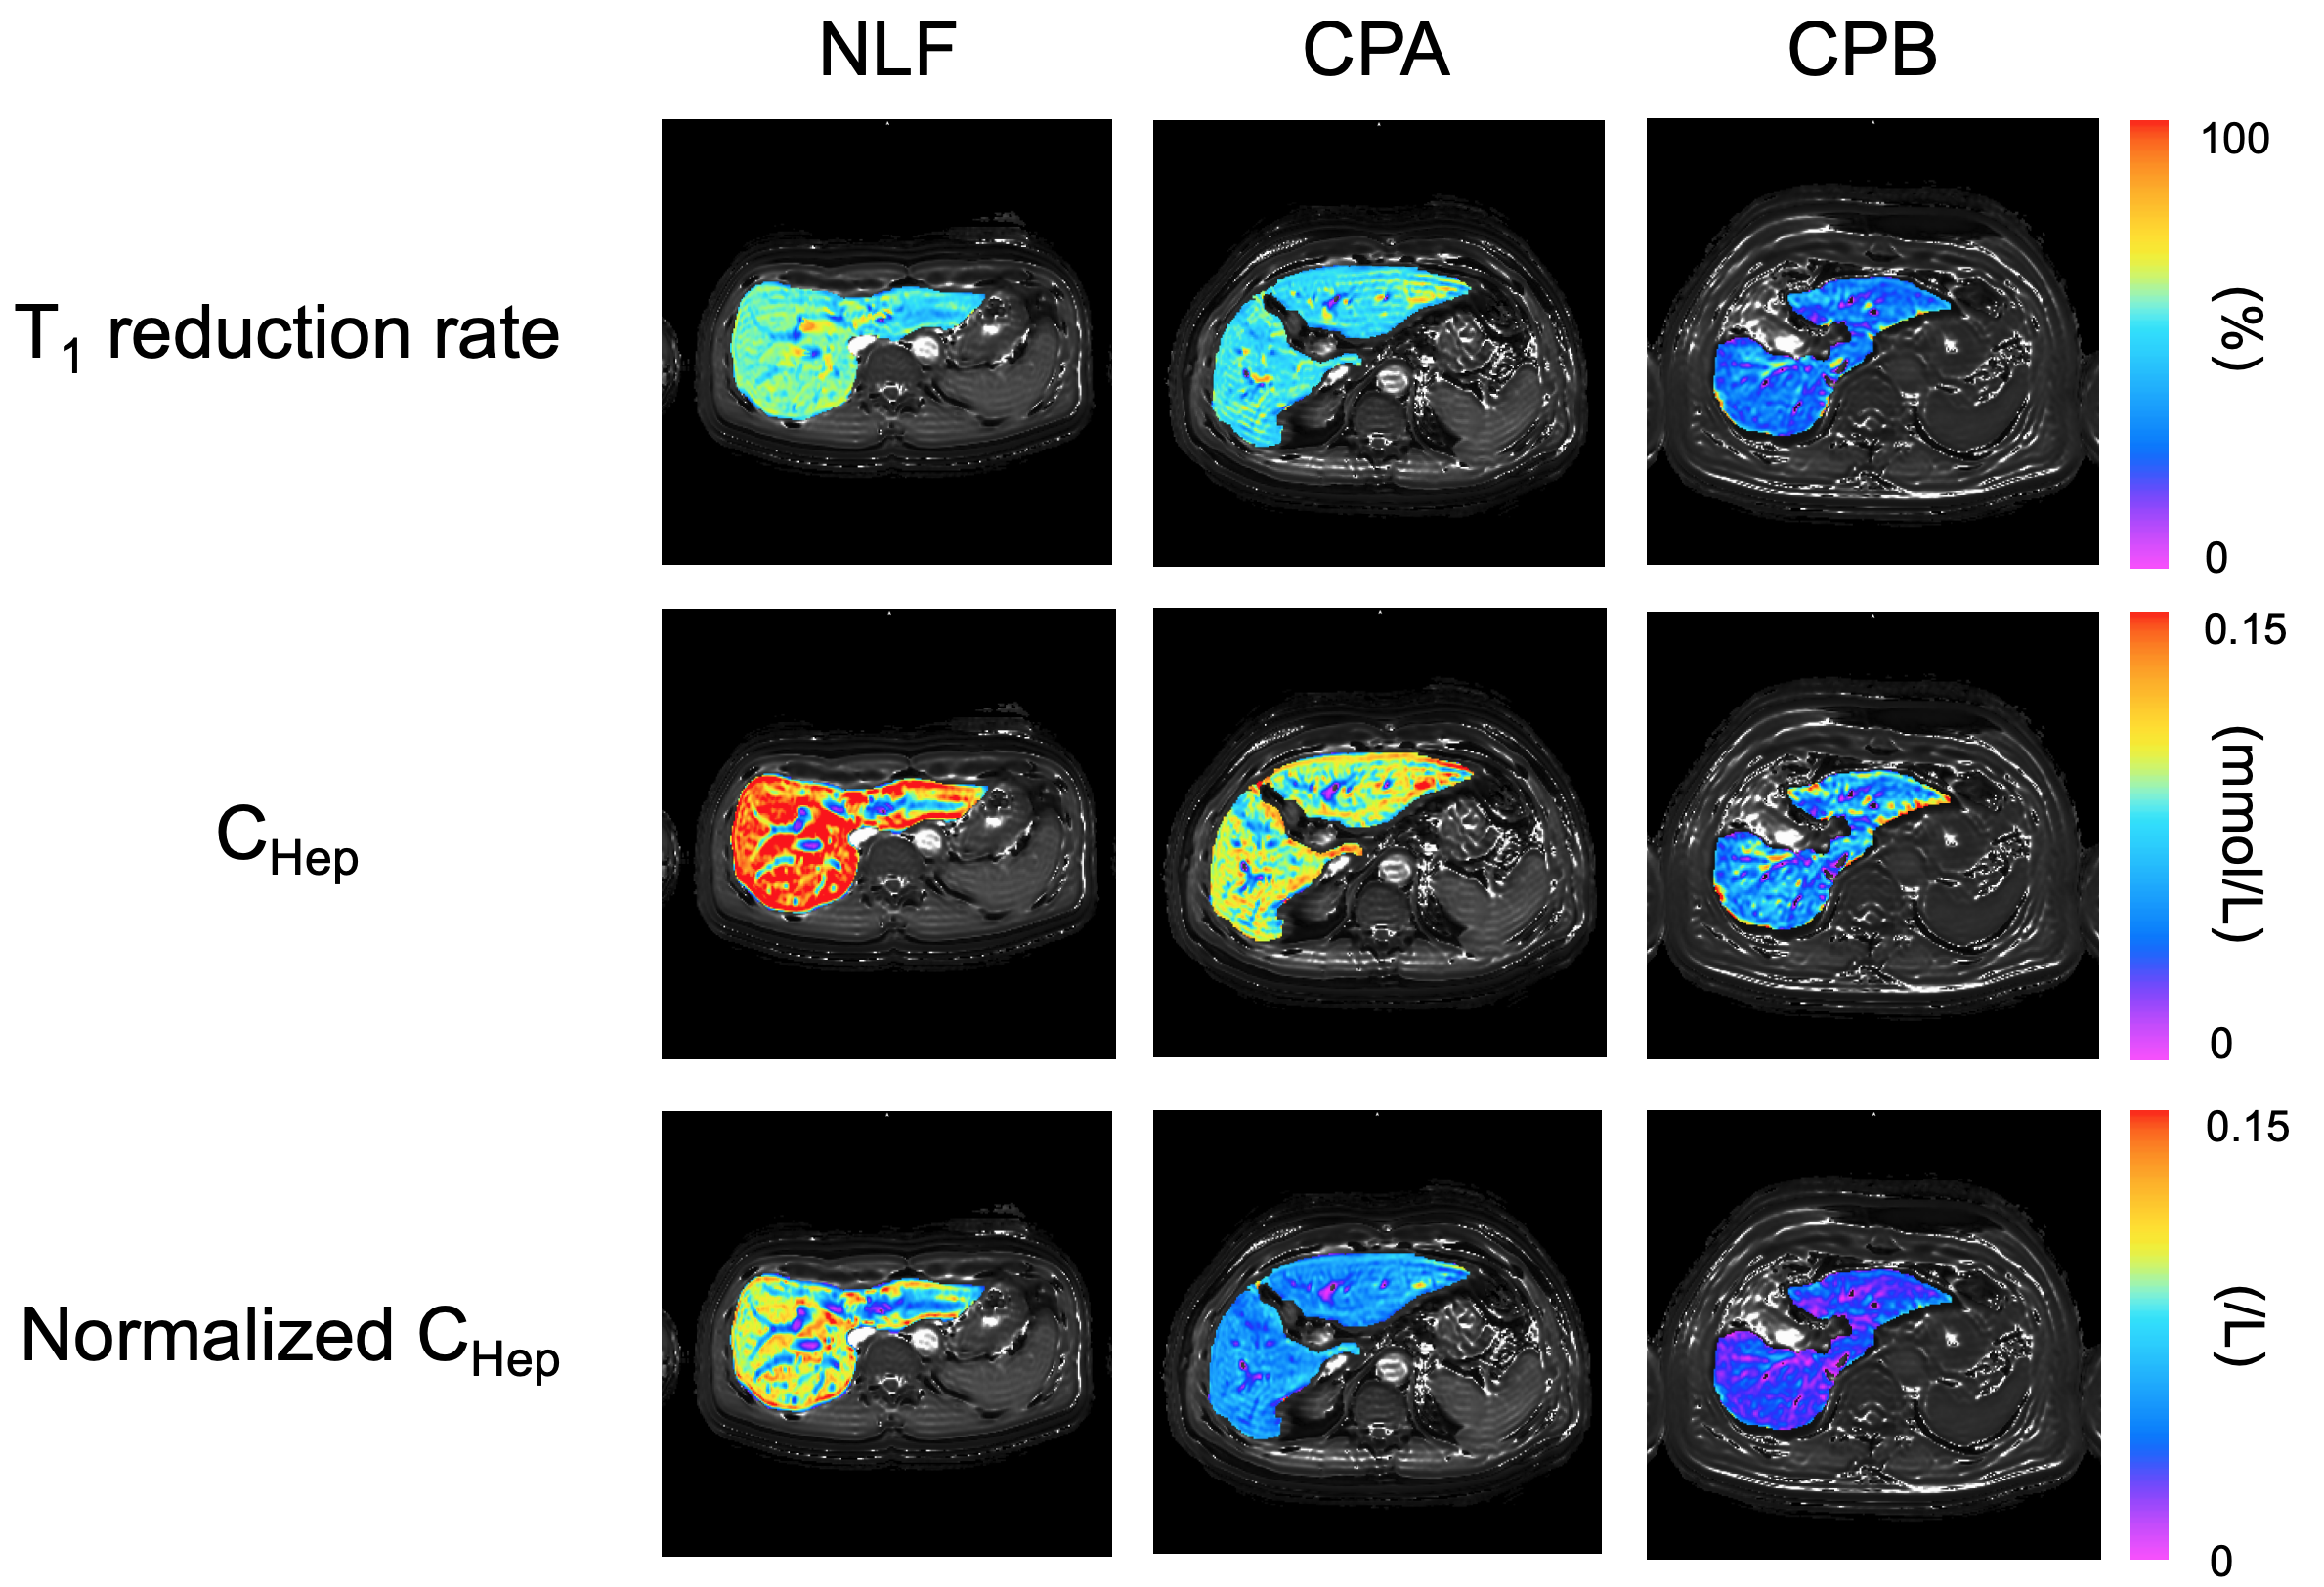
Figure 1
Representative quantitative images of T1 reduction rate, CHep, and Normalized CHep for normal liver function (NLF), Child-Pugh A (CPA), and Child-Pugh B (CPB), respectively.
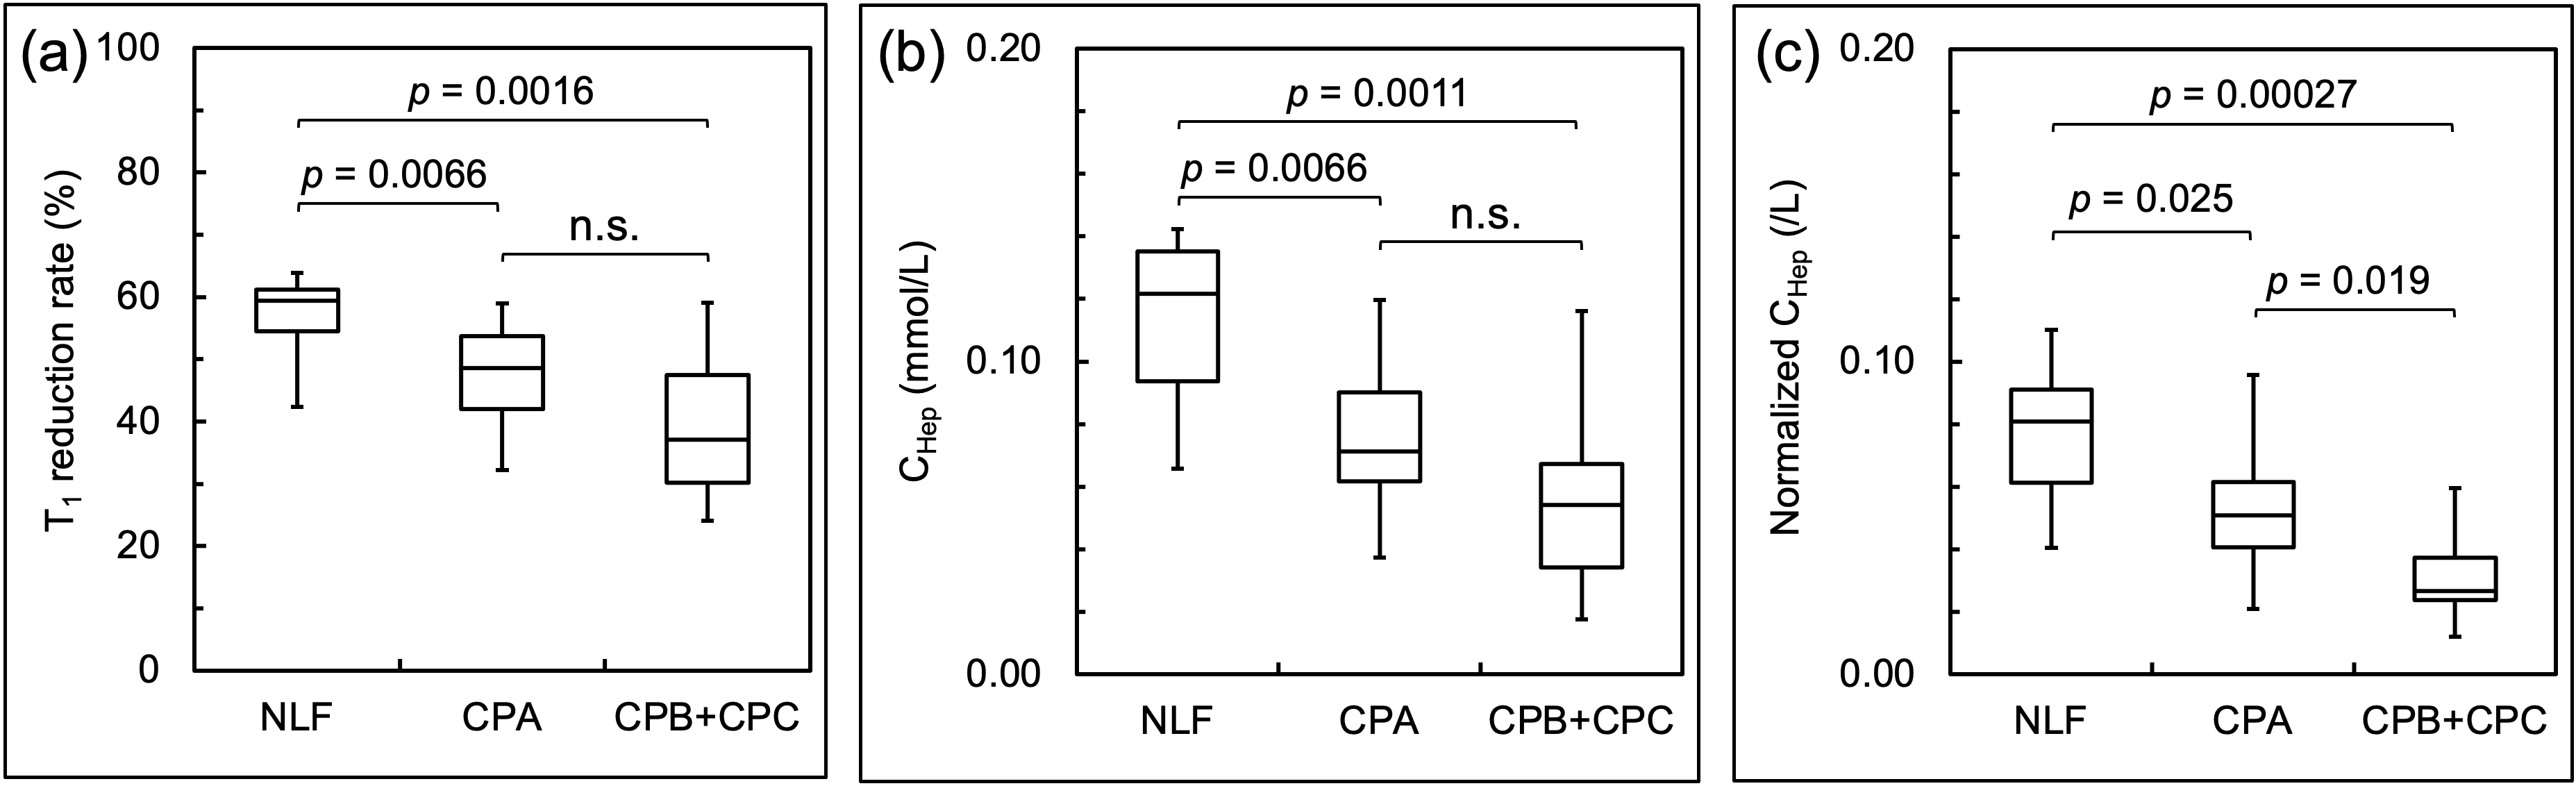
Figure 2
Box plots showing (a) T1 reduction rate, (b) CHep, (c) Normalized CHep in patients with normal liver function (NLF), Child-Pugh A (CPA), and Child-Pugh B + Child-Pugh C (CPB+CPC) groups.

Table 1
Spearman correlation coefficient of T1 reduction rate, CHep, Normalized CHep with biochemical data.
CHep, gadoxetic acid concentration in the hepatic focal area at hepatobiliary phase
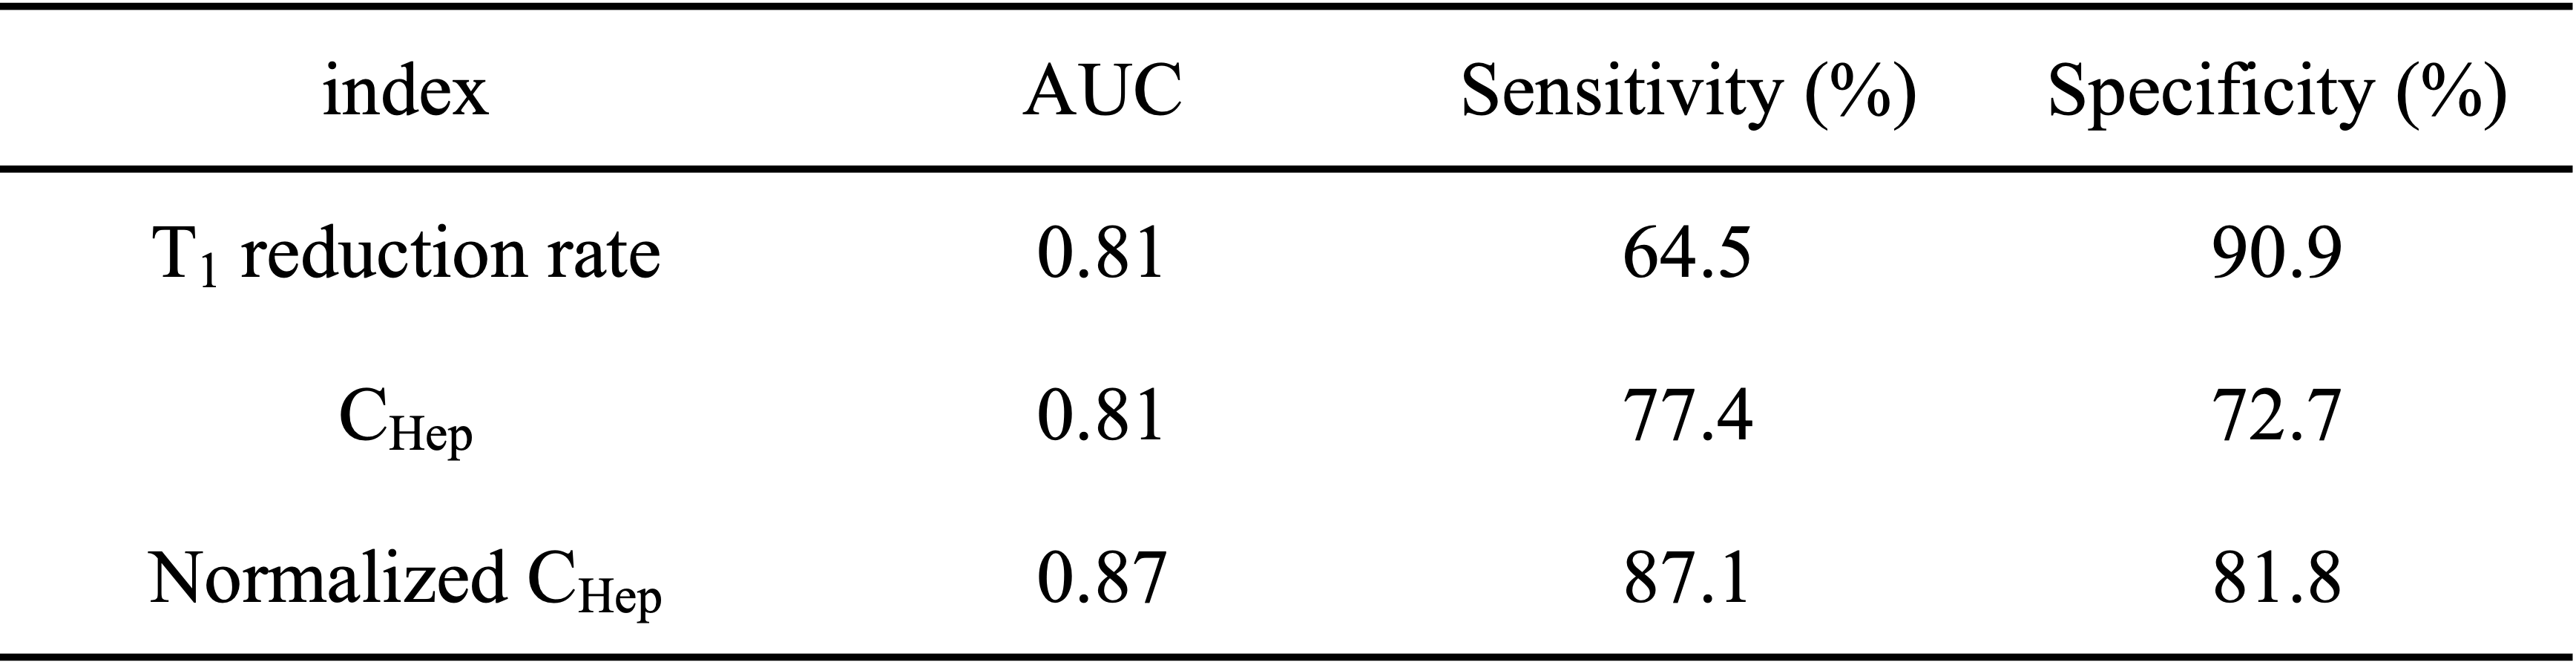
Table 2
Comparison of the area under the ROC curves of each index to evaluate the discrimination between NLF+CPA and CPB+CPC groups.
ROC, receiver operating characteristic; NLF, normal liver function; CPA, Child-Pugh A; CPB, Child-Pugh B; CPC, Child-Pugh C; AUC, area under the ROC curve; CHep, gadoxetic acid concentration in the hepatic focal area at hepatobiliary phase
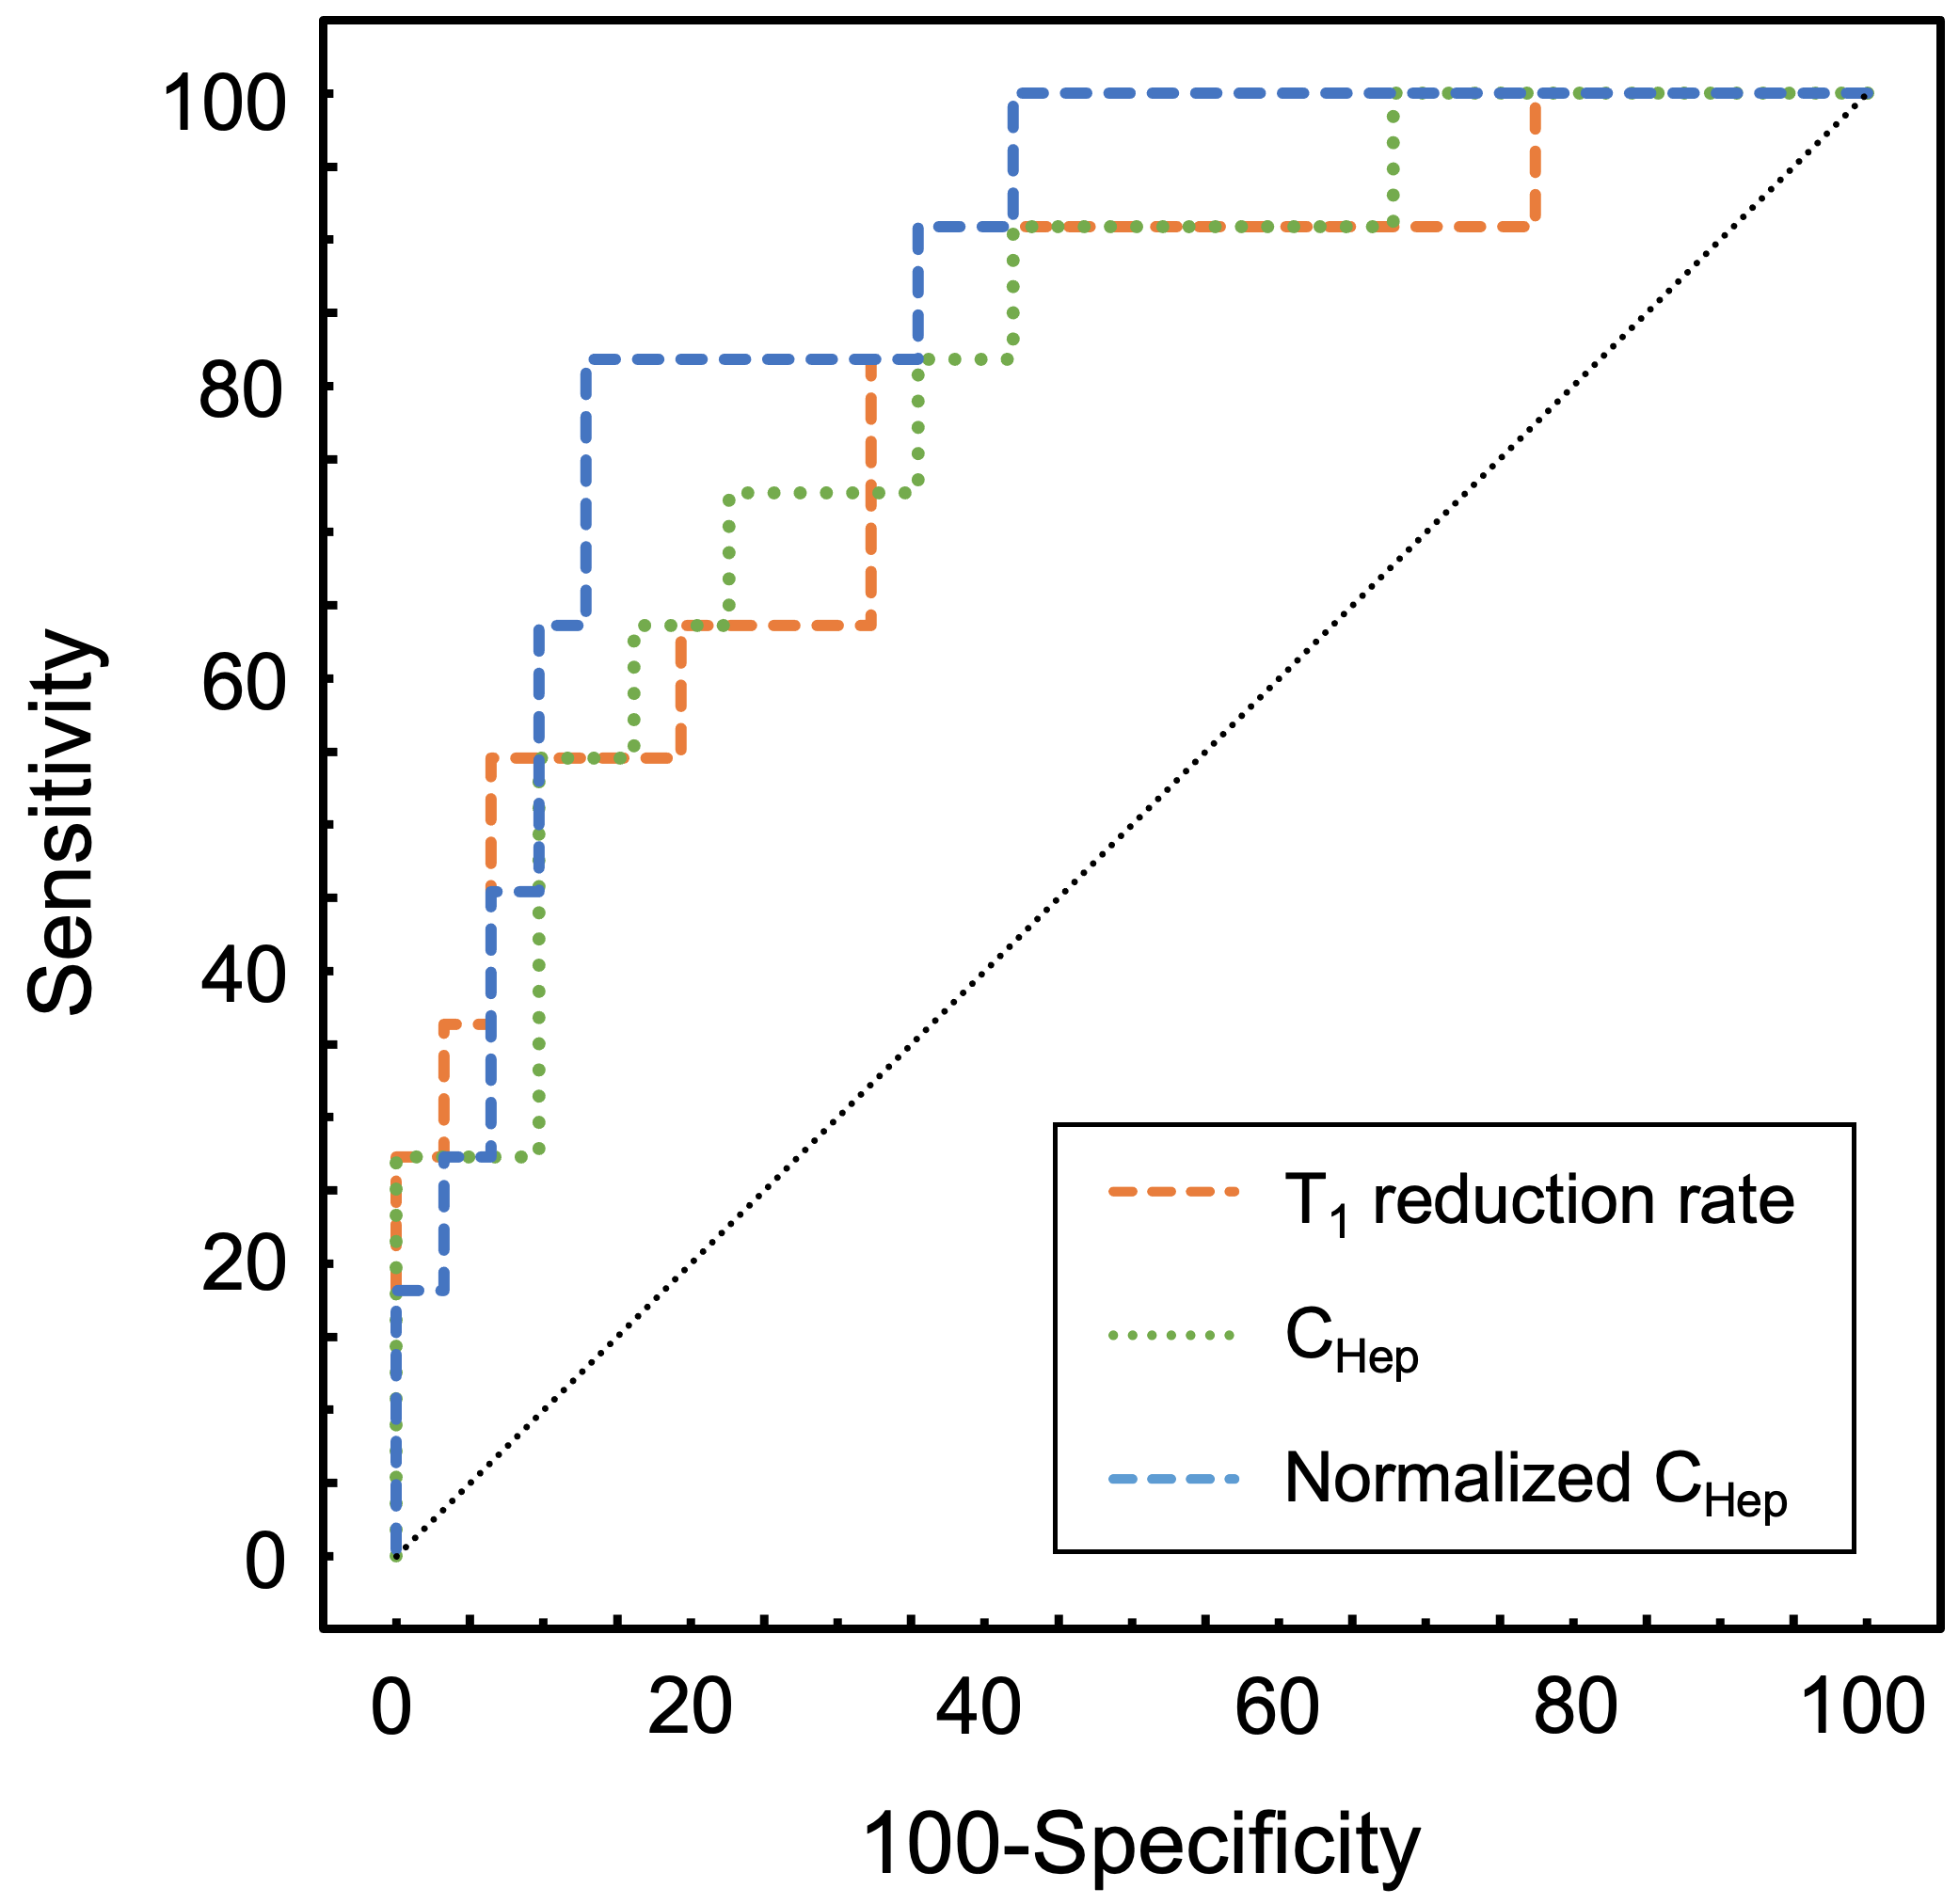
Figure 3
Receiver operating characteristic curves for discriminating normal liver function + Child-Pugh A group from Child-Pugh B + Child-Pugh C group in T1 reduction rate, CHep, and normalized CHep.