4259
The ultrashort echo time (UTE) sequence quantifies high liver iron more accurately than the multiecho gradient-recalled echo (GRE).1Lomonosov Moscow State Univesity, Moscow, Russian Federation, 2Dmitry Rogachev National Research Center of Pediatric Hematology, Oncology and Immunology, Moscow, Russian Federation, 3Philips Healthcare, Moscow, Russian Federation, 4National Research Nuclear University MEPhI (Moscow Engineering Physics Institute), Moscow, Russian Federation
Synopsis
The most common MRI sequence for iron overload assessment is Cartesian multiecho gradient-recalled echo (GRE) sequence typically measured in a single breath-hold. However, Breath-holding, is not possible for people who are sedated and is difficult for those who have difficulties with holding their breath for a long period. Ultrashort TE (UTE) imaging is one of the solutions for this challenge. In this method radial data acquisition utilized for free breath scanning. Thus, the main goal of this study is to compare the GRE and UTE sequences on a sample of patients with varying degrees of liver iron overload.
Introduction
Patients with inherited hemochromatosis and those other blood problems that necessitate frequent transfusions, frequently have condition called iron liver overload. Iron liver overload is the pathological condition in which extra iron build up in organs and tissues, mainly in liver. For a long time, the only way to determine the severity of liver iron overload was to do a biopsy [1]. However, a non-invasive MRI approach for detecting liver overload using T2* values has gained popularity recently [2]. This method based on T2* mapping, because T2* values strongly depend on magnetic susceptibility which changes in iron overload tissues. The most common MRI sequence for iron overload assessment is Cartesian multiecho gradient-recalled echo (GRE) [3] sequence typically measured in a single breath-hold. Breath-holding, on the other hand, is not possible for people who are sedated and is difficult for those who have difficulties with holding their breath for a long period. Breathing problems might result in poor image quality due to respiratory motion abnormalities. Ultrashort TE (UTE)[4] imaging is one of the solutions for this challenge. In this method radial data acquisition utilized for free breath scanning. Therefore, this technique is increasingly being used in MRI assessment of iron overload.However, at the moment, an urgent task is to assess the effectiveness of both messages at different grades of liver iron overload. Thus, the main goal of this study is to compare the GRE and UTE sequences on a sample of patients with varying degrees of liver iron overload.
Materials and methods
57 patients with liver iron overload were retrospectively examined on MRI Philips Achieva dStream 3.0T MRI scanner (Philips Healthcare, The Best, The Netherlands). We had 27 patients with 1-2 grade of iron overload (T2* = 4…20 ms), 19 with 3 grade (T2* = 2…4 ms) and 8 with 4 grade (T2* = 0…2ms).The parameters of the uTE sequence were as follows: Flip Angle = 15 °, 12 echoes, TR≈22 ms, TE = 0.22 ms , ΔTE≈0.9 ms and voxel size 2.5mmx2.5mmx6mm. The parameters of the mGRE sequence were: Flip Angle = 45 °, 20 echoes, TR≈350 ms, TE = 1.06 ms, ΔTE≈1.1 ms and a voxel size of 1.5mmx1.5mmx7mm.
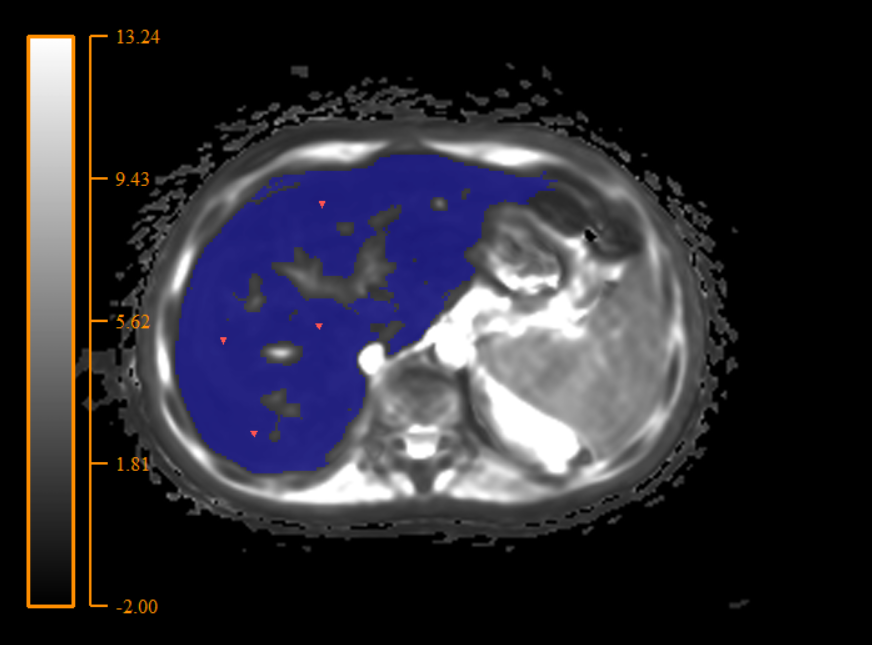
For T2* mapping assessment we used home-made script, which generates liver 3-D mask on T2* map and provide average T2* value and standard deviation (STD) of T2* (Figure 1). For next statistical analisis we used variation coefficient (VC) (VC= (STD/mean)*100, %). We also calculated iron concentrations, using conversion formula from our previous investigation [4].
Shapiro-Wilk normality test and Wilcoxon matched-pairs signed rank test in GraphPad Prism 8.4.3 (GraphPad Software, San Diego) software was used to investigate differences between STD of T2* values in two methods UTE and GRE. Also we used Spearman criteria for testing correlation between iron concentration and VC.
Results
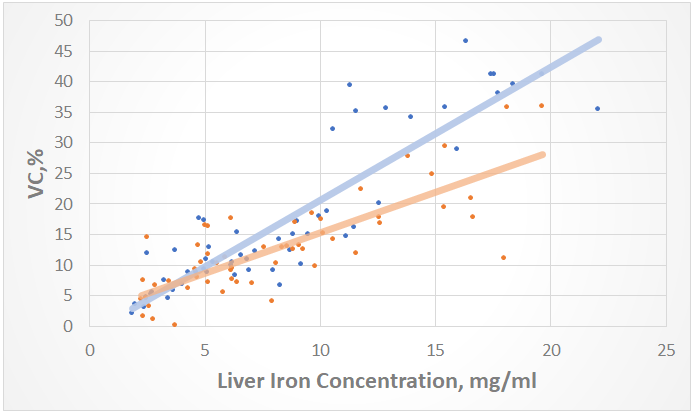
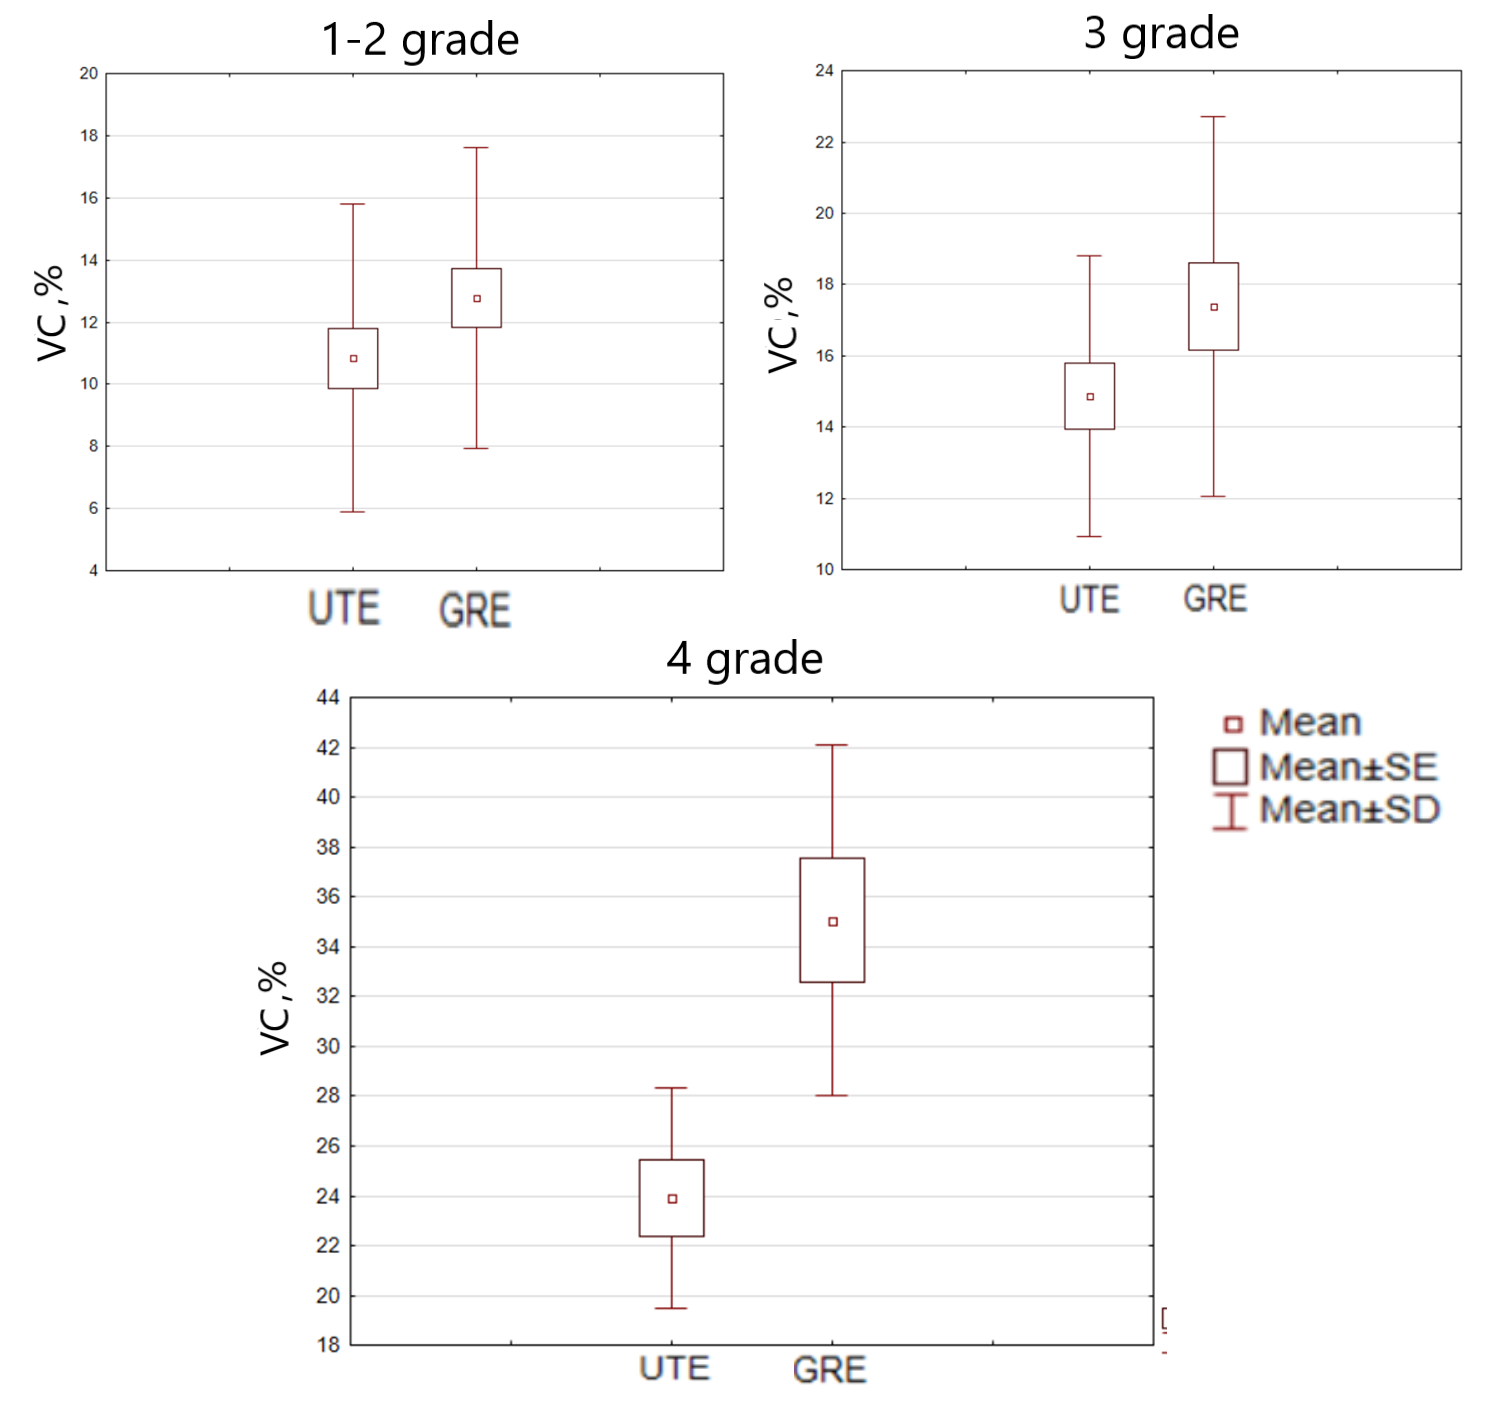
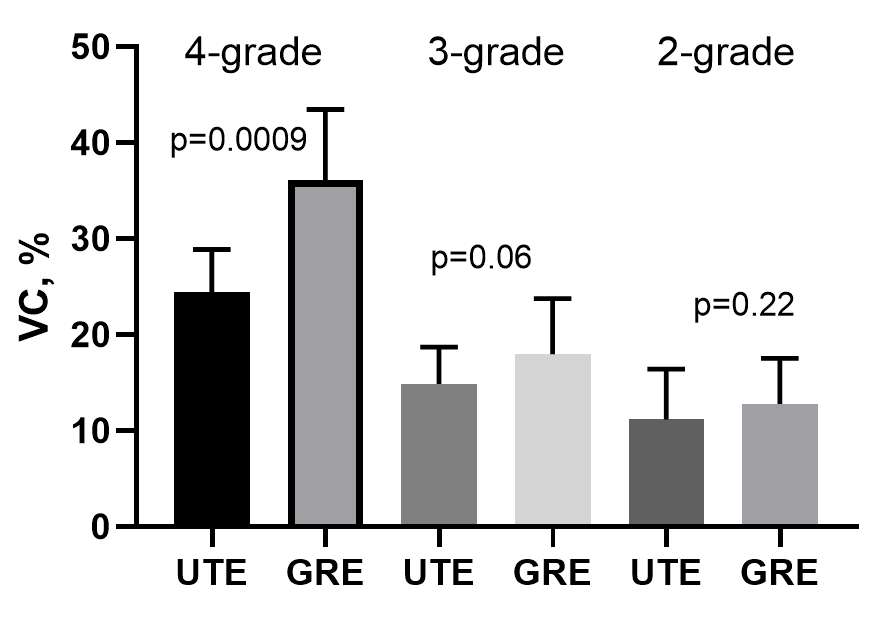
Mean VC values for GRE were: 1-2 grade – 12.8%, 3 grade 17.3%, 4 grade 35.2% ; for UTE were: 1-2 grade – 10.8%, 3 grade: 14.8%, 4 grade – 23.7%. VC have a strong correlation with T2* and, consequently, iron concentration (Figure 2). As a result, a significant decrease (p<0.001) in VC was obtained in the UTE T2* maps in comparison with the GRE in the 4-th grade (the highest iron concentrations). At lower grades (1-3 grades), the methodologies did not show significant changes in VC, however, UTE also had a trend for better VC (p = 0.06) (Figure 3 and Figure 4). In T2 * values, no significant changes were found in any of the grades.Discussion
The observed increase in VC with an increase in the concentration of iron in the liver and a decrease in T2 * is associated with the growing influence of inhomogeneities in the magnetic field created by the iron oxide in the liver. As a result, additional artifacts appear. Also a key factor is the number of images with different TEs, which have signal intensities other than zero. With decreasing T2 *, this number of these “nonzero” images also decreases (sometimes up to 2-3). The effectiveness of the UTE at high concentrations can be explained by the significantly lower first echo time available in UTE sequence compared to GRE. Due to this, a larger number of images at different TEs remains “nonzero”, this greatly improves the accuracy of building a T2 * map. However, as was shown, this does not play a significant role at low iron concentrations, since most of the images at different TE times are “nonzero” both in UTE and in GRE.Conclusion
UTE sequence has a significant convenience, since due to the radial data collection it allows scanning with free breathing, which not only simplifies the scanning of sedated patients, but also reduces the scanning time. Also, the undoubted advantage of UTE is that it is possible to measure higher concentrations of iron. Thus, the UTE sequence has undeniable advantages over GRE and can be recommended for use for the non-invasive assessment of liver iron overload.Acknowledgements
No acknowledgement found.References
1. C.W. Siah, D. Trinder, J.K. Olynyk, Iron overload, Clin. Chim. Acta. 358 (2005) 24–36. https://doi.org/10.1016/j.cccn.2005.02.022.
2. A.C. Wortmann, P.E. Froehlich, R.B. Pinto, R.B. Magalhães, M.R. Álvares-Da-Silva, J.J. Ferreira, T.R. Silveira, Hepatic iron quantification by atomic absorption spectrophotometry: Full validation of an analytical method using a fast sample preparation, Spectroscopy. 21 (2007) 161–167. https://doi.org/10.1155/2007/761029.
3. M.Y. Tang, T.W. Chen, X.M. Zhang, X.H. Huang, GRE T2∗-weighted MRI: principles and clinical applications, Biomed Res. Int. 2014 (2014). https://doi.org/10.1155/2014/312142.
4. Y. Kee, C.M. Sandino, A.B. Syed, J.Y. Cheng, A. Shimakawa, T.J. Colgan, D. Hernando, S.S. Vasanawala, Free-breathing mapping of hepatic iron overload in children using 3D multi-echo UTE cones MRI, Magn. Reson. Med. 85 (2021) 2608–2621. https://doi.org/10.1002/MRM.28610.
5. E.E. Nazarova, D.A. Kupriyanov, G.A. Novichkova, G. V. Tereshchenko, Noninvasive assessment of iron overload by magnetic resonance imaging, Pediatr. Hematol. Immunopathol. 19 (2020) 158–163. https://doi.org/10.24287/1726-1708-2020-19-3-158-163.
Figures