4257
Water specific T1 mapping for characterization of inflammation grades at early stage in Rats with Non-alcoholic fatty liver disease (NAFLD)1Shenzhen Institutes of Advanced Technology, Chinese Academy of Sciences, Shenzhen, China, 2Peking University People's Hospital, Beijing, China
Synopsis
Detection of inflammation is important to the NAFLD patients. Liver biopsy is limited by the sampling error. T1 quantification from MRI is believed to be one of promising imaging method to detect inflammation. However, intracellular hepatocyte lipid is a confounding factor for the accurate T1 quantitation in the case of the NAFLD. This study established a variable flip-angle multi-echo GRE sequence to produce the T1 value of water component (wT1) in a NAFLD rat model who underwent biopsy. The results indicate that wT1 could discriminate between moderate and severe inflammation stages (G2 +G3) from the no and mild stages (G0+G1).
Introduction
Non-alcoholic fatty liver disease (NAFLD) spectrum ranges from simple steatosis to a more serious subtype steatohepatitis (NASH) with lobular inflammation as the principal character1. Inflammation is associated with the progression of liver fibrosis. Therefore, detection of inflammation is of vital significance to the management of NAFLD patients. Liver biopsy is limited by the subjective scoring and sampling error. T1 relaxation time derived from magnetic resonance imaging (MRI) is believed to be the most promising method due to its non-invasiveness2. However, intracellular hepatocyte lipid is a confounding factor for the accurate T1 quantitation in the case of the NAFLD3. Several research groups recently proposed to combine the chemical shift encoded imaging with a variable flip-angle multi-echo GRE (VFA-GRE) sequence to produce the T1 value of water component (wT1) to address the interference of fat signal to the T1 quantification4. Meanwhile, the fat fraction and T2* could be obtained simultaneously from the same sequence for steatosis grading and iron detection in NAFLD Patients. This study aimed to evaluate the ability of the wT1 in detecting inflammation stage using liver histology as the reference standard within a methionine-choline-deficient (MCD) diet-induced NAFLD model in rat.Methods
Animal ModelThis study was approved by the Ethical Committee on Animal Experiments in Shenzhen Institutes of Advanced Technology. A total of 80 male Wistar rats were fed with either a standard chow ad libitum (Control) or a methionine-choline-deficient (MCD) diet (Research Diets Inc., A02082002BR) randomly. Ultimately, 15 controls and 61 MCD rats were included in the study.
MRI Examination
MRI was performed on a 3.0 T clinical MR scanner (uMR790, Shanghai United imaging healthcare, Shanghai, China) using a twelve-channel rat coil. Rats were anesthetized with isoflurane. All images were obtained with free breathing. The MRI examinations included VFA-GRE and Dual Refocusing Echo Acquisition Mode (DREAM) B1 mapping sequence. VFA-GRE parameters were: TR = 20.5 ms, TE = 3.45/4.92/6.39/7.86/9.33/10.8 ms, slice thickness = 2mm, slice number = 1, flip angle = 3°/7°/11°/15°, bandwidth = 900 Hz/pixel, field of view (FOV) = 80 × 60 mm, matrix =128×96. Ten averages were implemented to improve the imaging SNR. The acquisition time of VFA-GRE was 1 minute. DREAM parameters: TR = 6.9 ms, TE = 2.24 ms, slice thickness = 5 mm, slice number = 1, bandwidth = 600 Hz/pixel. The acquisition time of DREAM was 0.2 s.
MR Data processing
Multiple-echo images were reconstructed, and eddy-current was corrected before the application of fat-water separation algorithm to remove the phase inconsistency between odd and even echoes. The PDFF was simultaneously quantified by TREE algorithm with the 6-peak fat model described by Yu et al5. After fat-water separation, water images under different flip angles were applied to calculate the longitudinal relaxation times for the water components:
$$W_{\theta}=M_{w}\frac{1-e^{-TR/T_{1w}}}{1-e^{-TR/T_{1w}}\cdot cos{\theta}}\cdot sin{\theta}$$
where θ is the flip angle, and Wθ is the signal intensity of the water components under the corresponding flip angle. The wT1 was derived by fitting the water signals under multiple flip angles to this model.
The B1 transmit field was estimated by a DREAM sequence. The original θ was replaced by B_1 θ so that the B1 inhomogeneity was considered.
Pathological analysis
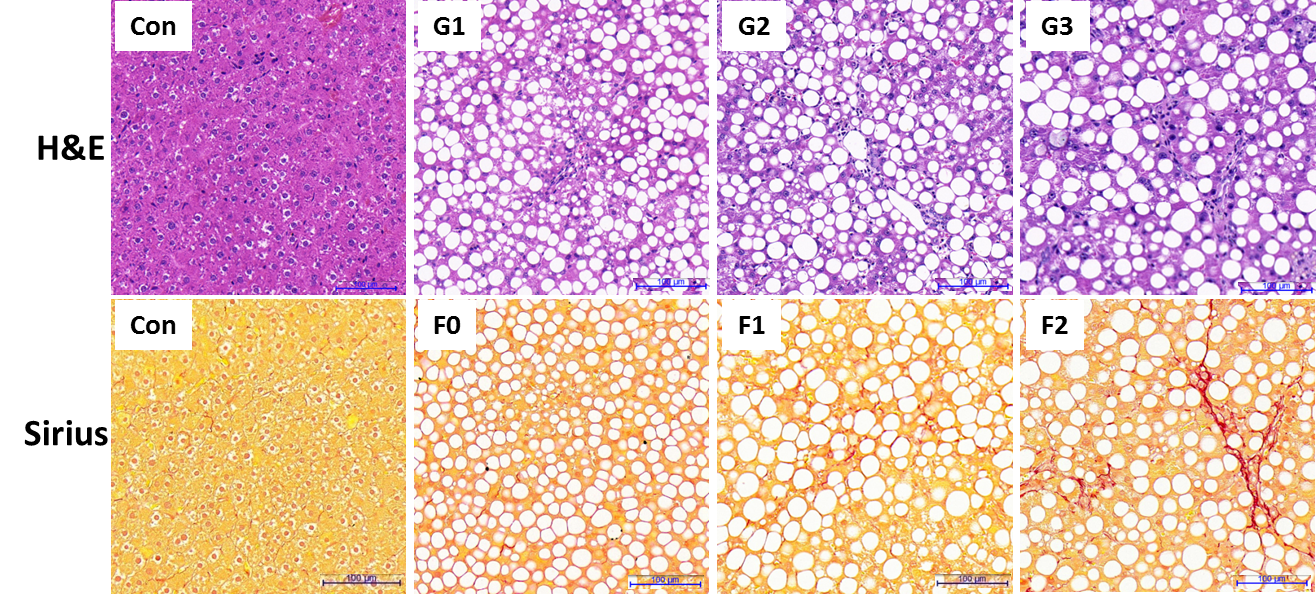
All pathologic specimens underwent a systematic liver biopsy evaluation that was scored using the NAFLD Clinical Research Network (NASH-CRN) histological scoring system6. Inflammation grade (G) was scored on a 4-point ordinal scale (0-3): (G0 = none, no foci; G1 = mild, < 2 foci/20x hpf; G2 = moderate, 2-4 foci/20x hpf; and G3 = severe, > 4 foci/20x hpf). The fibrosis stage (F) was evaluated as follows: F0, no fibrosis; F1, perisinusoidal or periportal; F2, perisinusoidal and periportal fibrosis; F3, bridging fibrosis.
Results
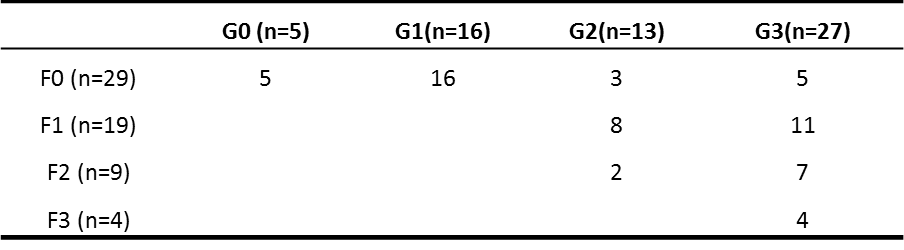
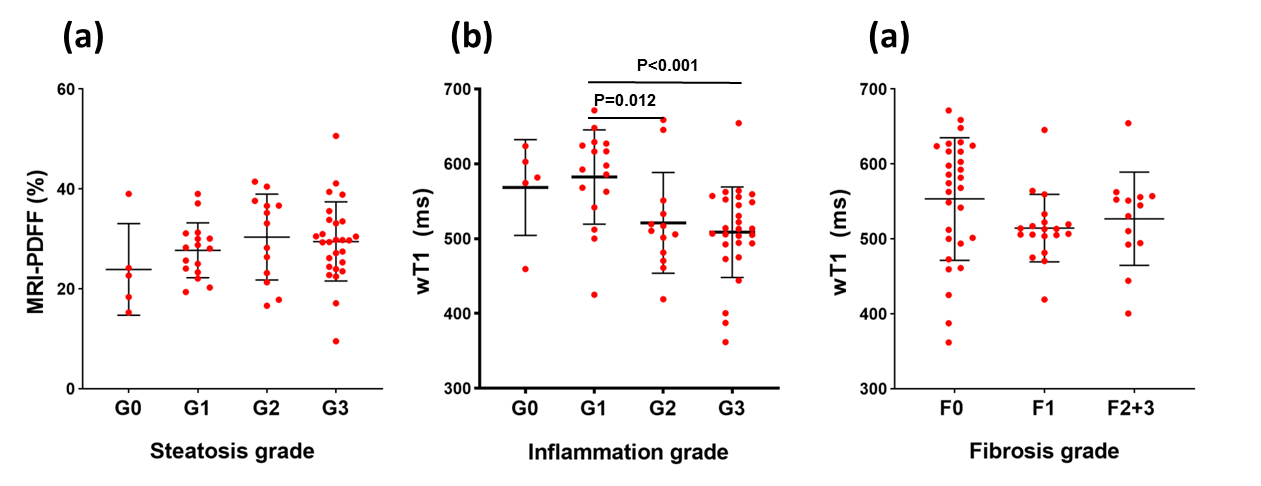
The histopathological results are presented in the figure 1 and table 1.Representative PDFF and wT1 maps are shown in figure 2, and table 2 showed the corresponding value. The difference in PDFF were not observed among NAFLD rats with different grades of inflammation (G0-G3) (p>0.05) (figure 3a). Compared with G1, the wT1 significantly decreased in rats with G2 (p=0.012) and G3 (p<0.001). However, there was no significant difference in NAFLD rats with any stage of fibrosis (p>0.05) (figure 3c). A modestly (r = -0.42) negative correlation between liver inflammation and wT1 was also observed (p = 0.001). We found that the wT1 cut-off of 562.64 ms had a raw sensitivity of 90% (95%CI: 76% - 97%) and specificity of 76% (95%CI: 52% - 91%) for best distinguishing G0+G1 from G2+G3 (figure 4).Discussion and Conclusions
In this study, the wT1 in liver was measured from the VFA-GRE with B1+ correction. The results showed a negative correlation to the inflammation severity in the NAFLD model. The reason for wT1 reduction with inflammation scores might be induced by the liver pathophysiological alterations characterized by cell swelling changes, inflammatory or hepatocyte necrosis. It is suggested that the wT1 could discriminate the moderate and severe inflammation stage (G2+G3) from none and mild stage (G0+G1), the observation offers the potential to monitor the inflammation progression in NAFLD patients.Acknowledgements
This work was supported by the National Natural Science Foundation of China (Grant No. 61901462, 82171904).References
1. Kleiner DE, Brunt EM, Wilson LA, et al. Association of Histologic Disease Activity With Progression of Nonalcoholic Fatty Liver Disease. JAMA Netw Open. 2019;2(10):e1912565.
2. Ding Y, Rao SX, Meng T, Chen C, Li R, Zeng MS. Usefulness of T1 mapping on Gd-EOB-DTPA-enhanced MR imaging in assessment of non-alcoholic fatty liver disease. European radiology. 2014;24(4):959-966.
3. Ahn JH, Yu JS, Park KS, et al. Effect of hepatic steatosis on native T1 mapping of 3T magnetic resonance imaging in the assessment of T1 values for patients with non-alcoholic fatty liver disease. Magnetic resonance imaging. 2021;80:1-8.
4. Thompson RB, Chow K, Mager D, Pagano JJ, Grenier J. Simultaneous proton density fat-fraction and R2∗ imaging with water-specific T(1) mapping (PROFIT(1) ): application in liver. Magn Reson Med. 2021;85(1):223-238.
5. Yu H, Shimakawa A, McKenzie CA, Brodsky E, Brittain JH, Reeder SB. Multiecho water-fat separation and simultaneous R2* estimation with multifrequency fat spectrum modeling. Magn Reson Med. 2008;60(5):1122-1134.
6. Kleiner DE, Brunt EM, Van Natta M, et al. Design and validation of a histological scoring system for nonalcoholic fatty liver disease. Hepatology. 2005;41(6):1313-1321.
Figures