4253
Application of Multi-Echo DIXON and HISTO quantitative techniques for staging of liver fibrosis in patients with chronic hepatitis B1Lanzhou University 2 Hospital, Lanzhou, China, 2MR Scientific Marketing, Siemens Healthineers, ShangHai, China
Synopsis
The purpose of this study was to evaluate the value of Multi-echo DIXON(6 echo) and HISTO techniques for staging of liver fibrosis in patients with chronic hepatitis B. We found that PDFF% value and R2* value had a certain correlation with liver fibrosis, Multi-echo DIXON and HISTO quantitative techniques may be helpful for staging liver fibrosis.
Introduction and purpose
Traditionally, the staging of liver fibrosis should be based on biopsy and/or transient elastography. However, to find an acknowledged noninvasive imaging methods for quantifying liver fibrosis is still a challenge. Many studies [1-3] have reported the correlation between steatosis, iron deposition and liver fibrosis, but the results were erratic, even contradiction. Recently, Multi-echo DIXON and HISTO quantitative MRI techniques have been introduced fast acquisition of proton density fat fraction (PDFF%) and R2* values respectively. Our study was aim to evaluate the potential and accuracy of the Six-Echo DIXON and HISTO techniques in staging of liver fibrosis.Materials and Methods
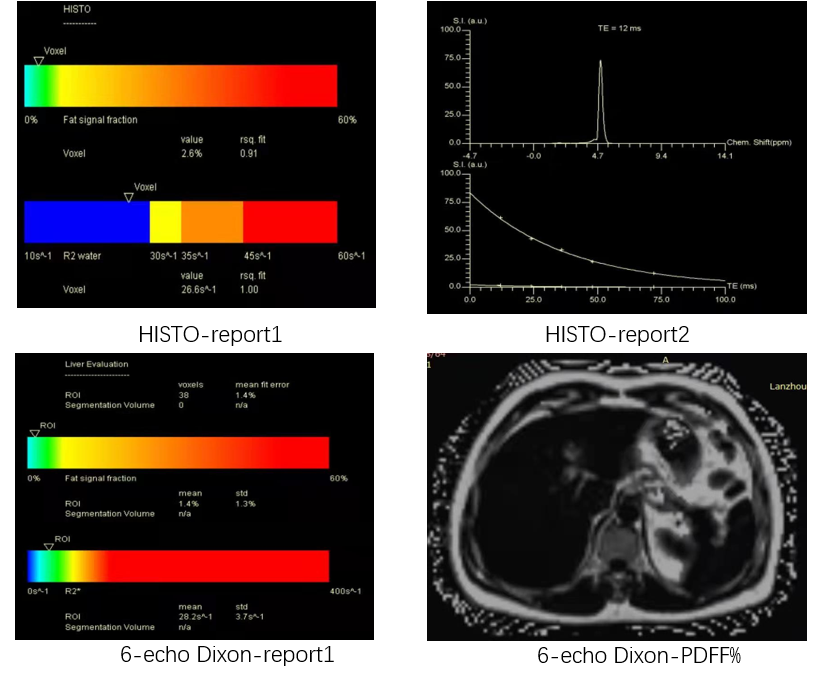
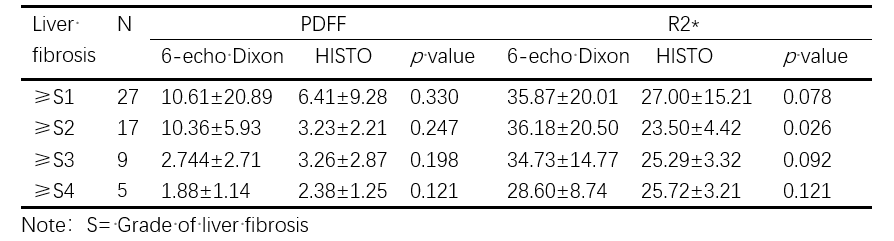
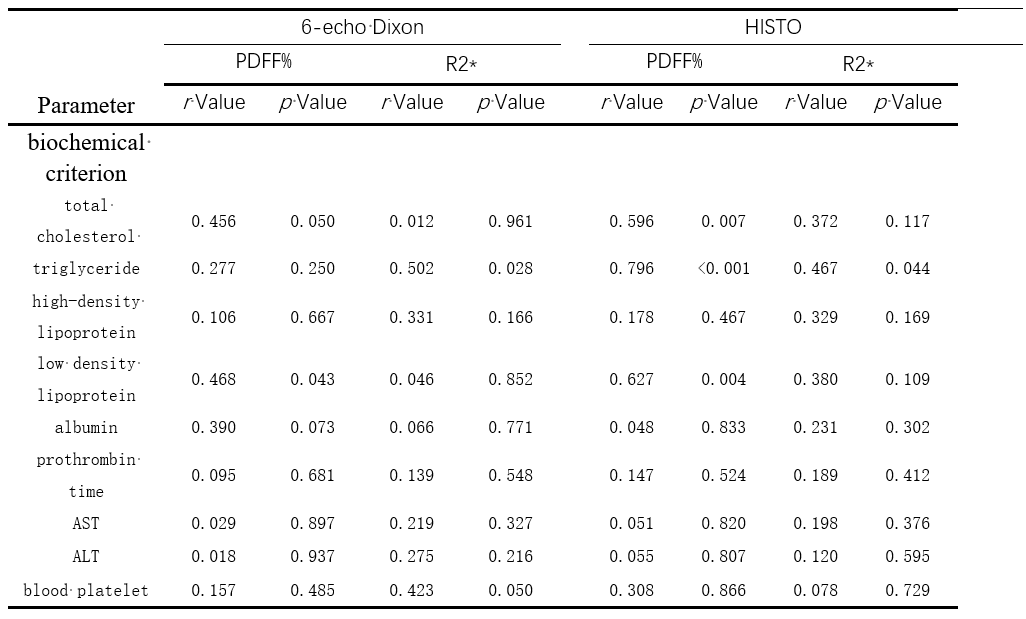
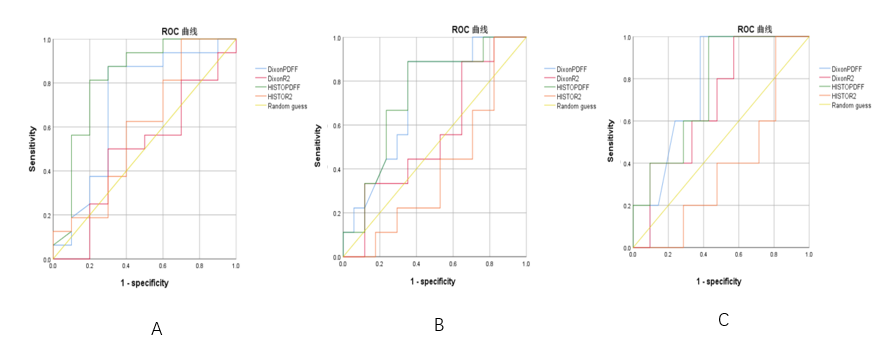
Twenty-seven patients with liver fibrosis were enrolled, which caused was hepatitis B. All the subjects underwent MR examinations on a 1.5T MR scanner (MAGNETOM Aera, Siemens Healthineers, Erlangen, Germany) using a combination of 18-channel body and 12-channel spine matrix coil elements. An axial 6-echo DIXON sequence was performed with the following parameters: TR/TE = 15.6/2.38ms; flip angle: 4 degrees, FOV = 450×394mm2; slice thickness = 3.5 mm, voxel size = 1.4×1.4×3.5mm3, number of slices = 64, acquisition time: 20s. HISTO sequence was performed with the following parameters: TR/TE =3000/12ms, flip angle: 90 degrees, VOI = 30 × 30 × 30mm3, acquisition time: 15s. The selected area of HISTO sequence is the right lobe of liver (hilar level), avoiding bile ducts and blood vessels. The ROI area of Dixon sequence shall be close to the selected area of HISTO sequence. All patients underwent needle biopsies and were assessed for fibrosis staging. Figure 1 shows an example image of the 6-echo Dixon sequence and HISTO sequence.Results
The mean and standard deviation (SD) of PDFF% and R2* values of Dixon and HISTO sequences in different grades of fibrosis were shown in Table 1. There was no difference between PDFF% values of Dixon and HISTO series, P>0.05. The correlation between PDFF% values of Dixon and HISTO sequences and clinical indicators was shown in Table 2. The quantitative value from 6-echo Dixon sequence was only correlated with one clinical indicator (triglycerides), and the correlation was low. The quantitative values from HISTO sequence were highly correlated with total cholesterol, triglyceride and low density lipoprotein. The AUC values of PDFF% from 6-echo Dixon series for identifying ≥S2, ≥S3 and ≥S4 were 0.67 0.70 and 0.74, respectively. The AUC values of R2* from 6-echo Dixon series for identifying ≥S2, ≥S3 and ≥S4 were 0.49 0.56 and 0.69, respectively. The AUC values of PDFF% from HISTO sequence for identifying ≥S2, ≥S3 and ≥S4 were 0.80 0.71 and 0.74, respectively. The AUC values of R2* from HISTO sequence for identifying ≥S2, ≥S3 and ≥S4 were 0.54 0.36 and 0.35, respectively (Figure 2).Discussion and conclusion
Progress of liver fibrosis process is a complex pathological change, which often accompanied by varying degrees of inflammatory reaction and hepatocyte fat necrosis. Although liver biopsy is the current reference standard for staging liver fibrosis, it has many limitations, such as invasive, sampling errors and a series of complications. In this study, we found that there was no statistical difference between HISTO sequence and 6-echo Dixon sequence in fat quantification, but the value measured by 6-echo Dixon sequence was relatively discrete, which may be caused by the inevitable error when fitting data. Therefore, there may be instability when measuring fat content. HISTO sequence used short TE STEAM stimulated echo sequence can make the separation of water lipid in the spectral signal clearer, so the value obtained is more accurate and stable. Secondly, we also found that liver fat content was negatively correlated with liver fibrosis, and HISTO sequence had better diagnostic efficacy for liver fibrosis, which may be due to liver cell necrosis in the process of fibrosis development, decrease the liver fat content, while the HISTO can more accurate measurement of fat, so HISTO sequences have good correlation in diagnosis of liver fibrosis. The results were the same as in previous studies. [4-5] Previous study [6] showed that iron deposition had a certain correlation with liver fibrosis, and R2 * value was positively correlated with liver iron content. However, there was no significant correlation between R2 * value and liver fibrosis in this study, which may be caused by local hemosiderin deposition, or the process of local necrosis and swelling of liver cells may also affect the measurement of R2 * to a certain extent. Further research is needed in the future.Summary of Main Findings
Our study compared the diagnostic accuracy of HISTO and 6-echo DIXON techniques in assessing liver fat content and staging of liver fibrosis. The results show that HISTO sequence had better diagnostic efficacy for liver fibrosis.Acknowledgements
No acknowledgement found.References
1. Wang Qian,Ye Feng,Ma Peiqing et al. Quantitative magnetic resonance imaging evaluation of hepatic fat content with iron deposition: will it be disturbed?[J] .J Int Med Res, 2019, 47: 1958-1974.
2. Zhao Yu-Zhen,Gan Yun-Gen,Zhou Jian-Li et al. Accuracy of multi-echo Dixon sequence in quantification of hepatic steatosis in Chinese children and adolescents.[J] .World J Gastroenterol, 2019, 25: 1513-1523.
3. Wang Xiaomin,Zhang Xiaojing,Ma Lin et al. Simultaneous quantification of hepatic MRI-PDFF and R2* in a rabbit model with nonalcoholic fatty liver disease.[J] .Sci China Life Sci, 2018, 61: 1107-1114.
4. Yurdaisik Isil,Nurili Fuad,Accuracy of Multi-echo Dixon Sequence in Quantification of Hepatic Steatosis.[J] .Cureus, 2020, 12: e7103.
5. Jang Jong Keon,Lee Seung Soo,Kim Bohyun et al. Agreement and Reproducibility of Proton Density Fat Fraction Measurements Using Commercial MR Sequences Across Different Platforms: A Multivendor, Multi-Institutional Phantom Experiment.[J] .Invest Radiol, 2019, 54: 517-523.
6. Zhao Ruiyang,Hamilton Gavin,Brittain Jean H et al. Design and evaluation of quantitative MRI phantoms to mimic the simultaneous presence of fat, iron, and fibrosis in the liver.[J] .Magn Reson Med, 2021, 85: 734-747.
Figures