4251
Texture analysis of R2* maps for evaluating the pathological grade of hepatocellular carcinoma1Department of Radiology, The First Affiliated Hospital, Dalian Medical University, Dalian, Liaoning, China, 2GE Healthcare, Shanghai, China, 3Dalian Engineering Research Center for Artificial Intelligence in Medical Imaging, Dalian, Liaoning, China
Synopsis
Hepatocellular carcinoma (HCC) is a common malignant tumor with a high mortality. The higher the pathological grade represents lower the differentiation degree of HCC. Patients with low differentiation have a higher postoperative recurrence rate and the worse prognosis. Texture analysis is a post-processing method that highlights the difference between the brightness of pixel features and the intensity of background signals by analyzing the distribution and spatial relationship of gray values, and quantify and evaluate the heterogeneity of tumors at the pixel level. This research suggested that R2* maps texture analysis held great potential in evaluating the pathological grade of HCC.
Purpose
To explore the value of R2* maps derived from enhanced T2 star-weighted angiography (ESWAN) sequence-based texture analysis in evaluating the pathological grade of hepatocellular carcinoma (HCC).Introduction
Hepatocellular carcinoma (HCC) is a common malignant tumor with a high mortality[1]. The higher the pathological grade is, the lower the differentiation degree of HCC is, and the patients with low differentiation have a higher postoperative recurrence rate and the worse prognosis[2]. Therefore, pathological classification of HCC and identification of poorly differentiated HCC before surgery are very important for the selection of the best treatment and prognosis. Texture analysis is a post-processing method that highlights the difference between the brightness of pixel features and the intensity of background signals by analyzing the distribution and spatial relationship of gray values, and can quantify and evaluate the heterogeneity of tumors at the pixel level[3]. Enhanced T2-Star weighted angiography (ESWAN) is a derivative sequence of susceptibility weighted imaging(SWI) technology. Compared with traditional SWI, ESWAN has the advantages of higher magnetic sensitivity, higher signal-to-noise ratio and lower image distortion rate[4].Materials and Methods
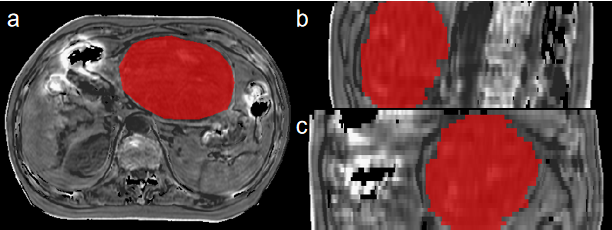
From October 2011 to December 2019, a total of 58 HCC patients (58 HCC lesions) who underwent liver MR examinations (including ESWAN sequence) with liver 1.5T MR scanner preoperatively in our hospital were enrolled in this retrospective study. All the patients enrolled were pathologically confirmed as HCC post-operatively, including well-moderately differentiated HCC group (n = 37) and poorly-differentiated HCC group (n = 21). By using ITK-SNAP software, radiologist delineated the edges of HCC lesions (including tumor pseudo-capsule) manually, and volume of interests (VOIs) were saved(Figure 1). R2* maps were saved as DICOM format, and transmitted to A.K. software (GE health care) to extract and analyses gray level run length matrix (GLRLM) features. Normal distribution was tested by Shapiro-Wilks test. The texture features were tested by two independent-sample t test or Mann-Whitney U test. Spearman’s rank correlation test was used to remove redundancy, and features with correlation coefficient greater than 0.90 were removed. Receiver operating characteristic (ROC) analysis was performed to evaluate the diagnostic performance of the texture features which were statistically significant and of the combination of these features. Delong test was used to compare the AUC of any single texture feature and the combination of these features. All statistic analyses were analyzed by SPSS 25.0 software and Medcalc software 19.5.Results
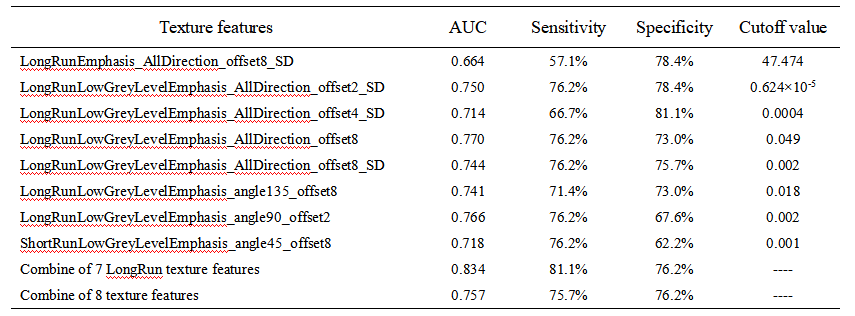
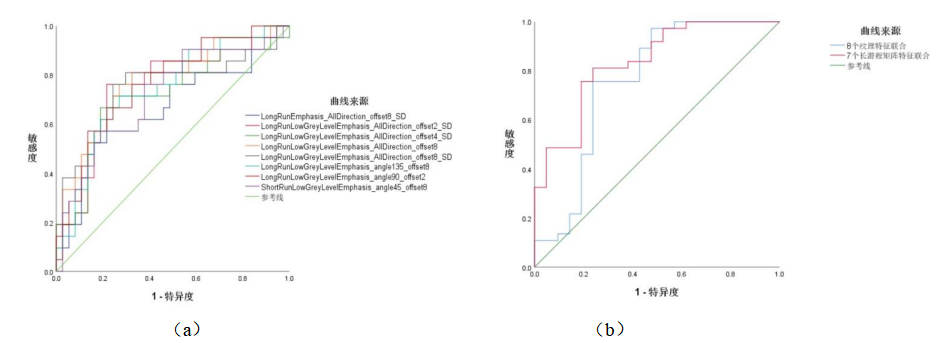
Eight GLRLM features were selected and were statistically significant (P< 0.05)(Table 1). The values of Long Run Emphasis All Direction_offset8_SD, Long Run Low Grey Level Emphasis_All Direction_offset8_SD, Long Run Low Grey Level Emphasis_All Direction_offset4_SD, Long Run Low Grey Level Emphasis_All Direction_offset2_SD, Long Run Low Grey Level Emphasis_All Direction_offset8, Long Run Low Grey Level Emphasis_angle135_offset8, Long Run Low Grey Level Emphasis_angle 90_offset2 and Short Run Low Grey Level Emphasis_angle45_offset8 in poorly-differentiated HCC group were greater than those in well-moderately differentiated group. The AUC of combination of 7 long run-length matrix features features was 0.834, sensitivity of 71.1% and specificity of 76.2%(Table 2). ROC curve of R2* maps-based texture analysis for evaluating the pathological grade of hepatocellular carcinoma is shown in Figure 2.Discussion and Conclusion
The results indicated that the Short Run Low Grey Level Emphasis_angle45_offset8 in the low differentiation group was significantly higher than that in the high differentiation group, and it was speculated that the low gray level in the low differentiation group accounted for a higher proportion, which might be related to the more serious hypoxia and higher deoxyhemoglobin content in the local tissues of the low differentiation liver cancer. In conclusion, enhanced T2 star-weighted angiography (ESWAN) sequence-based texture analysis can evaluates the heterogeneity of HCC at the pixel level, and has a promising value in evaluation of the pathological grade of HCC.Acknowledgements
NothingReferences
[1]Baecker A, Liu X, Vecchia CL, et al. Worldwide incidence of hepatocellular carcinoma cases attributable to major risk factors[J]. Eur J Cancer Prev, 2018, 27(3):205-212.
[2] Mao B., Zhang L., Ning P., et al. Preoperative prediction for pathological grade of hepatocellular carcinoma via machine learning–based radiomics. European Radiology[J]. 2020,(1): 1-9.
[3] Goyal A., Razik A., Kandasamy D., et al. Role of MR texture analysis in histological subtyping and grading of renal cell carcinoma: a preliminary study. Abdominal Radiology[J]. 2019,44(6): 3336-3349.
[4] Han X., Sun M., Wang M., et al. The enhanced T2 star weighted angiography (ESWAN) value for differentiating borderline from malignant epithelial ovarian tumors. European journal of radiology[J]. 2019,118: 187-193.
Figures