4248
Differentiating Cytokeratin 19 Expression of HCC by Using Multi-b-value Diffusion-Weighted MR Imaging1Zhongshan Hospital affiliated to Fudan University, Shanghai, China, 2Central Research Institute, United Imaging Healthcare, Shanghai, China, 3Shanghai Key Laboratory of Magnetic Resonance, School of Physics and Electronics Science, East China Normal University, Shanghai, China
Synopsis
Diffusion-weighted imaging (DWI) is a powerful functional MRI technique. However, scarcely has the DWI been used to identify the expression of Cytokeratin 19 (CK19) in hepatocellular carcinoma (HCC). In this study, we aim to differentiate CK19 positive and negative HCC with diffusion parameters derived from different DWI techniques. Our results showed that diffusion parameters can be used as noninvasive quantitative imaging markers for preoperatively predicting the CK19 expression of HCCs. More importantly, the integration of different diffusion parameters could better describe the characteristics of tumor tissues,thus reaching better diagnostic performance.
Introduction:
HCC is the fifth most common cancer and the third cause of cancer-related death worldwide (1). Multiple studies have shown that CK19 expression indicates a poor prognosis in patients with HCC (2, 3). Preoperatively evaluating CK19 status is of significant clinical importance in optimizing management strategies and predicting the prognosis for patients with HCC (2). With the capability of providing information of tumor cellularity, vascularity and microstructures, DWI can be a promising tool to detect the CK19 expression of HCCs preoperatively without the use of contrast agents (4). Moreover, numerous DWI models have been established during the past few decades to better describe the real diffusion process and probe the microstructure in biological tissues. However, to the best of our knowledge, hardly has the DWI been applied for identifying the CK19 status and only few researchers utilized different Gaussian and non-Gaussian DWI techniques to assess the histopathological markers. Hence, this study aims to explore the feasibility of using different diffusion parameters and the combination of them for preoperative assessment of CK19 expression of CK19.Methods:
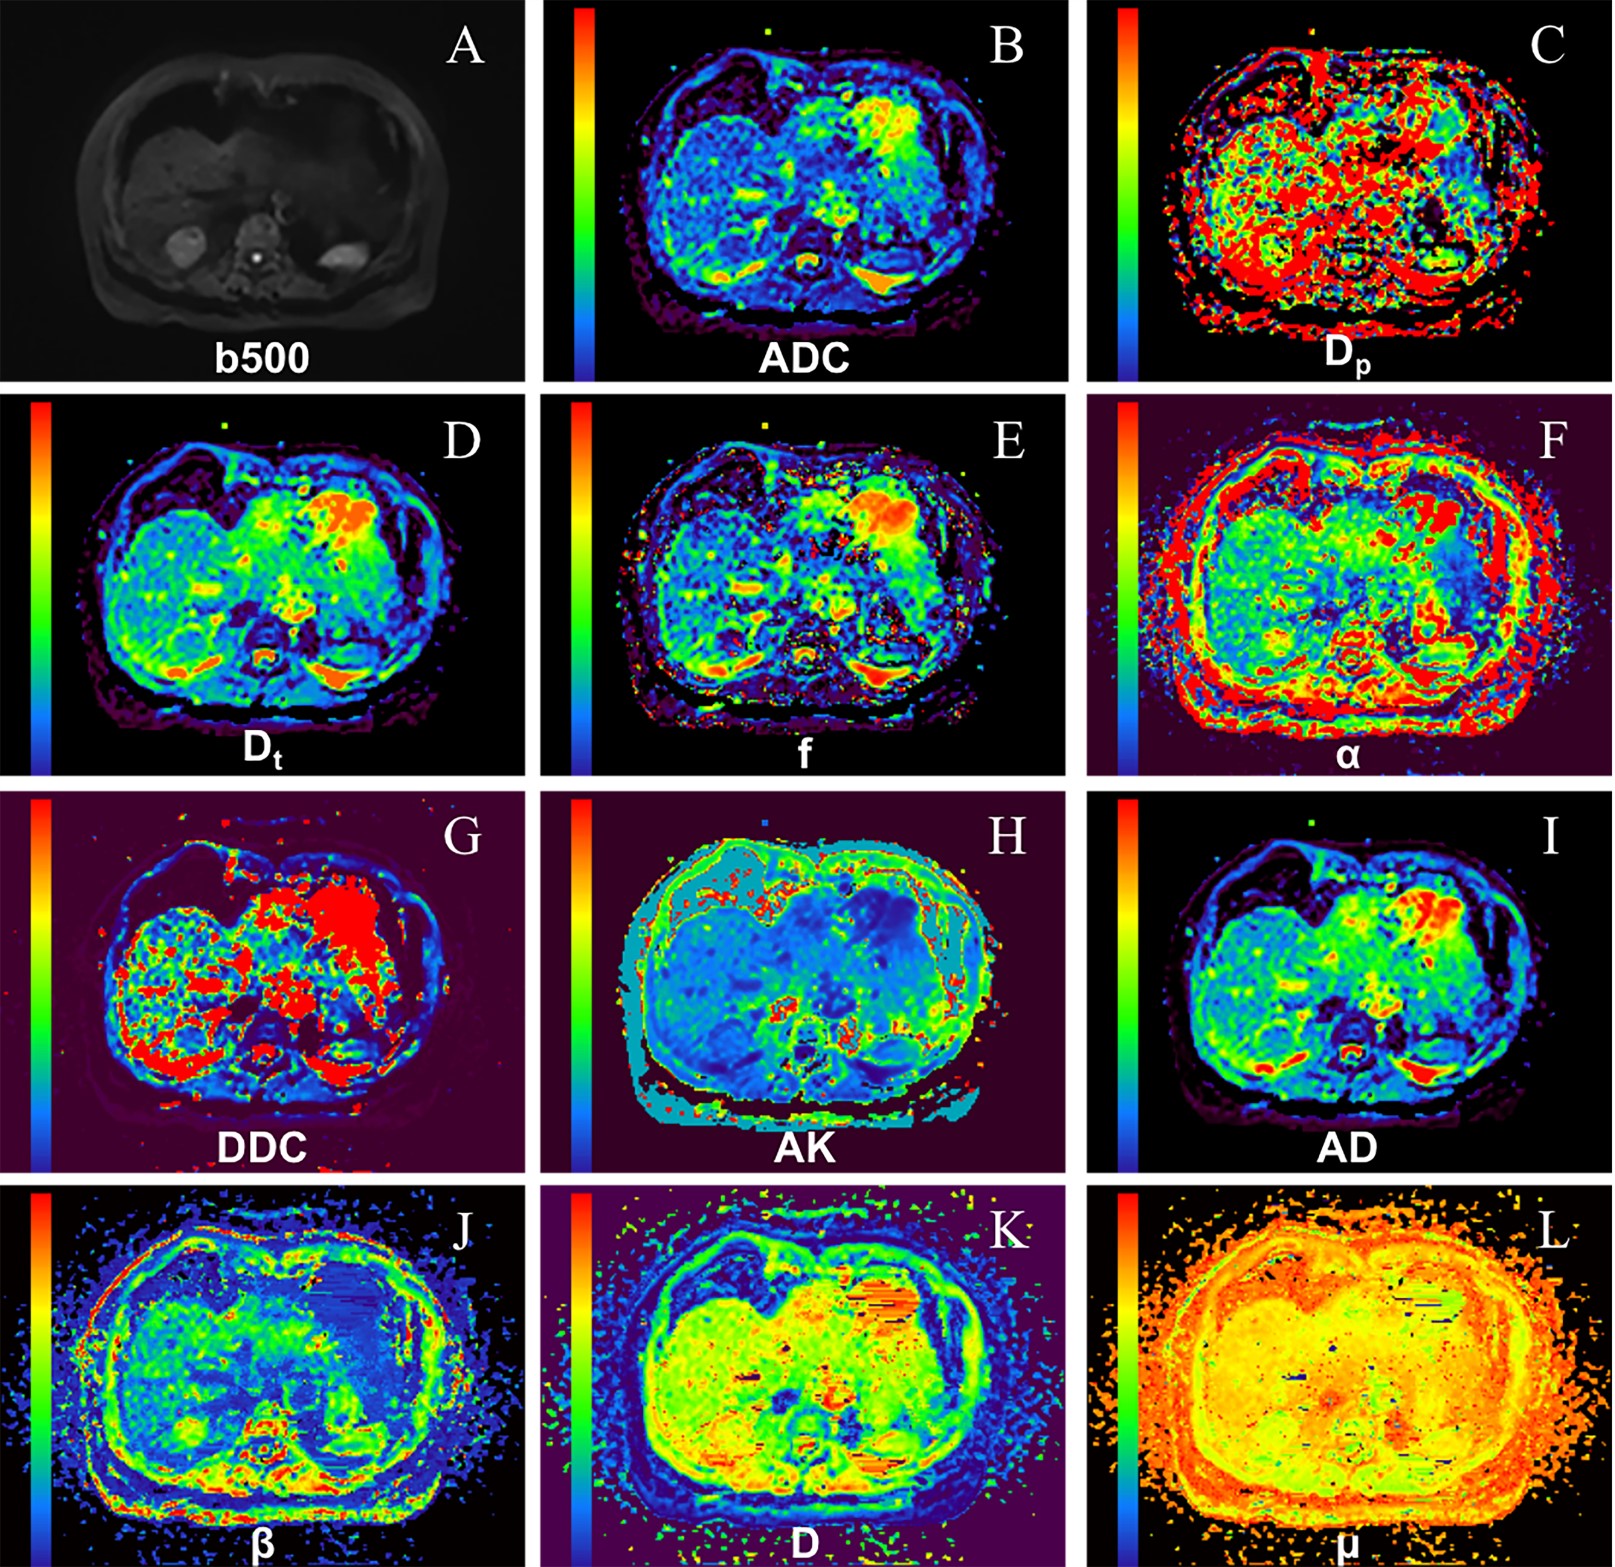
61 patients with pathologically confirmed primary HCC were included in this prospective study. All the DWI images were acquired using a 3.0 T MR scanner (uMR 770, United Imaging Healthcare Co Ltd, Shanghai, China) with 10 b-values (0, 20, 40, 50, 100, 200, 500, 800, 1500 and 2000 s/mm2). The detailed parameters of DWI sequence are as followings: TR/TE/FA: 3800 ms/86.2 ms/90°; Matrix/FOV: 300×380/300×380 mm2. The apparent diffusion coefficient (ADC) was calculated from MEM. Distributed diffusion coefficient (DDC) and heterogeneity index (α) were calculated from SEM. The apparent kurtosis coefficient (AK) and apparent diffusion coefficient (AD) were calculated from DKI. Pseudo-diffusion coefficient (Dp), true diffusion coefficient (Dt), and perfusion fraction (f) were calculated from IVIM. Diffusion coefficient (D), fractional order parameter (β) and a microstructural quantity (μ) were calculated from FROC model. The values of all parameters were compared between the subgroups by using the Student t test or Mann-Whitney U test appropriately. Receiver operating characteristic analysis was performed to evaluate the diagnostic performance.Results:
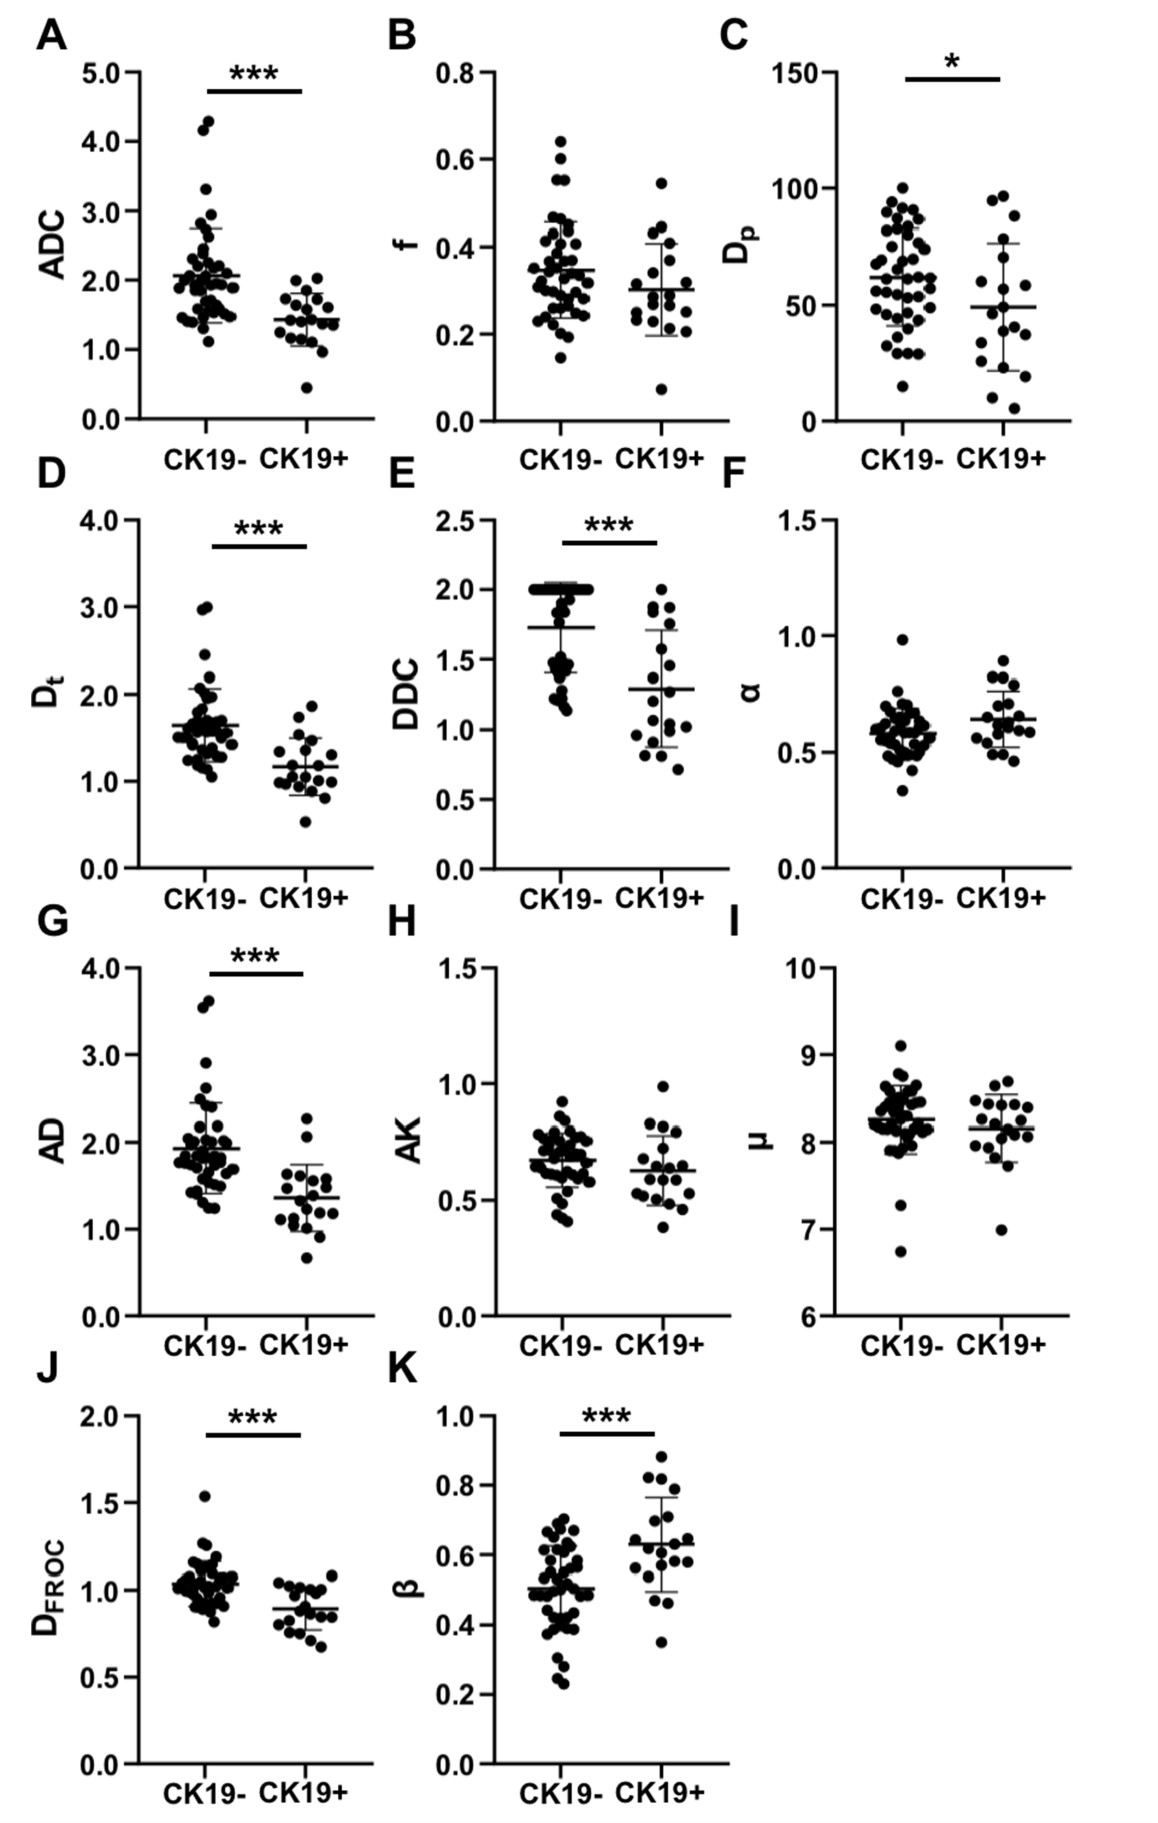
Representative MR images of a patient with CK19-negative HCC and a patient with CK19-positive HCC were displayed in Fig1 and Fig2, respectively. The Fig.3 showed that ADC, DDC, Dt, Dp, AD, and D were significantly lower in CK19-positive HCCs than in CK19-negative HCCs (P < .05). β was significantly higher in CK19-positive group (P < .001). The ROC curves in Fig4 showed that AD (AUC = 0.845), Dt (AUC = 0.837), ADC (AUC = 0.816) and DDC (AUC = 0.813) had greater AUC values than D (AUC = 0.786), β (AUC = 0.746) and Dp (AUC = 0.644) in differentiating CK19-positive and CK19-negative HCC. The combination of β, AD, and Dp generated the highest area under the ROC curve (AUC = 0.881) compared with individual parameters, which improved the performance for CK19 expression classification.Discussion:
The aforementioned results indicated that diffusion parameters characterizing the tissue cellularity (AD, ADC, DDC, Dt, and D) showed the best diagnostic performance which implied the expression of CK19 was highly correlated with increased cellularity. More importantly, the combination of β, AD and Dp values yielded the best diagnostic performance. With multiple parameters including cellularity-related AD, vascularity-related Dp and heterogeneity-related β, the diagnostic model could simultaneously reflect different tissue properties caused by the occurrence, metastasis, and invasion of tumor from multiple perspectives, thus achieving better diagnostic performance. Hence, the combination of different DWI-derived parameters is of great clinical significance for obtaining a more comprehensive characterization of tumor.Conclusion:
ADC, DDC, Dt, Dp, D, and β may serve as noninvasive and quantitative imaging markers and hold great potential in accurately identifying the CK-19 status of HCC. More importantly, the combination of different diffusion parameters yielded much better diagnostic performance.Acknowledgements
NoneReferences
1. Sung H, Ferlay J, Siegel RL, Laversanne M, Soerjomataram I, Jemal A, Bray F. Global Cancer Statistics 2020: GLOBOCAN Estimates of Incidence and Mortality Worldwide for 36 Cancers in 185 Countries. CA Cancer J Clin 2021;71:209-249.
2. Nault JC, Galle PR, Marquardt JU. The role of molecular enrichment on future therapies in hepatocellular carcinoma. J Hepatol 2018;69:237-247.
3. Zhuo JY, Lu D, Tan WY, Zheng SS, Shen YQ, Xu X. CK19-positive Hepatocellular Carcinoma is a Characteristic Subtype. J Cancer 2020;11:5069-5077.
4. Choi SY, Kim SH, Park CK, Min JH, Lee JE, Choi YH, Lee BR. Imaging Features of Gadoxetic Acid-enhanced and Diffusion-weighted MR Imaging for Identifying Cytokeratin 19-positive Hepatocellular Carcinoma: A Retrospective Observational Study. Radiology 2018;286:897-908.
Figures