4244
Development and validation of a semi-automated framework for PI-RADS v2.1 assessment
Dharmesh Singh1, Virendra Kumar2, Chandan J Das3, Anup Singh1,4, and Amit Mehndiratta1,4
1Centre for Biomedical Engineering (CBME), Indian Institute of Technology (IIT) Delhi, New Delhi, India, 2Department of NMR, All India Institute of Medical Sciences (AIIMS) Delhi, New Delhi, India, 3Department of Radiodiagnosis, All India Institute of Medical Sciences (AIIMS) Delhi, New Delhi, India, New Delhi, India, 4Department of Biomedical Engineering, All India Institute of Medical Sciences (AIIMS) Delhi, New Delhi, India, New Delhi, India
1Centre for Biomedical Engineering (CBME), Indian Institute of Technology (IIT) Delhi, New Delhi, India, 2Department of NMR, All India Institute of Medical Sciences (AIIMS) Delhi, New Delhi, India, 3Department of Radiodiagnosis, All India Institute of Medical Sciences (AIIMS) Delhi, New Delhi, India, New Delhi, India, 4Department of Biomedical Engineering, All India Institute of Medical Sciences (AIIMS) Delhi, New Delhi, India, New Delhi, India
Synopsis
Prostate Imaging-Reporting and Data System version 2.1 (PI-RADS v2.1) was developed to standardize the interpretation of multiparametric MRI (mpMRI) for prostate cancer (PCa) detection. However, a significant inter-reader variability among radiologists has been found in the PI-RADS assessment. An automated or semi-automated PI-RADS assessment system could be beneficial in the screening process of PCa and could improve the consistency of scoring. The purpose of this study was to evaluate the diagnostic performance of an in-house developed semi-automatic framework for PI-RADS assessment using machine learning classifiers.
Introduction
Multiparametric-MRI (mpMRI) based prostate screening method is able to improve the early detection of high-risk prostate cancer (PCa).1 Recently, Prostate Imaging-Reporting and Data System version-2.1 (PI-RADS v2.1) was designed to improve global standardization process and reduce heterogeneity in prostate mpMRI acquisition, interpretation, and reporting.2 PI-RADS assessment system is a qualitative Likert-based [1 to 5] scale with higher values indicating higher suspicion of PCa.2 PI-RADS includes a lesion-size based decision-criterion (cut-off:1.5cm for scores-4 and 5) and also provides a minimal requirement for the measurement of lesion-volume (>0.5cc for high-risk PCa).2 One study by Martorana et al. reported the PI-RADS scores increase with the increase in lesion-volume.3However, PI-RADS scoring is challenging due to its inherent technical difficulties to visualize a small lesion on MRI, which leads to subjectivity and the whole PI-RADS process is time-consuming as reporting time has become an important performance indicator in healthcare.4 Previous studies have shown poor inter-reader variability in the assessment of PI-RADS scores.5,6 Machine learning-based automated or semi-automated PI-RADS scoring has the potential to assist radiologists in screening process, reducing inter-reader variability and evaluation-time.7 The objective of this study was to develop a semi-automated framework to simplify the reporting process of prostate MRI and validate the performance of framework using machine-learning methods.
Methods
MRI data-acquisitionMRI dataset of 59 men (mean-age:65 ± 8.5 years) with clinically proven PCa (PI-RADS v2.1 score-2=16, score-3=10, score-4=18 and score-5=15) was used in this retrospective study. All prostate MRI examinations were acquired at 1.5T scanner (Achieva,Philips Health Systems). T2-weighted images were acquired using a turbo-spin-echo sequence with TR/TE=3330/90 ms, field-of-view (FOV)=250×250 mm2, acquisition-matrix=320×320, voxel-size=0.49×0.49×3 mm3, slice-thickness=3 mm and number-of-slices=36. Diffusion-weighted images were acquired using echo-planar-imaging (TR/TE=6831/81 ms, FOV=292×292 mm2, acquisition-matrix=112×112, voxel-size=2.6×2.6×3 mm3, slice-thickness=3 mm, number-of-slice=36, with five b-values of 0,500,1000,1500 and 2000 s/mm2). Apparent-diffusion coefficients were calculated using the vendor-provided software at the clinical-workstation.
Methodology
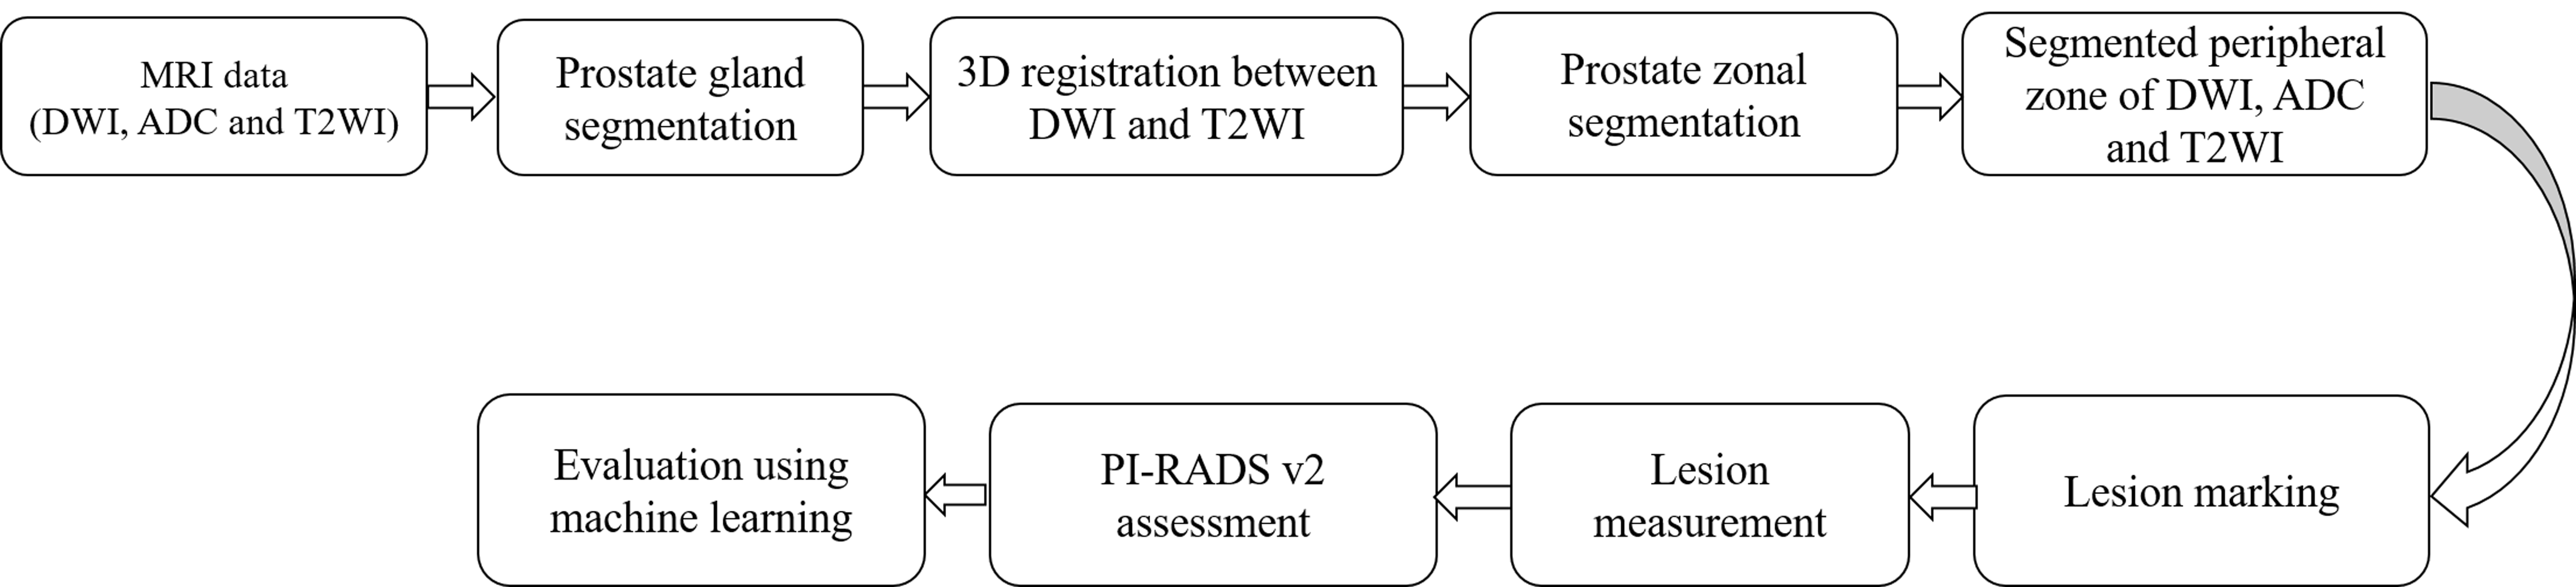
The pre-processing steps involved prostate-gland segmentation, 3D image-registration, prostate-zonal segmentation, lesion region-of-interest (ROI) marking and lesion measurement. The Chan-Vese active-contour model along with morphological opening operation was used for prostate-gland segmentation and a probabilistic atlas with partial-volume (PV) correction algorithm was used for prostate-zonal segmentation.8 An affine-transformation method with a mutual-information similarity index was applied for 3D-registration of the prostate gland ROIs of T2WI and DWI.
Lesion ROIs were marked on the peripheral-zone of DWI (b=2000 s/mm2), ADC and T2W images as per PI-RADS v2.1 guidelines2 with the help of an expert radiologist. The ellipse-fitting approach was used for the measurement of lesion-maximum diameter and volume. PI-RADS v2.1 scores were assessed based on lesion measurements using ellipse-fitting. Linear discriminant-analysis (LDA), linear support-vector machine (SVM) and Gaussian SVM were used to evaluate the diagnostic accuracy of the proposed framework by classification of PI-RADS scores; i)score-2 vs. score-3 vs. score-4 vs. score-5 and ii)low-score (score 2,3) vs. high-score (score 4,5) using stratified 5-fold cross-validation (CV).
Data were processed using in-house developed toolbox in MATLAB (v.2018;MathWorks,Natick,USA). Sensitivity, specificity, accuracy and area under the receiver-operating characteristic curve (AU-ROC) were measured to evaluate the performance of the proposed framework. The workflow of our proposed framework is shown in figure-1.
Results
Lesion-maximum diameter and lesion-volume measured by the ellipse-fitting approach were 0.47±0.06 cm and 0.13±0.03 cc for score-2; 0.67±0.11 cm and 0.25±0.12 cc for score-3; 0.96±0.18 cm and 0.56±0.28 cc for score-4 and 1.45±0.15 cm and 0.99±0.25 cc for score-5, respectively. The proposed framework-based PI-RADS v2 assessment showed 50 out of 59 subjects correctly matched (~85%) with the radiologist assessment. The proportion of correct classification rate in all PI-RADS scores is shown in figure-2. Semi-automated PI-RADS assessment showed strong positive-correlation (r=0.94,p<0.05) with radiologist-assessment.Table-1 presents the performance of both approaches, i)four-class classification (score-2 vs. score-3 vs. score-4 vs. score-5) and ii)two-class (low-score vs. high-score) using three different classifiers. LDA classifier achieved the highest performance, sensitivity,85.50±1.95%; specificity,75.00±1.10%; accuracy,88±0.98%; AUC,0.94 in four-class classification and linear SVM classifier achieved the highest performance, sensitivity,91.45±3.65%; specificity,95.85±1.25%; accuracy,93.20±2.10%; AUC,0.99 in two-class classification using 5-fold CV. Figure-3 shows the ROC graphs for four-class and two-class classifications using different classifiers.
Discussion
An automatic or semi-automatic PI-RADS scoring could assist the radiologist to speed up reporting and reduce errors in misclassifying lesions. PI-RADS scoring has inherent subjectivity due to its reliance on interpretable descriptions and lack of quantitative metrics.2 Previously, the performance of semi-automated PI-RADS assessment has been evaluated using a convolution-neural network with the mean AUC of 0.65 and both studies were based on two-class (low vs. high score) classification.9,10 The proposed framework here outperformed the existing methods with the correct classification rate of 85% and AUC,0.94 for four-class classification (score-2 vs. score-3 vs. score-4 vs. score-5) and AUC,0.99 for low-score (score 2&3) vs. high-score (score 4&5) classification. The proposed framework for semi-automatic PI-RADS v2.1 scoring is relatively objective and could be helpful for non-expert radiologists in terms of reporting accuracy. Future work will include automated ROI-lesion delineation and a large number of patients from multiple clinical centres to evaluate the accuracy of proposed framework.Conclusion
The developed semi-automatic framework for PI-RADS v2.1 scoring achieved high classification accuracy (88%) using machine-learning approach. This framework could improve the consistency of scoring in a screening setting of prostate cancer.Acknowledgements
This work is supported by IIT Delhi, India and AIIMS New-Delhi, India. DS was supported with the research fellowship fund from the Ministry of Human Resource Development, Government of India.References
- Richenberg J, Løgager V, Panebianco V, et al. The primacy of multiparametric MRI in men with suspected prostate cancer. Eur Radiol. 2019; 29(12):6940-6952.
- Turkbey B, Rosenkrantz AB, Haider MA, et al. Prostate imaging reporting and data system version 2.1: 2019 update of prostate imaging reporting and data system version 2. Eur Urol. 2019;76:340-351.
- Martorana E, Pirola Giacomo M, Scialpi N, et al. Lesion volume predicts prostate cancer risk and aggressiveness: validation of its value alone and matched with prostate imaging reporting and data system score. BJU Int. 2016; 120: 92-103.
- Barth BK, Martini K, Skawran SM, et al. Value of an online PI-RADS v2.1 score calculator for assessment of prostate MRI. Eur J Radiol Open. 2021; 8:100332.
- Greer MD, Brown AM, Shih JH, et al. Accuracy and agreement of PIRADSv2 for prostate cancer mpMRI: A multireader study. J Magn Reson Imaging. 2017; 45(2):579-585.
- Smith CP, Harmon SA, Barrett T, et al. Intra- and interreader reproducibility of PI-RADSv2: A multireader study. J Magn Reson Imaging. 2019; 49(6):1694-1703.
- Bardis MD, Houshyar R, Chang PD, et al. Applications of Artificial Intelligence to Prostate Multiparametric MRI (mpMRI): Current and Emerging Trends. Cancers (Basel). 2020;12(5):1204.
- Singh D, Kumar V, Das CJ, et al. Segmentation of prostate zones using probabilistic atlas-based method with diffusion-weighted MR images. Computer Methods and Programs in Biomedicine. 2020, 196, 1-10.
- Sanford T, Harmon S, et al. MP74-10 deep learning for semi-automated PIRADSV2 scoring on multiparametric prostate MRI. J. Urol. 2019; 201:2019.
- Dhinagar NJ, Speier W, Sarma KV, et al. Semi-automated PIRADS scoring via mpMRI analysis. Journal of medical imaging. 2020; 7(6): 064501.
Figures
Figure
1. Proposed
framework for semi-automatic PI-RADS v2.1 assessment. DWI = Diffusion-weighted
imaging, ADC = Apparent diffusion coefficient, T2WI = T2 weighted imaging
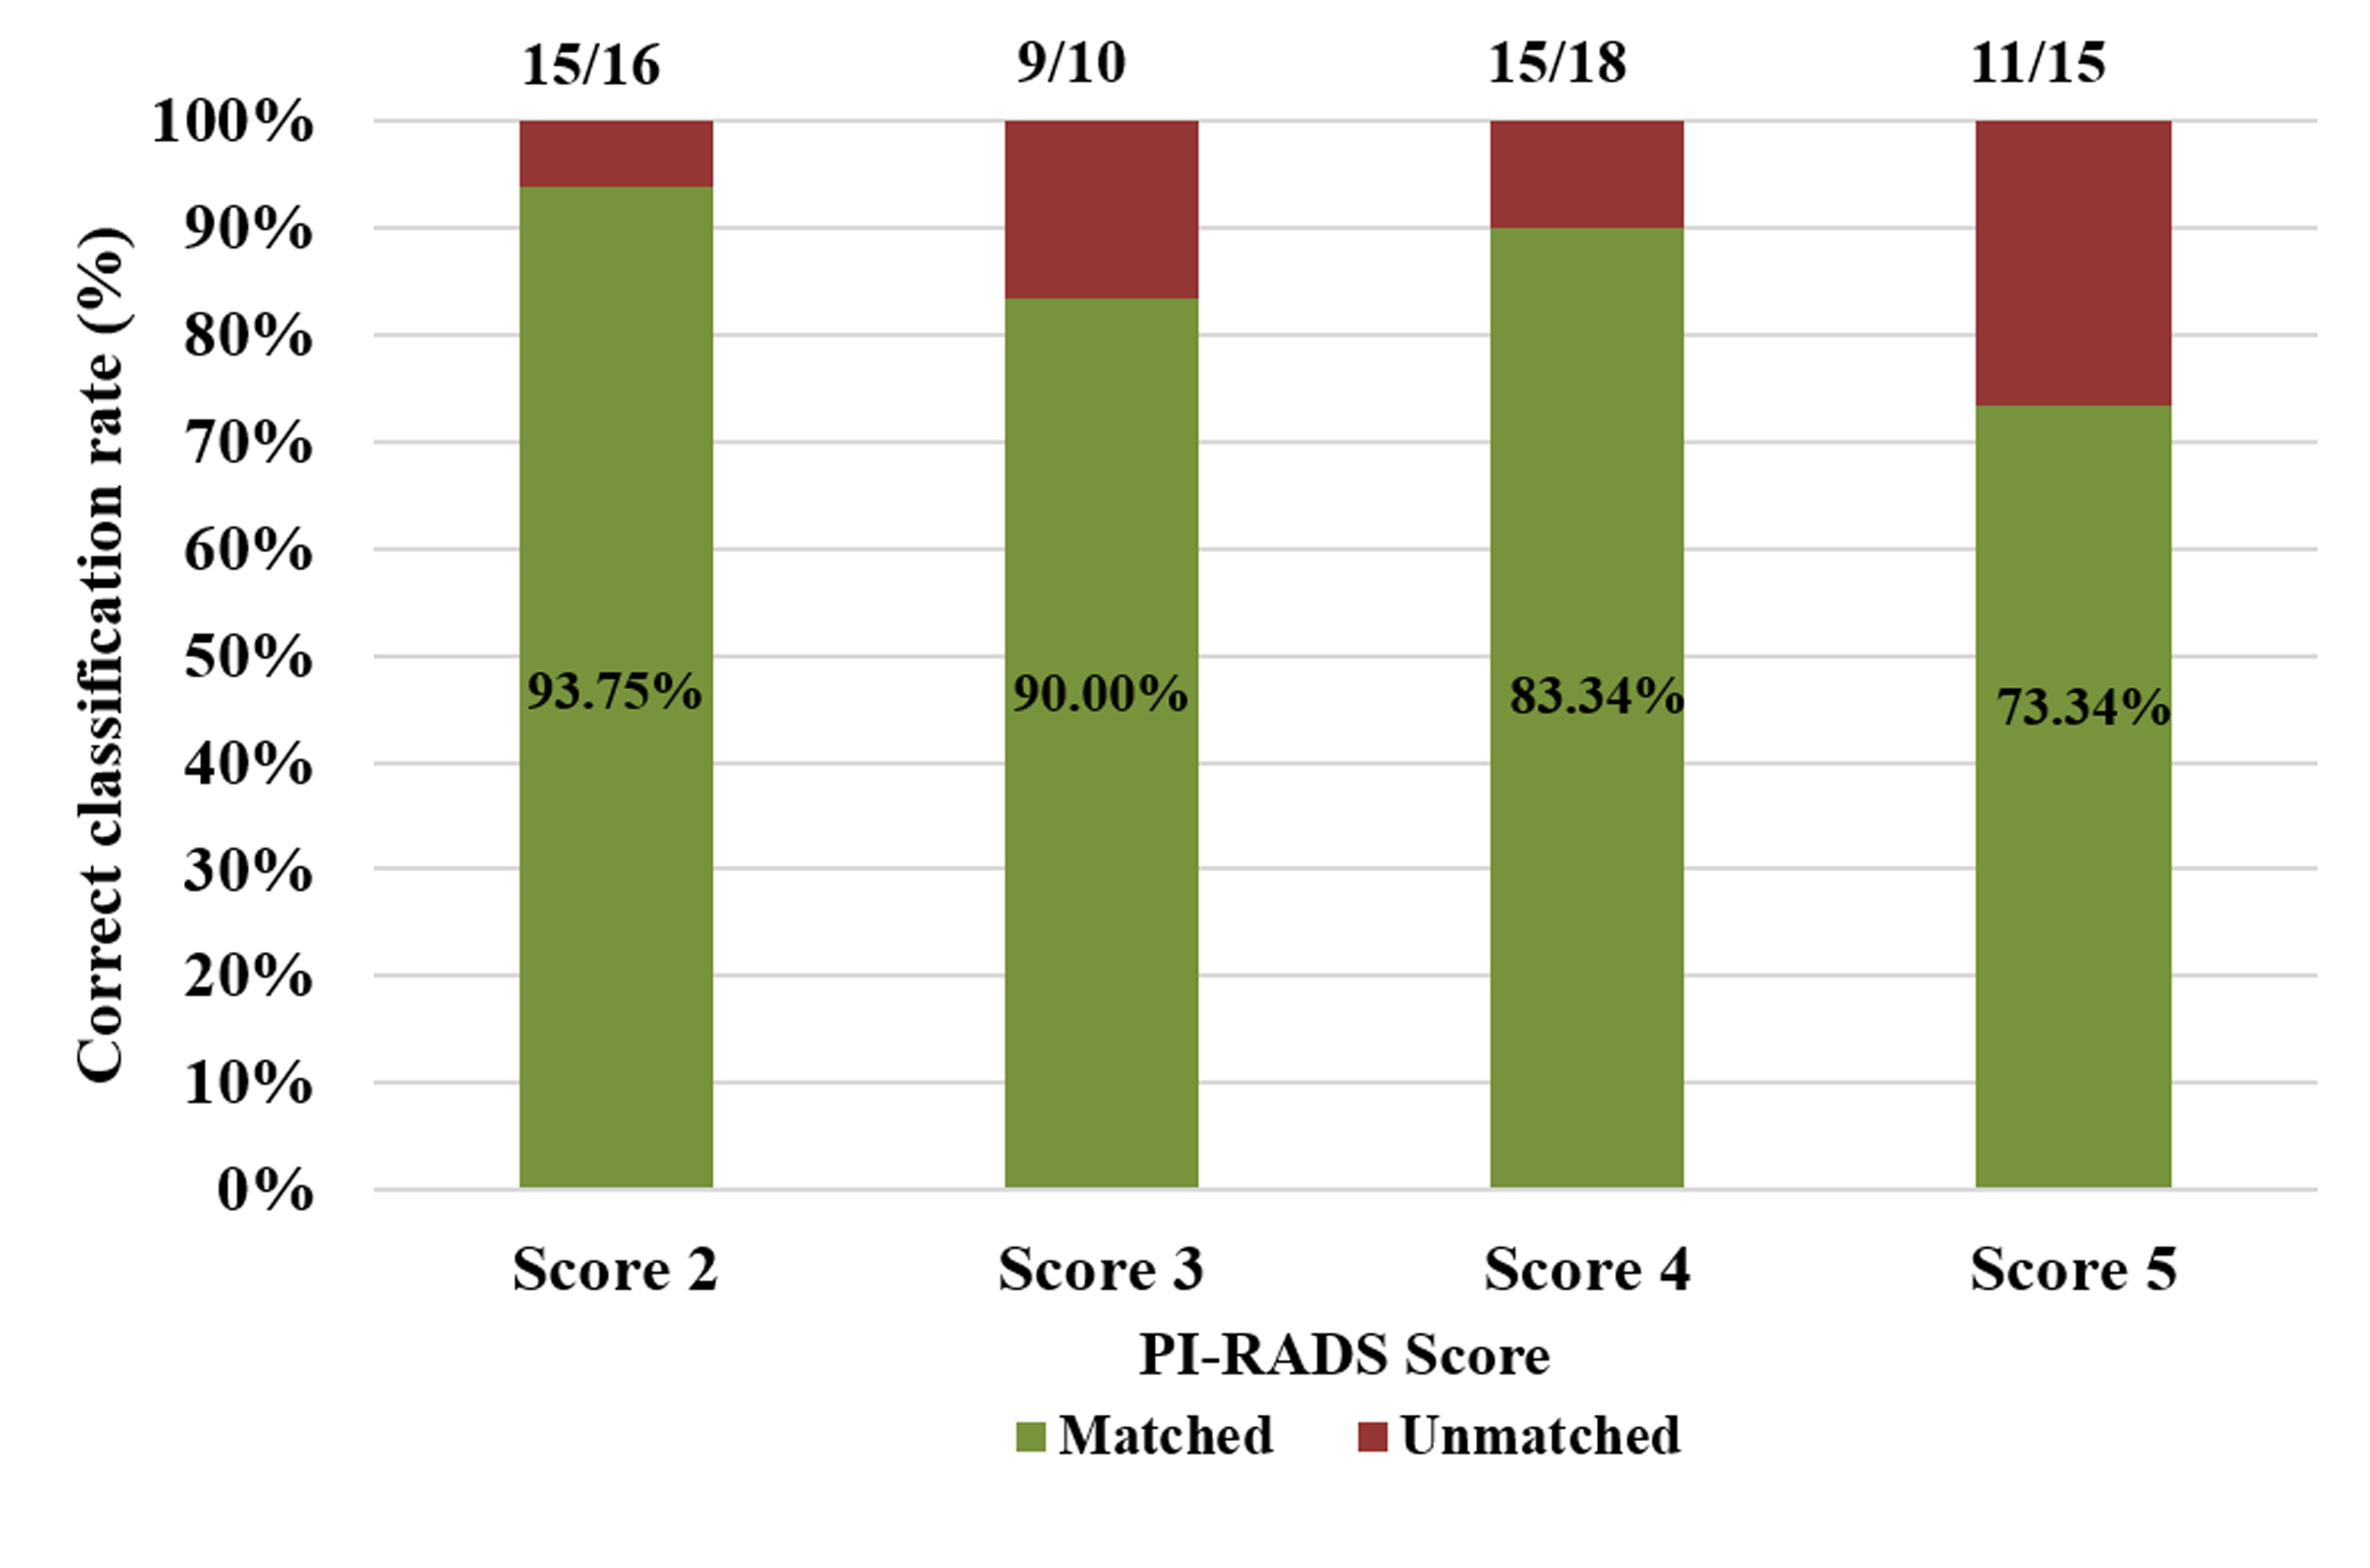
Figure
2. Proportion of the detection rate across all PI-RADS v2.1 scores
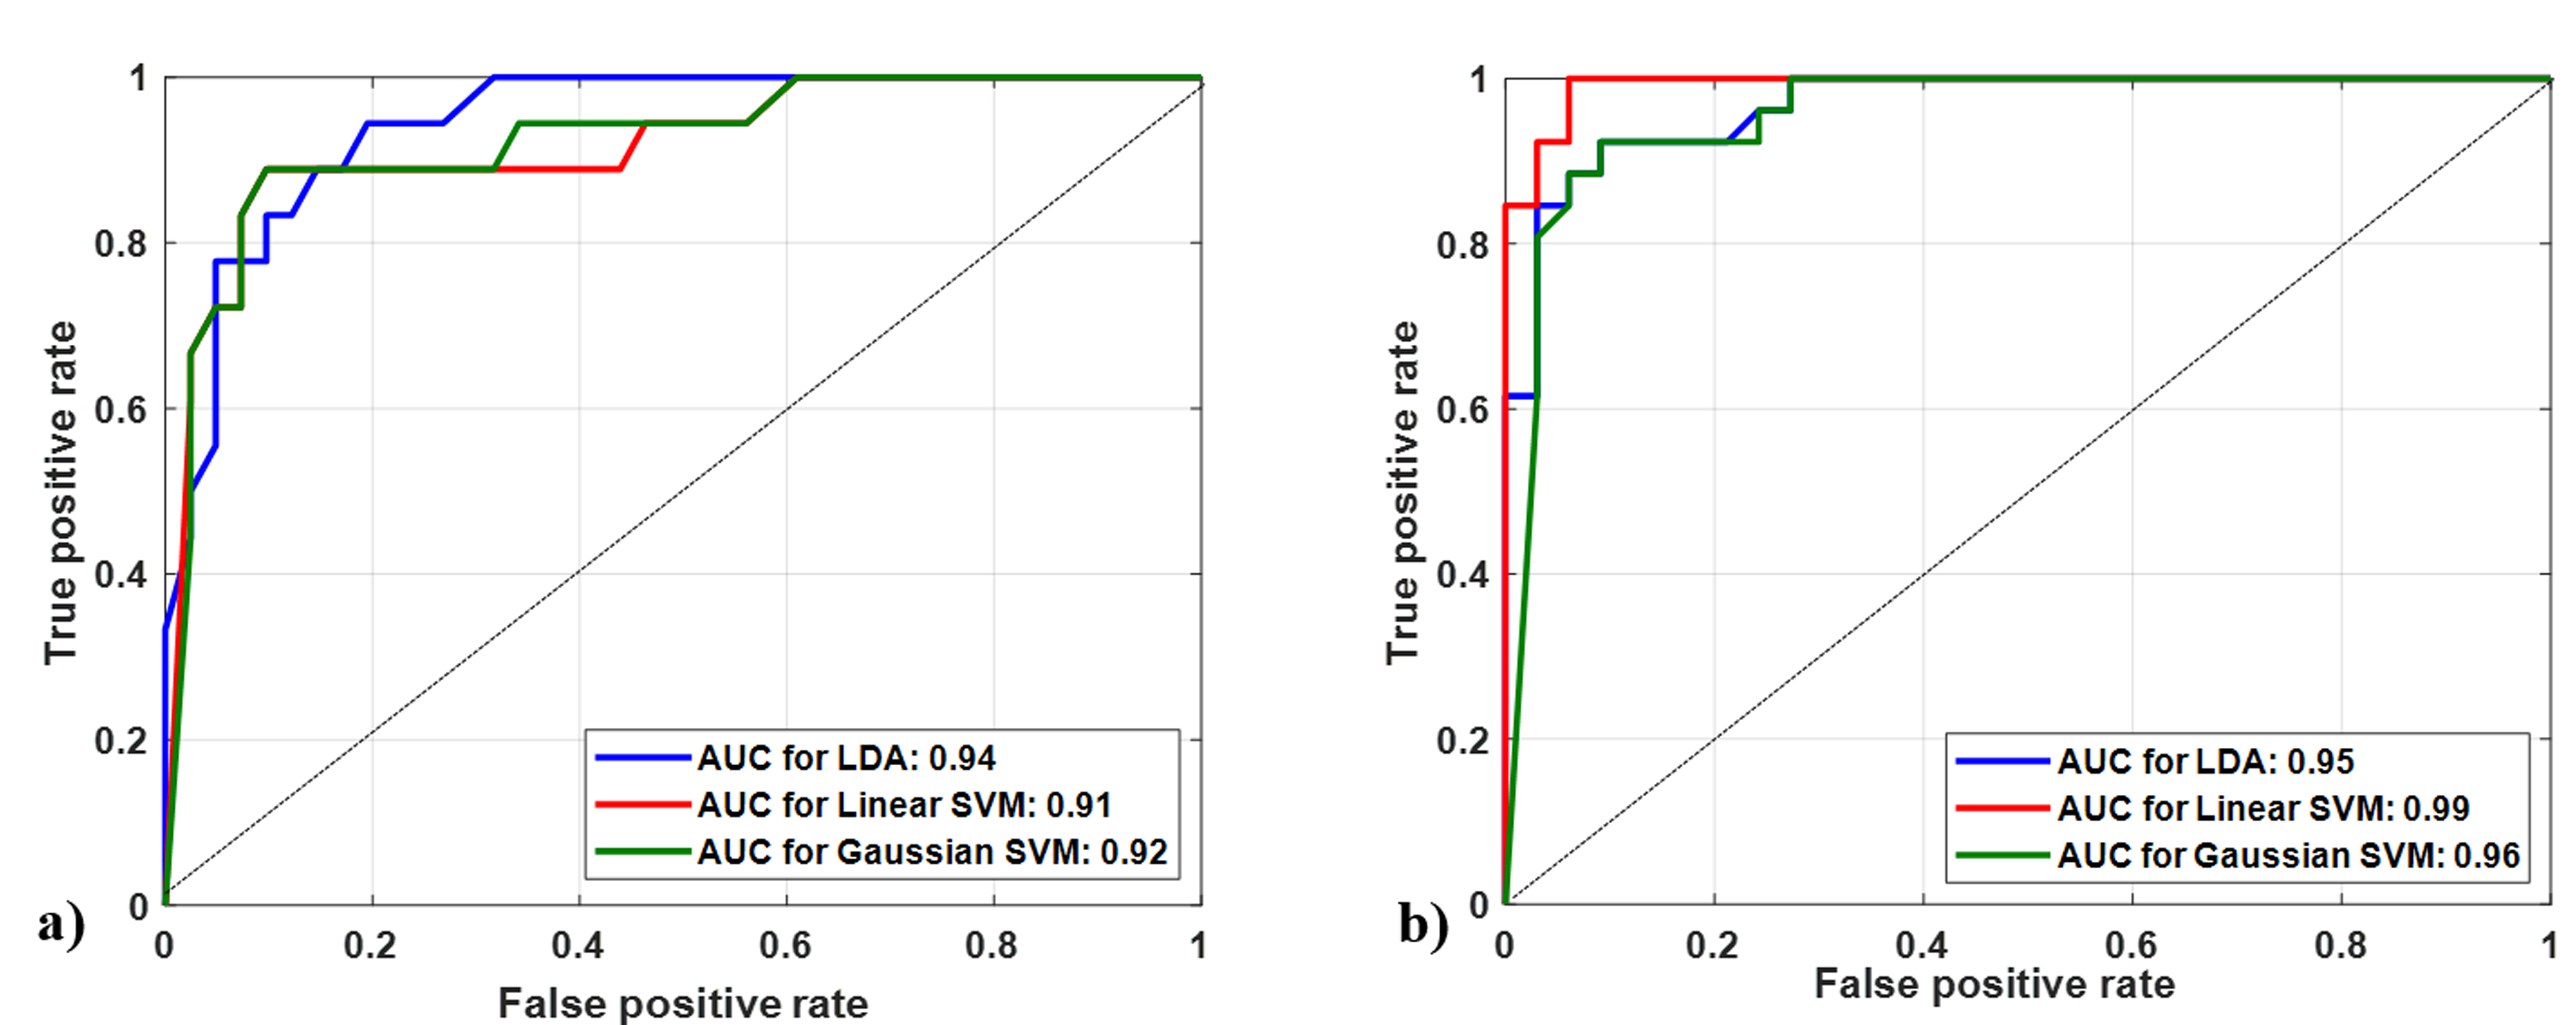
Figure
3. Multiple receiver-operating characteristic graphs for a) score 2 vs. score 3 vs. score 4 vs. score 5 classification and b) Low score (2, 3) vs. High score (4, 5) classification.
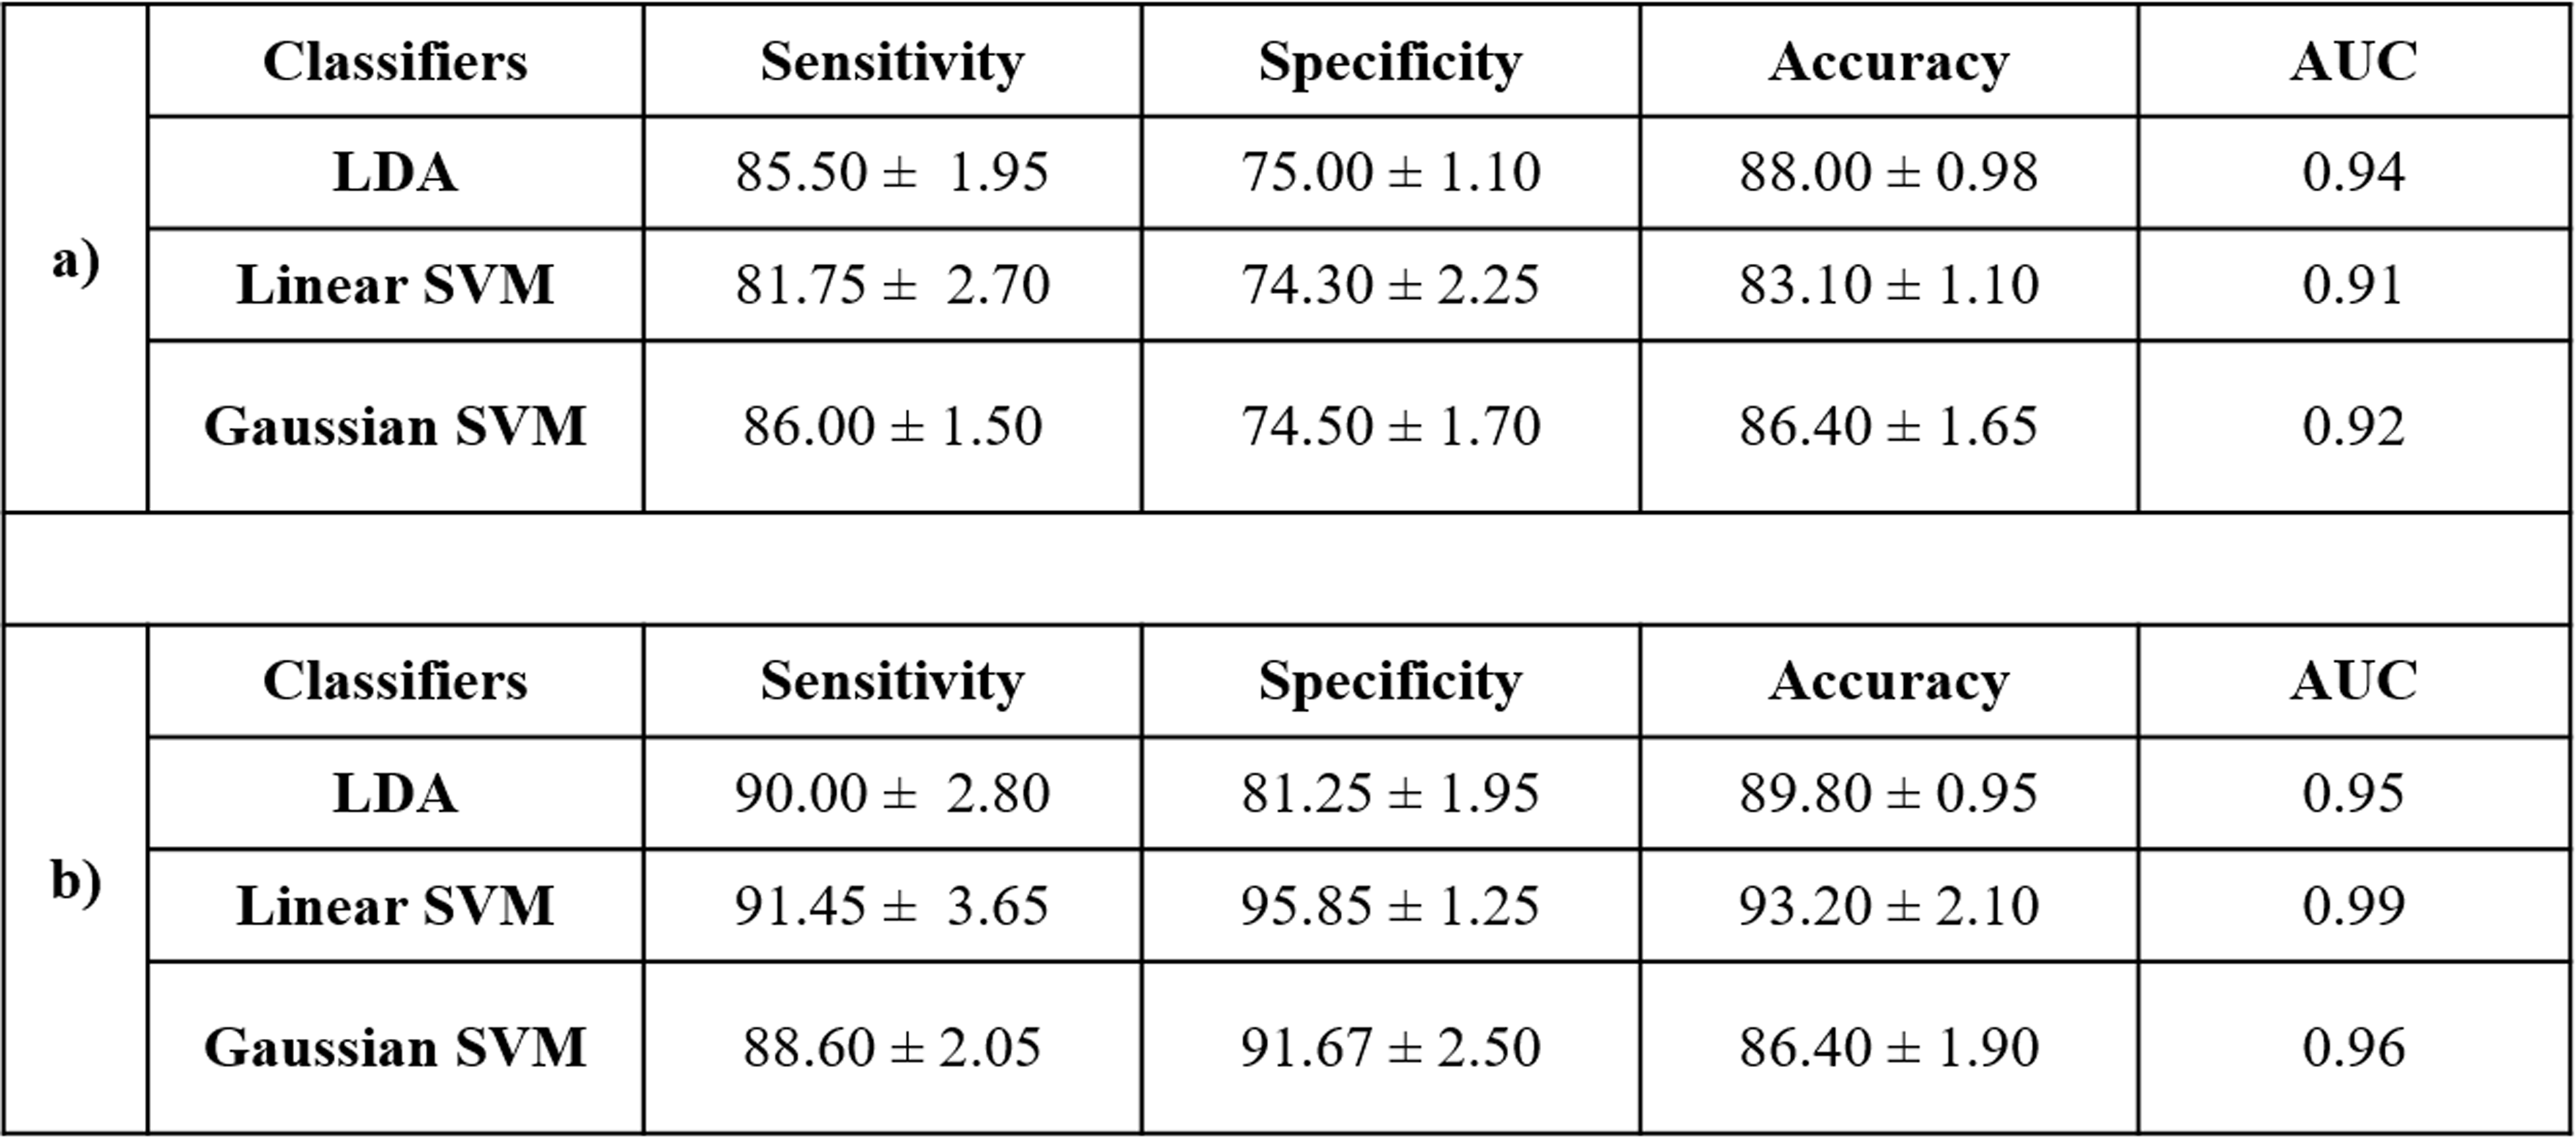
Table 1. Classification
performance
of the proposed framework for semi-automated PI-RADS assessment of a)
score
2
vs. score 3 vs. score 4 vs. score 5 classification
and
b) for Low score (2,3) vs. High score
(4,5) classification using 5-fold cross-validation
DOI: https://doi.org/10.58530/2022/4244