4243
T1 mapping with extracellular volume fraction measurement to evaluate histological features of cervical squamous cell carcinoma1the First Affiliated Hospital of Zhengzhou University, Zhengzhou, China, 2Siemens Healthcare GmbH, Erlangen, Germany, 3Siemens Healthcare Ltd, Beijing, China
Synopsis
This study investigated the feasibility of extracellular volume fraction (ECV) measurement using T1 mapping to evaluate histological grade, lymphovascular space invasion (LVSI) status, perineural invasion (PNI) status, and Ki-67 proliferation index (PI) of cervical squamous cell carcinoma (CSCC), and to compare T1 mapping with diffusion-weighted imaging (DWI). Results showed that T1 mapping-derived parameters (ΔT1, ECV) can effectively grade and predict CSCC LVSI status, PNI status, and Ki-67 PI, and ADC values can stratify CSCC grading. ECV may represent an effective quantitative imaging biomarker indicating the poor-prognosis histological features of CSCC and may provide incremental diagnostic value beyond qualitative MRI features.
Purpose
T1 mapping is a promising, noninvasive clinical tool used to assess and quantify tissue composition [1]. Compared with the evaluation of T1 mapping, extracellular volume fraction (ECV) shows advantages, including independence of field strength, imaging parameters, and contrast dose (because it is a ratio derived from pre- and post-contrast T1 values), in addition to the physiologically intuitive unit of measurement [2]. The purpose of the study was to explore the ability of T1 mapping and ECV measurement to assess poor-prognosis histological features of cervical squamous cell carcinoma (CSCC), including histological grade, lymphovascular space invasion (LVSI), perineural invasion (PNI), and Ki-67 proliferation index (PI). Apparent diffusion coefficient (ADC) values were evaluated and compared to determine the optimal biomarker for characterization of CSCC.Materials and Methods
One hundred and forty-four CSCC patients with histopathology underwent magnetic resonance imaging (MRI), including DWI and T1 mapping on a 3T system (MAGNETOM Skyra, Siemens Healthcare, Erlangen, Germany). T1 mapping was conducted before and 5 mins after gadolinium-diethylenetriamine penta-acetic acid (Gd-DTPA) administration using a prototypic Look-Locker T1 mapping sequence (Siemens Healthcare, Erlangen, Germany). The parameters of T1 mapping included: TR/TE = 3.0/1.32ms; FA = 8°; FOV = 300 × 300 mm2; slice thickness = 5 mm; matrix = 64 × 128; 16 contrasts, and acquisition time = 96 s. Parametric T1 maps and ADC maps were generated inline after data acquisition. T1 values (T1-native and T1-post) were derived from pre- and post-contrast T1 maps. Reductions in the T1 value after contrast agent administration (ΔT1 = T1-native - T1-post) were obtained. The ECV was normalized for hematocrit and calculated from T1-pre and T1-post by using the following equation:| ECV = (1-hematocrit) × | 1 | - | 1 |
| T1-post CSCC | T1-native CSCC | ||
| 1 | - | 1 | |
| T1-post blood | T1-native blood |
One hundred and forty-three lesions were categorized as: (a) well/moderately differentiated tumors (n = 97) and poorly differentiated tumors (n = 46), (b) LVSI-positive tumors (n = 43) and LVSI-negative tumors (n=100), and (c) PNI-positive tumors (n=25) and PNI-negative tumors (n=118). Among the 143 lesions, 77 lesions underwent Ki-67 testing and were categorized as Ki-67 PI < 50% group (n=18) and Ki-67 PI ≥ 50% group (n=59). Parameter differences were assessed between different tumor characteristics. The diagnostic performances of these parameters were calculated using receiver operating characteristic (ROC) curve analyses. The correlation between T1 mapping-derived parameters (ΔT1, ECV) and ADC values was determined via Pearson's correlation analysis.
Results
The ΔT1, ECV, and ADC values were significantly different between well/moderately differentiated and poorly differentiated CSCC (all P < 0.05). Both ΔT1 and ECV were significantly higher in the LVSI-positive and PNI-positive groups than in the LVSI-negative and PNI-negative groups, respectively (all P < 0.05). However, the ADC values showed no difference between the LVSI-positive and LVSI-negative groups, or the PNI-positive and PNI-negative groups, respectively (both P > 0.05). Compared with the Ki-67 PI < 50% group, the Ki-67 PI ≥ 50% group had decreased ΔT1 and ECV, respectively (both P < 0.05). The ADC values showed no difference between the two groups (P > 0.05). The detailed results are shown in Table 1. Representative images of one patient are shown in Figure 1.The areas under the ROC curve (AUC) of ECV, ΔT1, and ADC for distinguishing between well/moderately differentiated and poorly differentiated CSCC were 0.706, 0.686, and 0.834, respectively (Figure 2a). The AUCs of ECV, ΔT1, and ADC for distinguishing the LVSI status were 0.818, 0.677, and 0.559, respectively (Figure 2b). The AUCs of ECV, ΔT1, and ADC for distinguishing PNI status were 0.746, 0.659, and 0.561, respectively (Figure 2c). The AUCs of ECV, ΔT1, and ADC for predicting Ki-67 PI ≥ 50% CSCC were 0.764, 0.691, and 0.662, respectively (Figure 2d). Pearson's correlation analysis suggested a weakly positive association between ECV and ADC (r = 0.259, P = 0.002; Figure 3a). ΔT1 values were also weakly correlated with ADC (r = 0.230, P = 0.006; Figure 3b).
Discussion
Our study found that T1 mapping may have a potential role in the noninvasive identification of adverse histological characteristics of CSCC, based on postcontrast changes in longitudinal relaxation times. Compared with ADC value quantification, T1 mapping with ECV calculation showed a higher diagnostic efficacy for identifying LVSI status, PNI status, and Ki-67 PI in our study. Moreover, ADC values could only differentiate the histological grades of CSCC, but not other histological characteristics, consistent with the findings of previous reports [3-4]. The positive correlation between T1-mapping-derived parameters (ΔT1, ECV) and ADC in our study may indicate that the two kinds of parameters both reflect the microstructure of the tumor tissue: the former is closely related to the concentration of gadolinium-based contrast agent in the extracellular space, which is associated with tumor vascularity, and the latter is closely related to water diffusion [5-6].Conclusion
T1 mapping with ECV measurement provides a novel in vivo biomarker for the prediction of poor-prognosis histological features of CSCC. Both T1 mapping-derived parameters and ADC can be used to assess the tumor grade of CSCC, but ECV and ΔT1 have advantages over ADC in the identification of LVSI status, PNI status, and Ki-67 PI.Acknowledgements
No acknowledgement found.References
[1] Adams LC, Ralla B, Jurmeister P, et al. Native T1 mapping as an in vivo biomarker for the identification of higher-grade renal cell carcinoma: correlation with histopathological findings. Invest Radiol 2019;54:118-128.
[2] Chang CC, Lin CY, Chu CY, et al. Extracellular volume fraction measurement correlates with lymphocyte abundance in thymic epithelial tumors. Cancer Imaging 2020;20:71.
[3] Wu Q, Shi D, Dou S, et al. Radiomics analysis of multiparametric MRI evaluates the pathological features of cervical squamous cell carcinoma. J Magn Reson Imaging 2019;49:1141–1148.
[4] Dappa E, Elger T, Hasenburg A, et al. The value of advanced MRI techniques in the assessment of cervical cancer: a review. Insights Imaging. 2017;8:471-481.
[5] Dappa E, Elger T, Hasenburg A, et al. Quantitative MRI of the liver: Evaluation of extracellular volume fraction and other quantitative parameters in comparison to MR elastography for the assessment of hepatopathy. Magn Reson Imaging 2021;77:7-13.
[6] Adams LC, Jurmeister P, Ralla B, et al. Assessment of the extracellular volume fraction for the grading of clear cell renal cell carcinoma: first results and histopathological findings. Eur Radiol 2019;29:5832-5843.
Figures
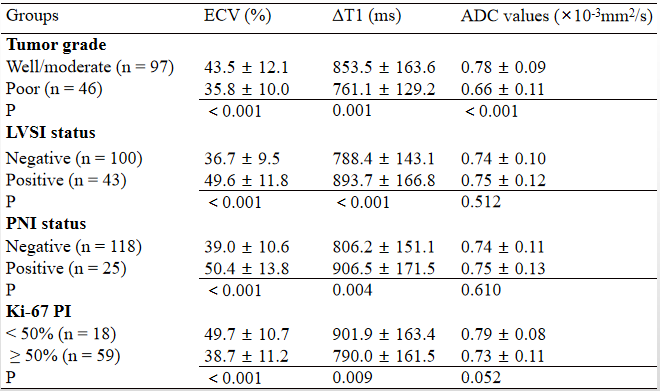
Table 1. ECV, ΔT1, and ADC in different groups of cervical squamous cell carcinoma
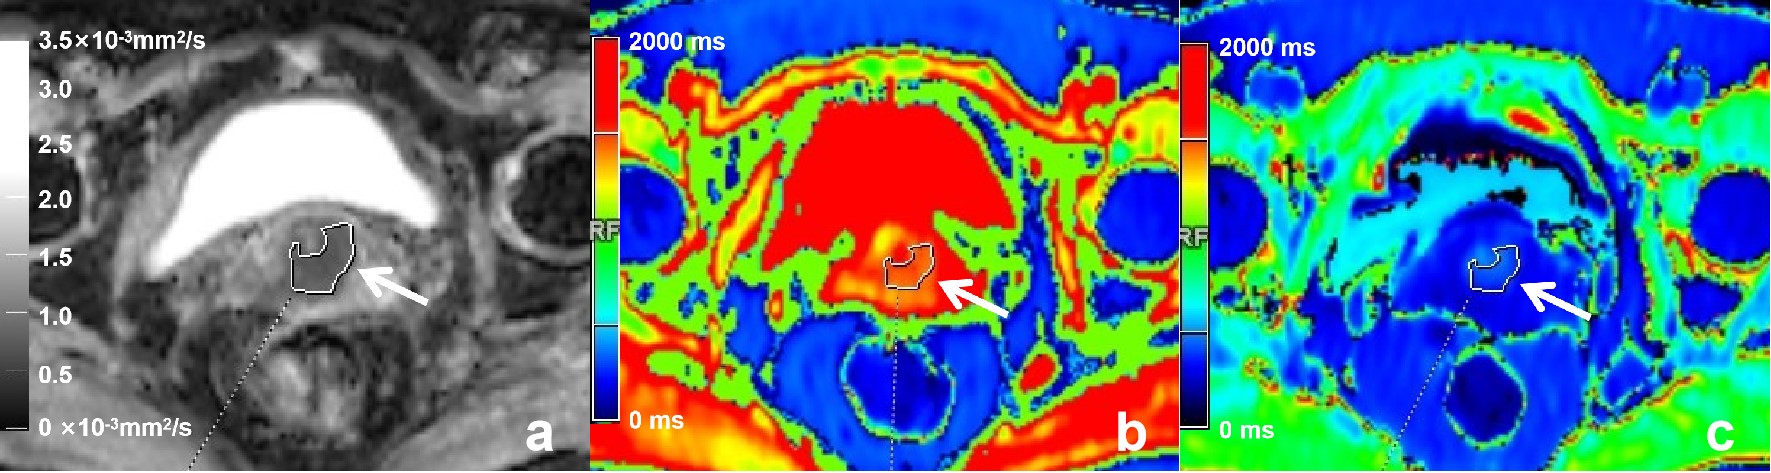
Figure 1. A 55-year-old patient with moderately differentiated cervical cancer
(a) The ADC map shows a well-defined cervical mass. (b) The native T1 map shows a relatively moderate T1 relaxation time, and (c) post-contrast T1 map shows a relatively decreased T1 relaxation time. Regions of interest (ROIs) were drawn around the tumor on each axial slice to calculate the average value of the whole tumor.
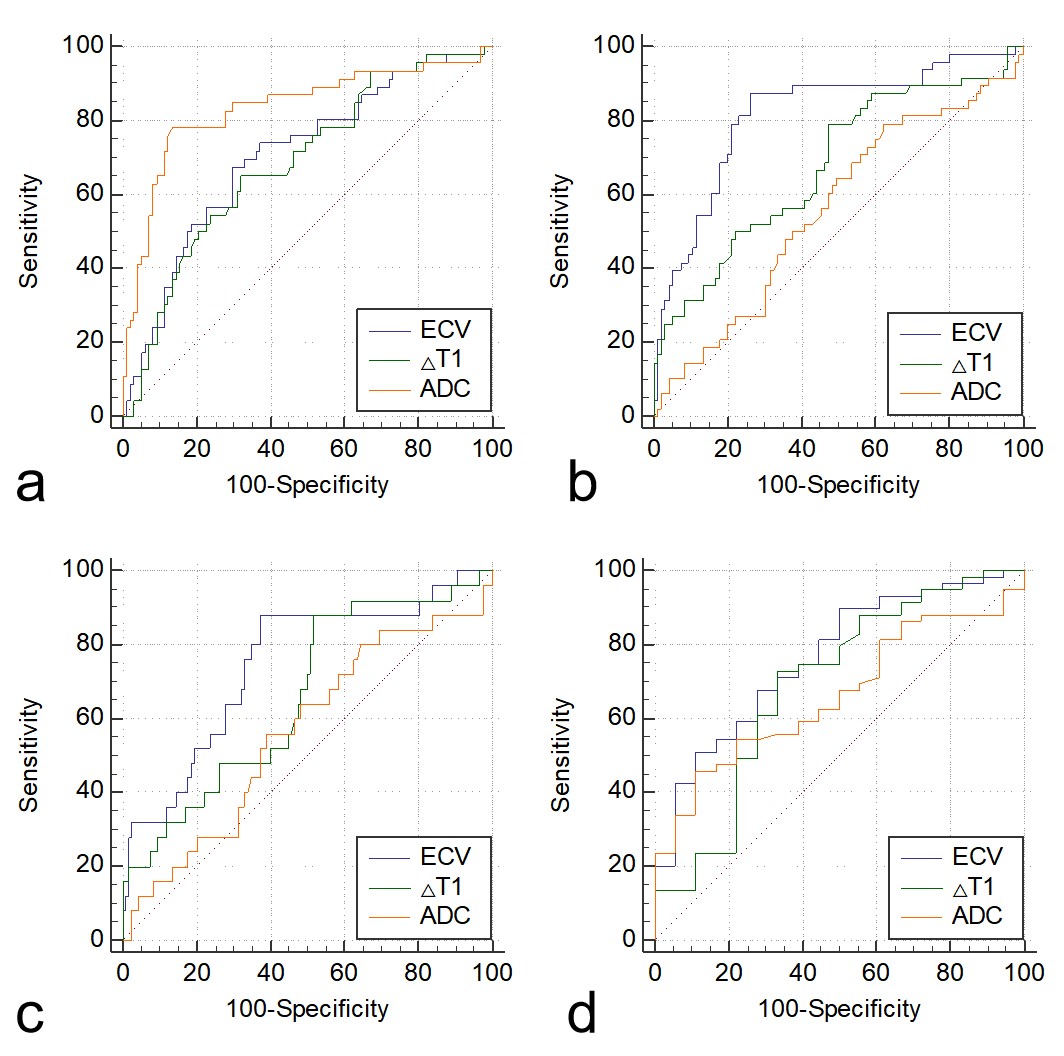
Figure 2. (a) ROC curves of ECV, ΔT1, and ADC for differentiating between well/moderately differentiated and poorly differentiated CSCC. (b) ROC curves of ECV, ΔT1, and ADC for differentiating the LVSI-positive group from the LVSI-negative group. (c) ROC curves of ECV, ΔT1, and ADC for differentiating the PNI-positive group from the PNI-negative group. (d) ROC curves of ECV, ΔT1, and ADC for differentiating between Ki-67 PI < 50% group and the Ki-67 PI ≥ 50% group.
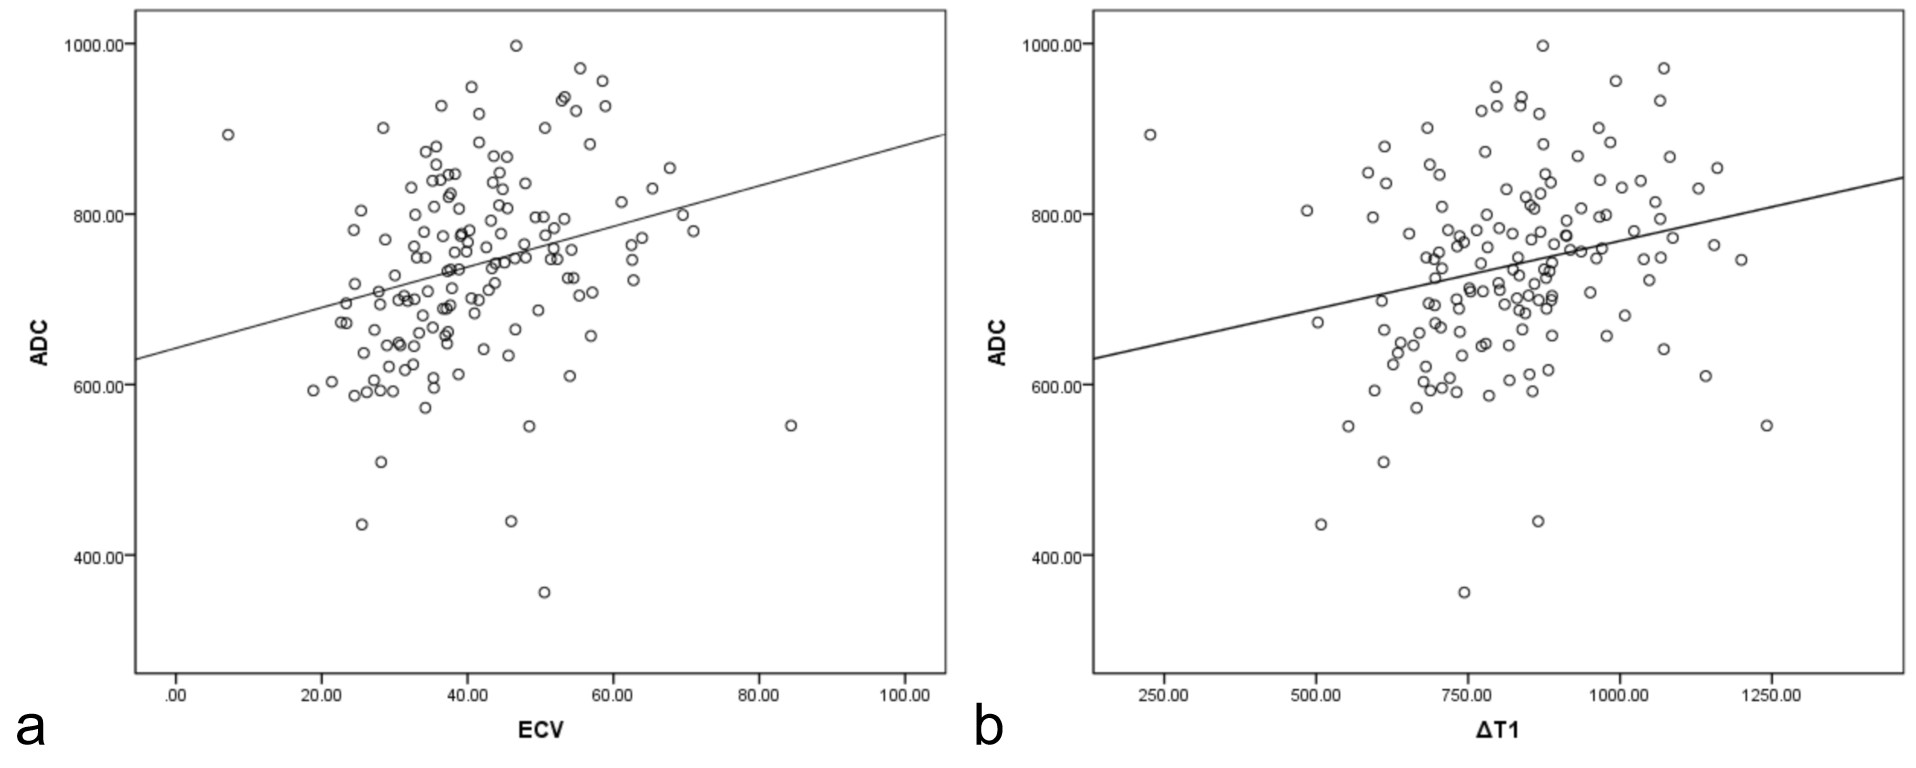
Figure 3. (a) A weakly positive correlation between ECV and ADC with a correlation coefficient of 0.259 (P = 0.002). (b) A weakly positive correlation between ΔT1 and ADC with a correlation coefficient of 0.230 (P = 0.006).