4242
T2-weighted imaging with deep learning reconstruction as an alternative method for prostate imaging: a preliminary study
Hao Cheng1, Jinxia Zhu2, Marcel Dominik Nickel3, Ming Liu4, Chunmei Li1, and Min Chen1
1Department of Radiology, Beijing Hospital, National Center of Gerontology, Institute of Geriatric Medicine, Chinese Academy of Medical Sciences, Beijing, China, 2MR Collaboration, Siemens Healthineers Ltd, Beijing, China, 3MR Application Predevelopment, Siemens Healthcare GmbH, Erlangen, Germany, 4Department of Urology, Beijing Hospital, National Center of Gerontology, Institute of Geriatric Medicine, Chinese Academy of Medical Sciences, Beijing, China
1Department of Radiology, Beijing Hospital, National Center of Gerontology, Institute of Geriatric Medicine, Chinese Academy of Medical Sciences, Beijing, China, 2MR Collaboration, Siemens Healthineers Ltd, Beijing, China, 3MR Application Predevelopment, Siemens Healthcare GmbH, Erlangen, Germany, 4Department of Urology, Beijing Hospital, National Center of Gerontology, Institute of Geriatric Medicine, Chinese Academy of Medical Sciences, Beijing, China
Synopsis
The purpose of this research is to explore the clinical performance of T2-weighted imaging with deep learning reconstruction (DL-T2WI) for prostate imaging. We compared DL-T2WI and conventional T2WI using TSE (C-T2WI) in terms of image quality, ghosting and tumor conspicuity. The results showed that compared with C-T2WI, DL-T2WI has comparable image quality, ghosting, and tumor conspicuity. The acquisition time of the complete examination using DL-T2WI is 9 minutes shorter than C-T2WI per patient, which suggests that DL-T2WI could replace C-T2WI in clinical settings, with a significantly shorter examination time.
Introduction
Prostate cancer (PCa) is the second most frequent cancer and the fifth leading cause of cancer death among men in 2020 [1]. MRI is the standard of care imaging modality for diagnosing PCa [2]. In PI-RADS v2.1, prostate MRI requires an axial plane and a minimum of one additional orthogonal T2WI plane, high b-value (>=1,400 sec/mm2) diffusion-weighted imaging (DWI), and apparent diffusion coefficient (ADC) mapping [3]. As a result, the scanning time of routine prostate MRI examination is 20-30 minutes, which is problematic especially for elderly or claustrophobic patients. Therefore, we propose to reduce scanning times with the help of a Turbo Spin-Echo (TSE) sequence with deep learning reconstruction. However, the reliability and validity of this sequence for prostatic imaging need to be evaluated and confirmed.Methods
This study included 40 patients with suspected PCa who had histologic results. All patients underwent MRI examination on a 3T MRI scanner (MAGNETOM Prisma, Siemens Healthcare, Erlangen, Germany), and the examination sequences included axial T1-weighted imaging (T1WI), sagittal, coronal, and axial T2WI using conventional TSE sequence based on PI-RADS v2.1 parameter requirements (C-T2WI), and a prototypic TSE sequence with deep learning reconstruction (DL-T2WI). DWI images were acquired using a single-shot Echo-Planar Imaging sequence (ss-EPI) with two b values of 50 and 2000 s/mm2 in 3 diffusion directions. The parametric ADC maps were generated inline after data acquisition. The detailed parameters of the imaging protocols are presented in Table 1.C-T2WI and DL-T2WI were compared for image quality, ghosting, and tumor conspicuity. We used a 5-point Likert scale to evaluate image quality and ghosting (for image quality, 1. very poor visualization of structures, 2. suboptimal visualization, 3. fair visualization 4. good visualization 5. excellent visualization; for ghosting, 1. cannot be used for diagnosis due to ghosting, 2. severe ghosting, 3. moderate ghosting, 4. mild ghosting, 5. no ghosting). A suspicious lesion was defined as a focal increase in signal intensity within the peripheral zone DWI images, decreased voxel values on the ADC map, or a lenticular, homogeneous, moderately hypo-intense focal lesion on T2W in the transition zone. Each suspicious lesion was also assessed using a 5-point Likert scale based on signal intensity compared with the surrounding normal prostate tissue (5 = excellent conspicuity). Fisher’s exact test was used to compare the image quality, ghosting, and tumor conspicuity of both T2WI protocols. A P<0.05 was regarded as significant.
Results
No significant differences in image quality were observed between C-T2WI and DL-T2WI in the axial, coronal, and sagittal planes (all P>0.05). The ghosting artifact for C-T2WI and DL-T2WI also had no significant difference in the axial, coronal, and sagittal planes (all P>0.05). Among the 40 patients, 26 suspicious lesions were found (8 lesions were benign prostatic hyperplasia, and 18 lesions were PCa). No significant differences in lesion conspicuity were evidenced between C-T2WI and DL-T2WI in all orientations (all P>0.05). Detailed results are shown in Table 2. However, the scanning time of the protocol using DL-T2WI were 9min33s per patient, where significantly reduced by approximately 9 minutes per patient compared with C-T2WI.Discussion and Conclusions
This was a prospective study comparing DL- T2WI and C-T2WI in imaging of the prostate. The results showed no significant differences in image quality, ghosting, or tumor conspicuity between C-T2WI and DL-T2WI. However, DL-T2WI significantly reduced the scanning time compared with C-T2WI. DL-T2WI has the potential to replace C-T2WI, with significantly decreased acquisition times and no penalties in image quality, ghosting, and tumor conspicuity.Acknowledgements
No acknowledgement found.References
1. Sung, H., et al., Global Cancer Statistics 2020: GLOBOCAN Estimates of Incidence and Mortality Worldwide for 36 Cancers in 185 Countries. CA Cancer J Clin, 2021. 71(3): p. 209-249.2. Ahmed, H.U., et al., Diagnostic accuracy of multi-parametric MRI and TRUS biopsy in prostate cancer (PROMIS): a paired validating confirmatory study. The Lancet, 2017. 389(10071): p. 815-822.
3. Turkbey, B., et al., Prostate Imaging Reporting and Data System Version 2.1: 2019 Update of Prostate Imaging Reporting and Data System Version 2. Eur Urol, 2019. 76(3): p. 340-351.
Figures
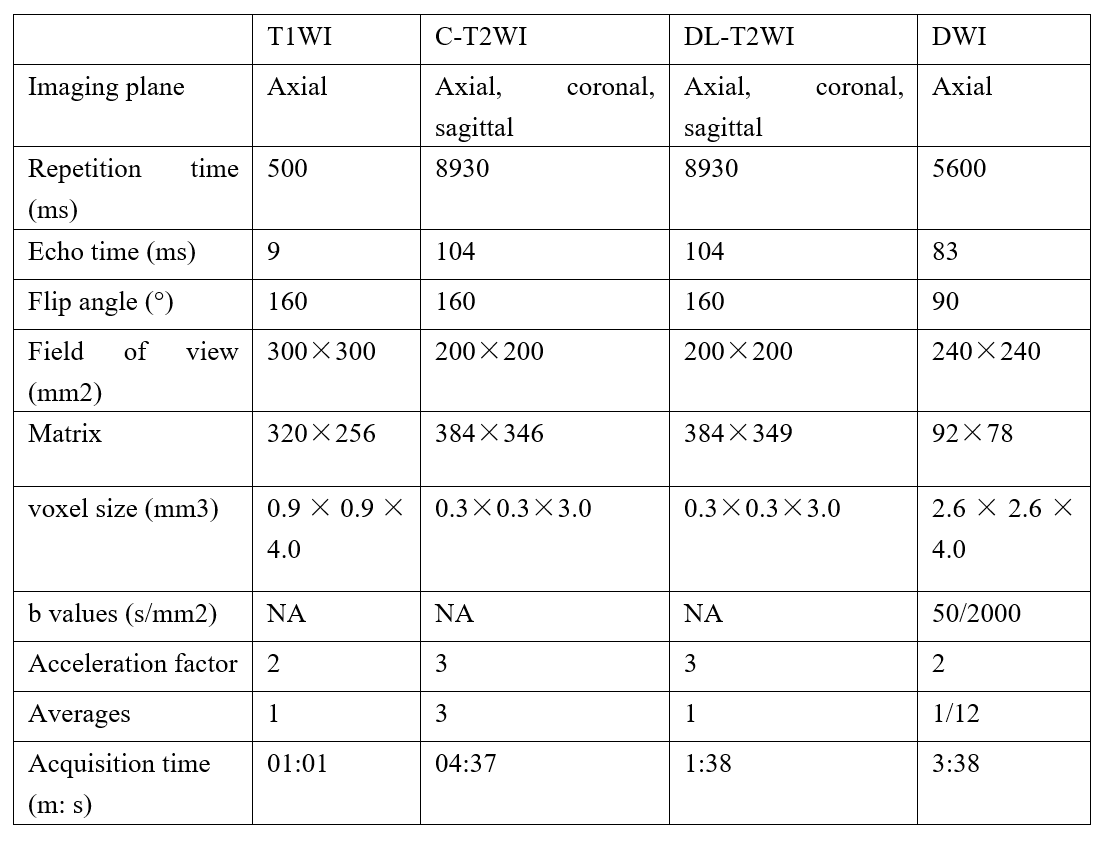
Table 1. Imaging parameters
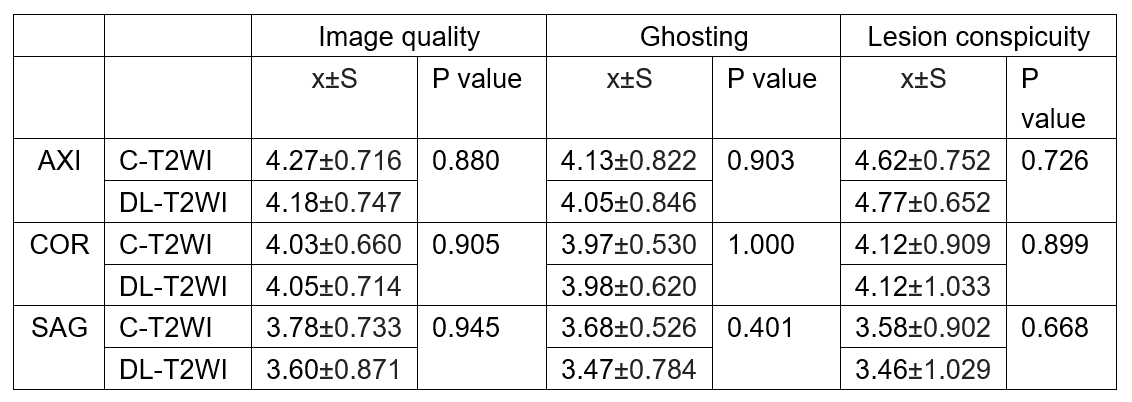
Table
2. Image quality,
ghosting and lesion conspicuity scores with C-T2WI and DL-T2WI
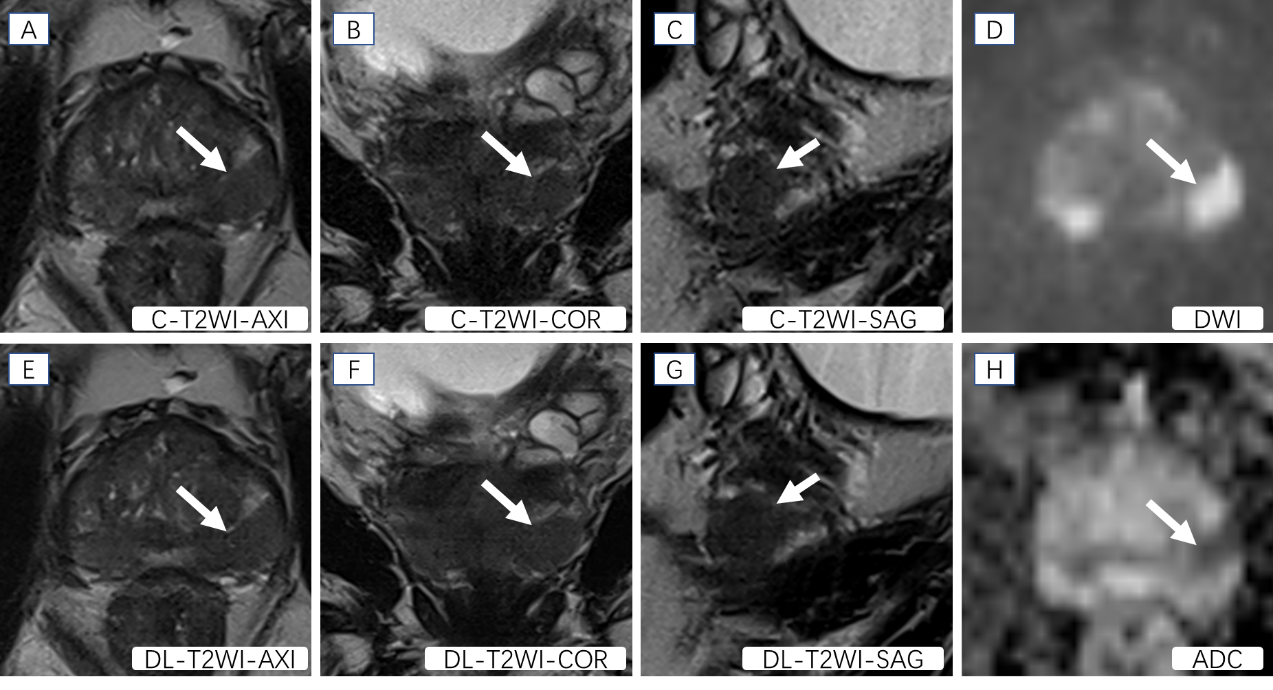
Figure 1. Presentative images of a patient with a PCa lesion (Gleason score: 4+3). The T2-weighted MRI images (A, B, C, E, F, G) show hypointense signals in lesions arising in the peripheral zone (white arrows). DWI (D) shows a hyperintense signal and ADC (H) shows a hypointense signal in this location (white arrow).
DOI: https://doi.org/10.58530/2022/4242