4241
The differential value of the combination of DWI and T2 mapping in the identification of prostatic hyperplasia from prostatic cancer.1the First Affiliated Hospital of Dalian Medical University, Dalian, China, 2Philips Healthcare, Beijing, China
Synopsis
DWI plays an important role in the diagnosis of prostate cancer by detecting water molecules diffusion noninvasively, which reflects the microstructure of tumor tissue. However, only DWI might be limited by low sensitivity and specificity. T2 mapping imaging is a quantitative imaging technology to map the transverse relaxation time of tissues with good repeatability and stability. T2 mapping is also sensitive to tissue components (such as edema, fibrosis) without a contrast agent. This study aims to differentiate prostate cancers from hyperplasia by combining DWI and T2 mapping.
Summary of main finding
The combination of DWI and T2 mapping might be a non-invasive tool for differential diagnosis of prostate cancers and hyperplasia, which yields high diagnostic accuracy.Purpose
To explore the potential of DWI and T2 mapping for differential diagnoses of prostate cancer and hyperplasia.Introduction
Precise diagnosis of prostate cancer and hyperplasia is very important for the prognosis and treatment planning of patients. Tumor tissues of prostate cancer usually show low signal on T2WI and a high signal on DWI due to low ADC values compared with normal or benign tissue[1]. However, other benign diseases, such as prostatitis, benign prostatic hyperplasia, might also have similar manifestations with prostate carcinoma, which decreases the sensitivity and specificity of DWI. T2 mapping is a quantitative MRI technique for mapping transverse relaxation time, a sensitive marker of tissue components (such as edema, fibrosis) [2] . The combination of DWI and T2 mapping might enhance the differential diagnosis of prostate lesions. This study aims to explore the diagnosis performance of DWI and T2 mapping on differentiating prostate cancer from hyperplasia.Materials and Methods
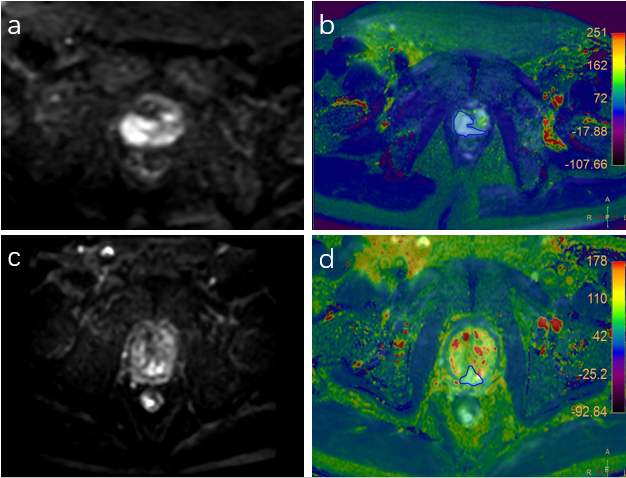
This study was approved by the institutional IRB. A total of 64 patients with pathology-proven prostate cancer and hyperplasia were included. The patients were categorized into two groups, group A(n=37) with prostate cancer and group B(n=27)with prostate hyperplasia. All MRI examinations were scanned at 3.0T Ingenia CX (Philips Healthcare, the Netherlands) with a 16-channel abdominal coil. The acquired data were transferred to the IntelliSpace Portal workstation (Philips Healthcare) and interpreted independently by two radiologists (3 and 4 years of experience). Regions of interest (ROIs) were manually placed on the fused DWI and T2 mapping images on the slice with the largest lesions (Figure 1). The average values of the measured ADC and T2 of lesions were calculated. The inter-observer consistency of ADC and T2 measurement between the two observers was tested using intra-class correlation coefficients (ICC) with SPSS (IBM). The values of ADC and T2 were compared between groups A and B using the Mann-Whitney U test or ttest. Logistic regression and ROC plots were used to evaluate the diagnostic efficiency of DWI and T2 mapping on prostate cancers and hyperplasia. Delong test was used to compare the diagnostic efficacy.Results
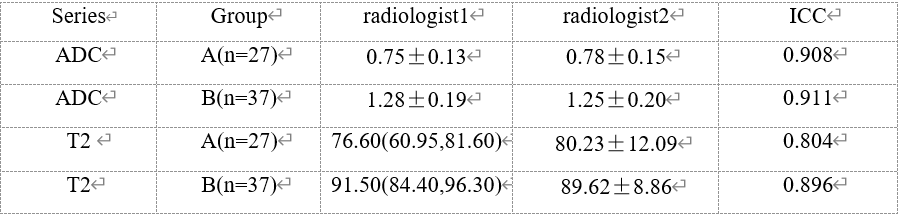
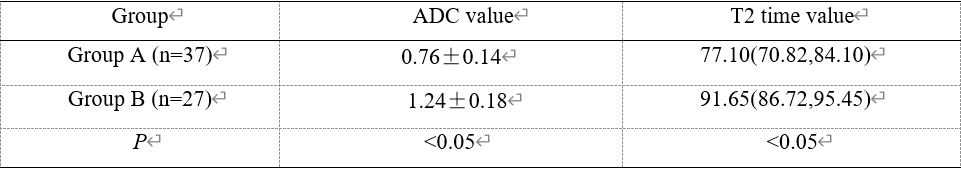
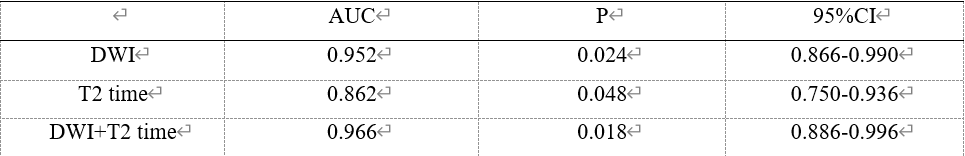
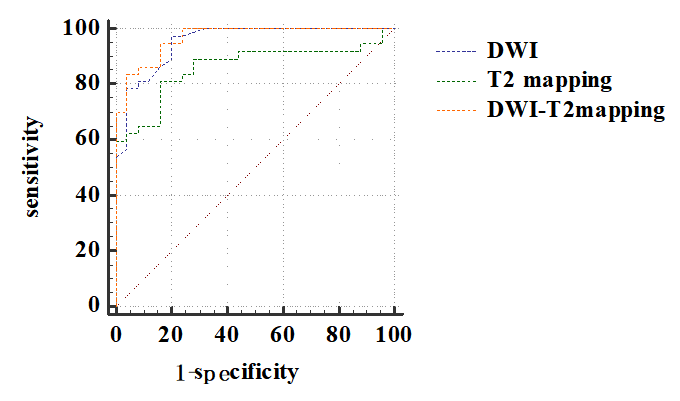
Measurements of the two observers were in good agreement (Table 1). The values of ADC and T2 of group A were significantly lower than in group B (P<0.05) (Table 2). The AUCs of DWI, T2 mapping, and the joint use of the two methods were all larger than 0.8. The combination of DWI and T2 mapping showed the highest accuracy on differentiating prostate cancers and hyperplasia (Table 3, Figure 2). From the ROC curve, the AUC of the joint use of DWI and T2 mapping is 0.966, with a sensitivity of 83.78% and a specificity of 96%Discussion and Conclusion
Prostate cancer was observed with lower ADC and T2 values than hyperplasia, which might be due to the increased tumor cell density and decreased water content. These changes in tissue microstructure alter the water molecular motion and proton relaxation properties. The intrinsic relationship between DWI and T2 mapping might enhance the diagnosis performance by combining the two methods. In conclusion, the combination of DWI and T2 mapping is a potential non-invasive tool to differentiate prostate cancers and hyperplasia, which could help the clinical diagnosis of prostate abnormalities and patient management.Acknowledgements
No acknowledgement found.References
[1].Fei Zhou, Guochao Wang, Yue Cao.Application of MRI Diffusion Weighted Imaging in the Diagnosis and Differentiation of Prostatic Hyperplasia and Prostate Cancer[J].Chinese Journal of CT and MRI,2020,18(09):149-151.
[2] Timo Alexander Auer, Maike Kern, Uli Fehrenbach. T2 mapping of the peritumoral infiltration zone of glioblastoma and anaplastic astrocytoma. The Neuroradiology Journal , 2021, , Vol. 34(5)
Figures