4239
Non-rigid registration of DIXON images is an accurate method for calculating physiological strain in adipose tissue1NeuRA, Sydney, Australia, 2School of Medical Sciences, University of New South Wales, Sydney, Australia, 3Graduate School of Biomedical Engineering, University of New South Wales, 2052, Australia, 4Faculty of Medicine, University of New South Wales, Sydney, Australia
Synopsis
To accurately map the large deformation properties of soft
tissues, accurate, in-vivo measurements of internal strain are essential. In
this study, the Right Cauchy Green strain of adipose tissue was calculated from
displacements generated through the non-rigid registration of mDIXON images
under increasing compression. The method was validated by synthetically deforming
an uncompressed image with compression. Five real-world datasets were acquired of
adipose tissue under increasing compression, which resulted in significant
increases in the maximum principal strain (one-way ANOVA, p<0.001). The
described method provides an accurate quantification of physiological strains
in adipose tissue that is essential for mapping strain-varying viscoelasticity.
Introduction
The mechanical properties of biological soft tissues such as adipose tissue are known to vary with strain, non-linearly1,2. In order to accurately map the nonlinear, strain-varying mechanical properties of such tissues, the internal strain resulting from physiological deformations such as compression or indentation must be captured alongside measurements of viscoelasticity. Mapping the mechanical characteristics of adipose tissue under load will help, for example, understand pressure ulcer formation or the development of realistic surgical simulations. However, deformation tracking methods that have been well validated in skeletal muscle such as MR-tagging3, do not perform well in adipose tissue due to the shortened T1 relaxation time of fat compared with muscle4. This study aimed to use the magnetic resonance (MR) imaging technique of DIXON imaging5 to generate fast, high-resolution, structural images of adipose tissue under increasing levels of compression. The images were registered using a non-rigid registration algorithm, and the resultant Right Cauchy Green strain (the variety of strain dealing with large deformations) was calculated. It was expected that increasing compression would correspond to increasing levels of strain.Methods:
Scanning protocol:The right buttocks of participants (n = 5F, 41±9.7 years) were imaged on a 3-Tesla Philips Ingenia CX scanner (Philips Healthcare, Best, The Netherlands). A representation of the testing apparatus can be seen in Figure 1. Subjects lay prone underneath an acrylic frame to which a compression plate was rigidly mounted, positioned tangentially to the surface of the buttock. A single, 20cm radius Flex transmit-receive imaging coil was positioned around the compression plate. Four compression levels were selected: C0 (no compression), C1 (~9mm compression), C2 (~18mm compression) and C3 (~27mm compression). At each compression level, mDIXON imaging (T1FFE, 192x192x102 mm FOV, 51 slices, 288x288 matrix, TR/TE1/TE2 = 3.77/1.19/2.37 ms) was acquired. The out-of-phase image volume was selected for analysis as this provided the most structural landmarks within the adipose tissue. To validate the method, a sample undeformed scan was synthetically deformed by compressing the image anteriorly in an increasing manner of 10% at each compression level.
Registration method:
Three-dimensional non-rigid registration (imregdemons6; 700 iterations, 5 pyramid levels, AFS = 2; Matlab2020b, MathWorks) was performed between consecutive images to deform each volume to the volume captured at the next compression level (e.g. C0→C1, C1→C2, C2→C3). A median filter [7x7 kernel] was used to smooth the 3D displacements of each slice. The displacements from the C1→C2 registration were interpolated according to the displacements from the previous segment (C0→C1), and the cumulative displacement fields C0→C2 calculated. These displacements were used to interpolate the C2→C3 displacements, and the resultant cumulative displacements C0→C3 determined.
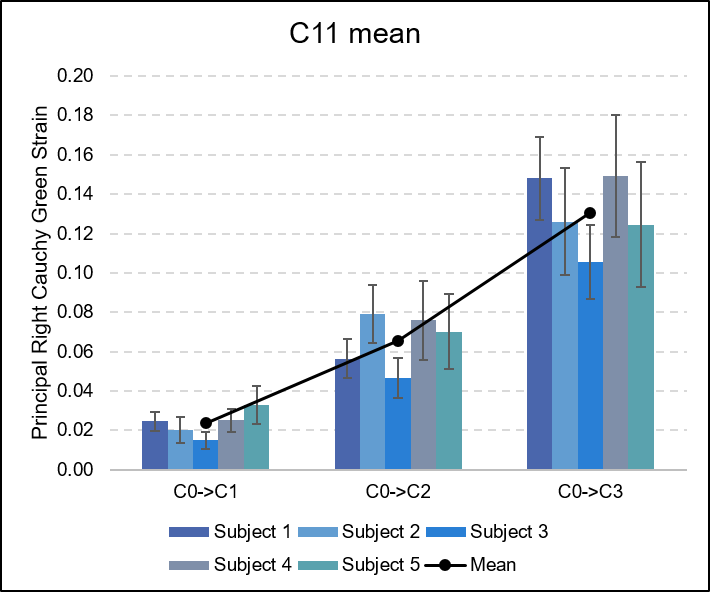
Displacement field gradients were calculated and combined to form the deformation gradient tensor F. The Right Cauchy Green strain tensor was calculated as C = FT.F. from which the maximum principal strain (C11) was calculated as the maximum eigenvalue of C. The mean principal strain inside a region of interest in the adipose tissue was compared between compression levels.
To gauge the reliability of the maximum principal strain measurements, the absolute difference between the ground truth C11 and the C11 calculated from the displacement fields resulting from non-rigid registration was calculated. Additionally, one-way ANOVA tests were performed to compare the effect of increasing compression on the maximum principal Right Cauchy Green strain (C11) measurements within the adipose tissue ROIs of the real-world data.
Results
An example of the registration result for synthetic and real-world data examples can be seen in Figure 2, while Figure 3 depicts the output C11 measurements for a sample participant at increasing degrees of compression.The maximum principal strain (C11) calculated from the ground truth displacements and those obtained through registration were highly similar: the absolute difference was 1.62E-06 for C0→C1, 1.02E-05 for C0→C2, and 1.38E-05 for C0→C3. Increasing compression resulted in a significant increase in maximum principal strain C11 (one-way ANOVA, p<0.0001). Tukey’s HSD Test for multiple comparisons found that the mean value of C11 were significantly different between all groups, increasing with increasing compression (p<0.001).
Discussion
Non-rigid registration of mDIXON images captured under increasing static loads provides accurate measurements of strain in adipose tissue. The technique can be used alongside other imaging methods such as MR elastography to map strain-varying mechanical properties such as viscoelasticity.Acknowledgements
No acknowledgement found.References
1. Comley, K. & Fleck, Norman. (2008). The High Strain Rate Response of Adipose Tissue. 10.1007/978-1-4020-9404-0_4.
2. Samani A, Bishop J, Luginbuhl C, Plewes DB. Measuring the elastic modulus of ex vivo small tissue samples. Phys Med Biol. 2003 Jul 21;48(14):2183-98. doi: 10.1088/0031-9155/48/14/310. PMID: 12894978.
4. . Musculoskeletal MRI at 3.0 T: relaxation times and image contrast. AJR Am J Roentgenol 2004;183(2):343–351.
5. Dixon WT. Simple proton spectroscopic imaging. Radiology. 1984 Oct;153(1):189-94. doi: 10.1148/radiology.153.1.6089263. PMID: 6089263.
6. Vercauteren T,
Pennec X, Perchant A, Ayache N. Diffeomorphic demons: efficient non-parametric
image registration. Neuroimage. 2009 Mar;45(1 Suppl):S61-72. doi:
10.1016/j.neuroimage.2008.10.040. Epub 2008 Nov 7. PMID: 19041946.
Figures
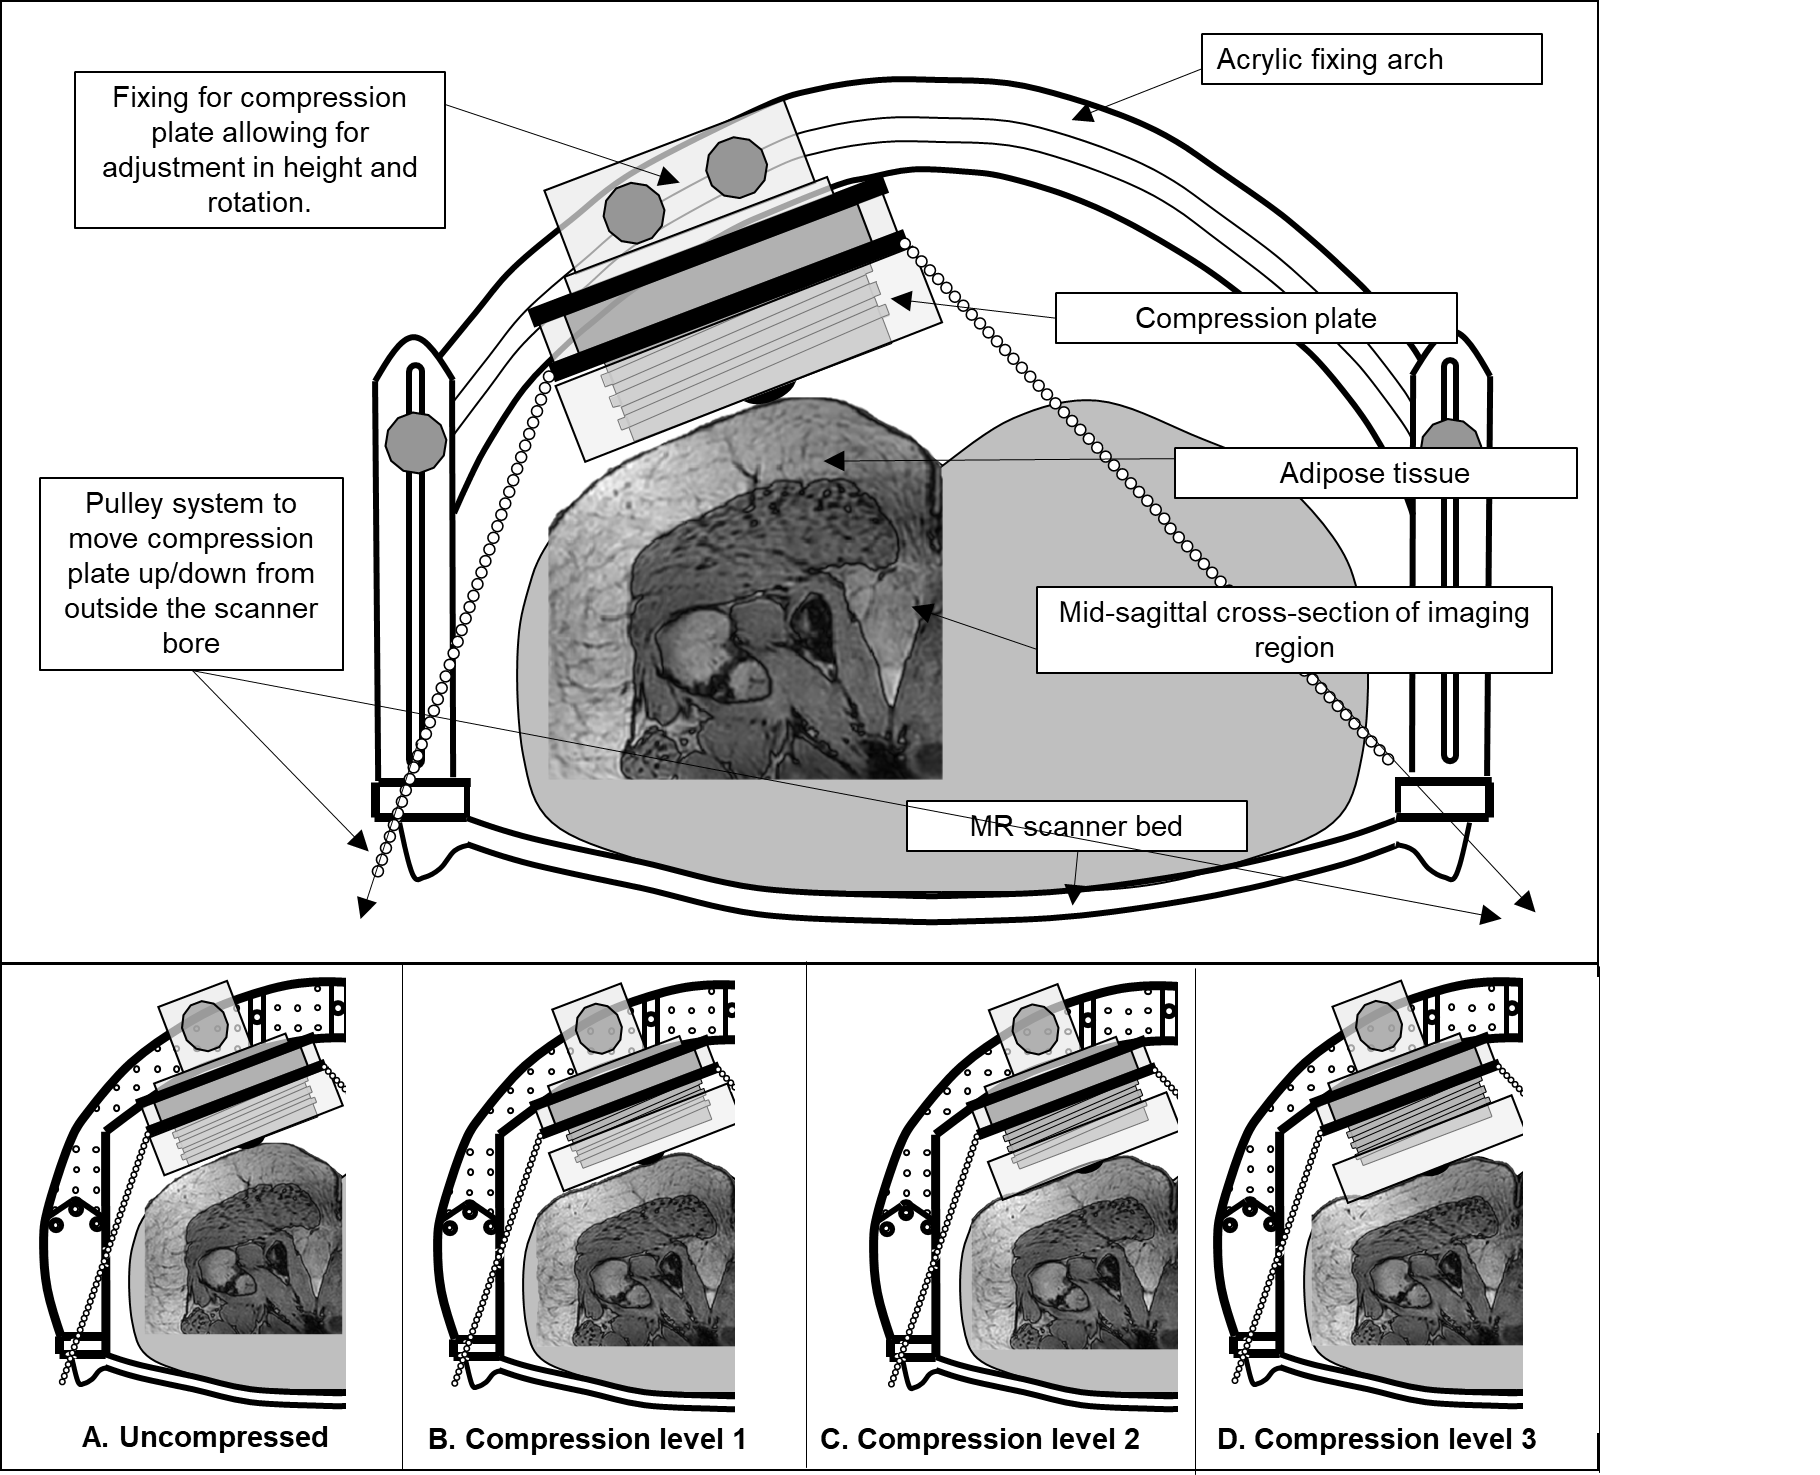
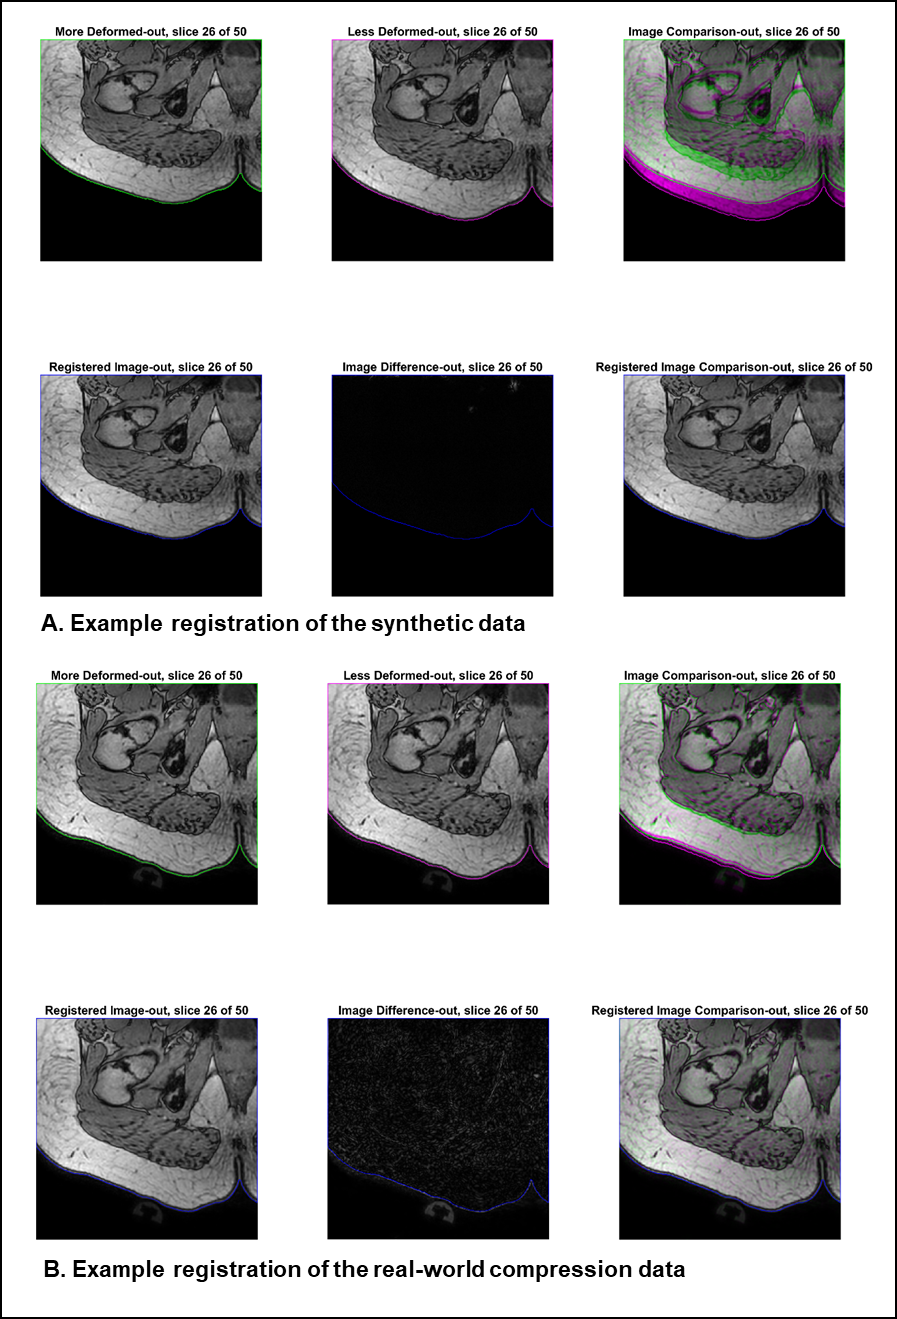
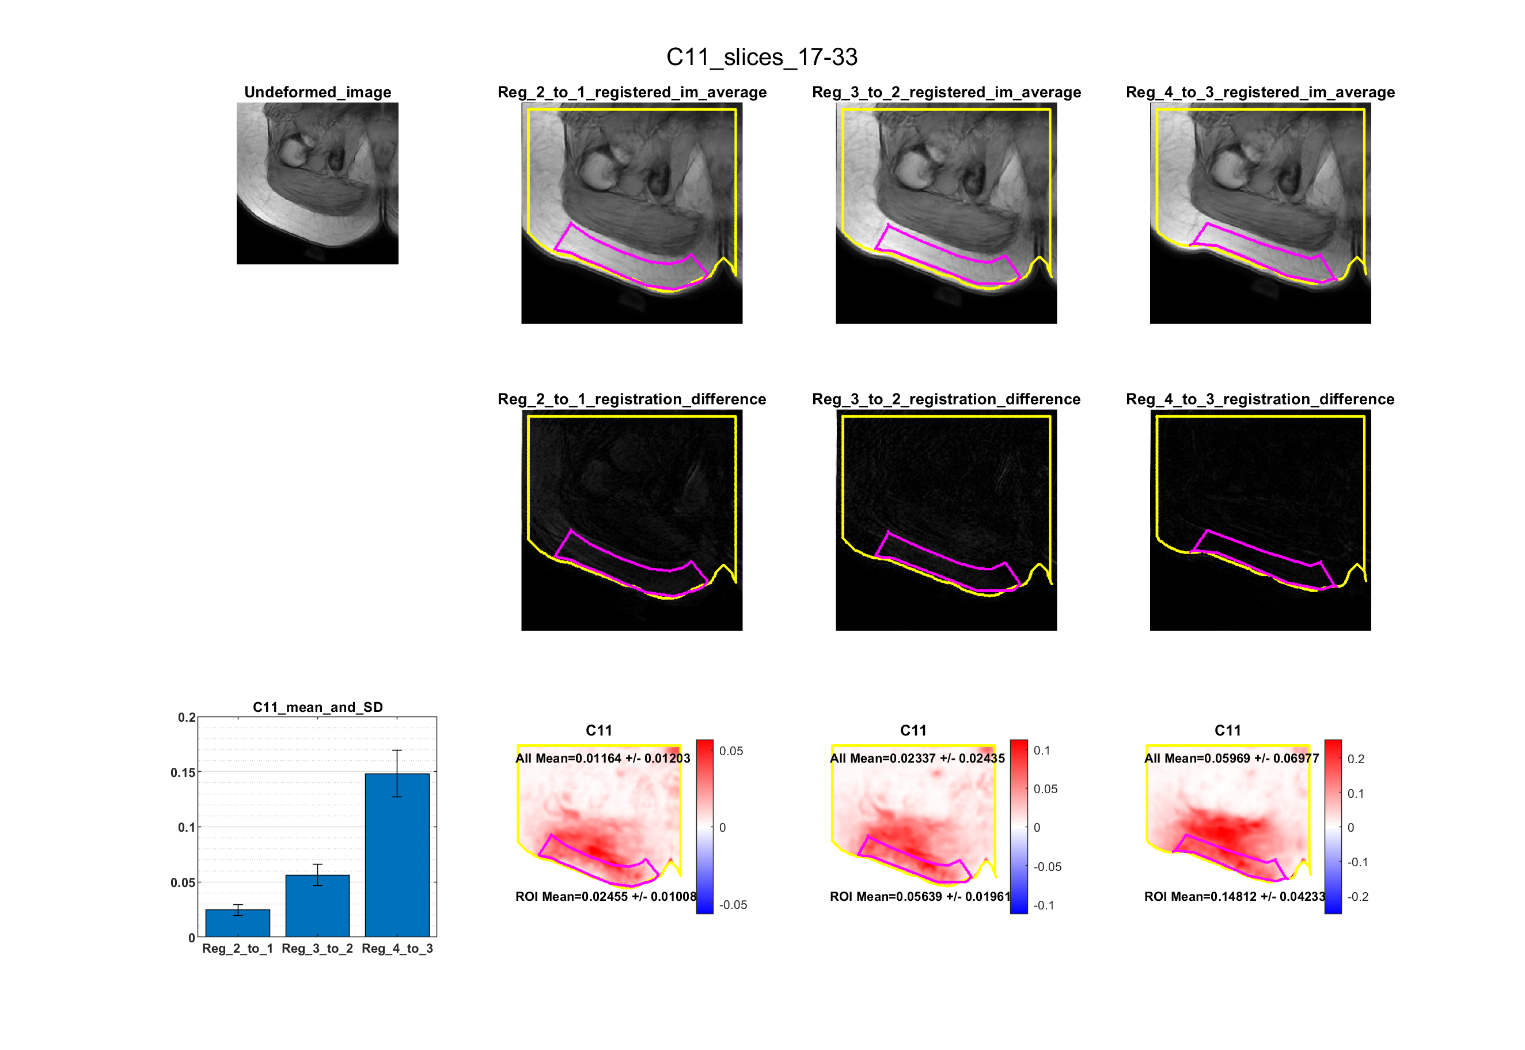
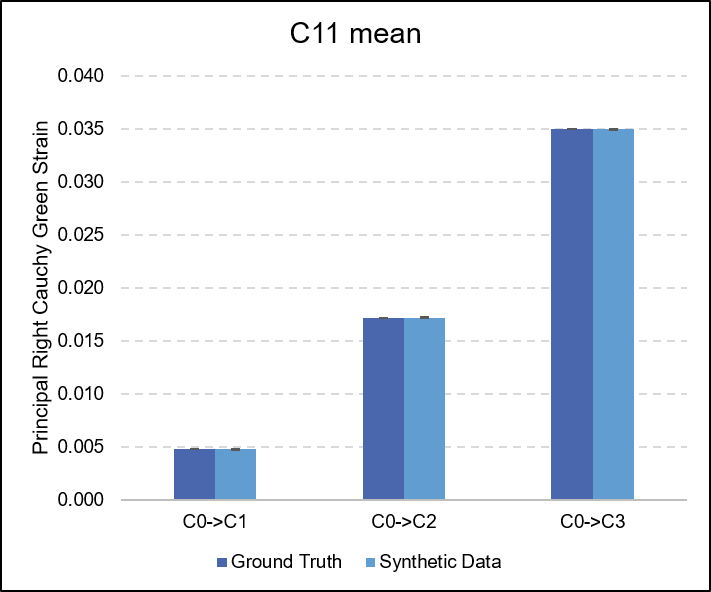
Figure 4. Comparison of the maximum principal Right Cauchy Green strain (C11) measurements that were obtained from the ground truth displacements, and those output from the non-rigid registration. High accuracy was observed, with absolute differences of 1.62E-06 for C0→C1, 1.02E-05 for C0→C2, and 1.38E-05 for C0→C3 measured.