4237
Alterations of renal function in patients with diabetic kidney disease: A BOLD and DTI study1Nephrology, Zhongnan Hospital of Wuhan University, Wuhan, China, 2Radiology, Zhongnan Hospital of Wuhan University, Wuhan, China, 3GE Healthcare, Beijing, China
Synopsis
Renal damage varies in patients with diabetic kidney disease (DKD). Our study aims to determine the patterns of renal oxygenation changes and microstructural changes by blood oxygenation level-dependent magnetic resonance imaging (BOLD-MRI) and diffusion tensor imaging magnetic resonance imaging (DTI-MRI) with the deteriorating kidney function.
Introduction
Diabetics usually accompanies complications, including the nerves, eyes, kidneys, and cardiovascular system. It has reported that the occurrence of diabetic kidney disease (DKD) as one of the main complications is on the increase and the malfunction degree varies in DKD patients. It is essential to assess kidney damage in DKD patients via a non-invasive and intuitive method. Therefore, our study aimed to determine the patterns of renal oxygenation changes and microstructural changes in the deteriorating kidneys via blood oxygenation level-dependent magnetic resonance imaging (BOLD-MRI) in estimation of oxygenation level and diffusion tensor imaging magnetic resonance imaging (DTI-MRI) in evaluation of microstructural alterations.Materials and Methods
Forty-two patients with type 2 diabetes mellitus (DM) and thirteen healthy controls (HCs) underwent MR examination including BOLD and DTI on 3.0-Tesla MR machine (Signa 750w, GE Healthcare, USA). Further, DM patients were grouped into three different subgroups [DI, DII, and DIII based on their estimated glomerular filtration rate (eGFR)] and 10 patients with nondiabetic kidney disease (NDKD). All participants underwent MRI scans after fasting for 4 hours. Prior to the MRI scan, we assessed their clinical characteristics, including the body mass index (BMI), hemoglobin (HGB), eGFR, serum creatinine (SCr), blood urea nitrogen (BUN), urinary microalbumin (uALB), cystatin C (Cys C) and hemoglobin A1c (HbA1c) levels. Regions of interest (ROIs) were drawn in the renal medulla and cortex by two experienced radiologists to obtain R2*, fractional anisotropy (FA) and apparent diffusion coefficient (ADC) values on GE AW Workstation. One-way ANOVAs with Bonferroni correction were used to test difference of R2*, ADC,FA values among groups as well as D-values (Δ, the measured medulla value - the corresponding cortical value) and MC ratios (MCR, the measured medulla value divided by the corresponding cortical value) of R2* and FA across groups and subgroups. Pearson correlations were also computed between the MRI parameters and clinical indices of renal function.Results
Compared with the HC and DM group, R2* and FA values of the renal medulla were significantly decreased in the DKD group. ΔR2* between the DKD group and the DM group/HC group was higher than that between DM group and HC group. In addition, ΔFA and MCR of R2* between the DKD group and HC group were greater than any other two groups. The R2* and FA values of the medulla were negatively associated with the SCr and Cys C values and were positively associated with the eGFR. The ADC values showed no significant alterations in DKD groups.Discussion and Conclusions
In our study, altered renal oxygenation and microstructural changes was found in DKD and NDKD patients. BOLD and DTI could capture declining renal function, including the decreased medullary R2*, medullary FA and cortex-medullary differentiation in DKD patients. The increased changes of oxygenation level and microstructure in kidneys accompanied as the decreased glomerular filtration level. Moreover, BOLD seemed more sensitive than DTI when detecting the cortex-medullary differentiation in DKD patients.Acknowledgements
Funding: This study has received funding by the Wuhan University Zhongnan Hospital Medical Science and Technology Innovation Platform Construction Support Project in China (grant no.PTXM2021035 and no. PTXM2020028). This work is also supported by National Key Research and Development Program of China (Grant N0. 2017YFC0108803) and the National Natural Science Foundation of China (Grant No. 81771819).References
1. ZHANG L, LONG J, IANG W, et al. Trends in chronic kidney disease in China[J]. N Engl J Med, 2016, 375(9): 905-906.
2. Eckardt KU, Bernhardt WW, Weidemann A, et al. Role of hypoxia in the pathogenesis of renal disease. Kidney Int 2005;68:S46–51.
3. Hueper K, Hartung D, Gutberlet M, Gueler F, Sann H, Husen B, Wacker F, Reiche D (2012) Magnetic resonance diffusion tensor imaging for evaluation of histopathological changes in a rat model of diabetic nephropathy. Invest Radiol 47(7):430-7.
4. Gloviczki ML, Glockner J, Gomez SI, et al. Comparison of 1.5 and 3 T BOLD MR to study oxygenation of kidney cortex and medulla in human renovascular disease. Invest Radiol 2009;44(9):566–71.
5. Razek, A.A.K.A., Al-Adlany, M.A.A.A., Alhadidy, A.M. et al (2017) Diffusion tensor imaging of the renal cortex in diabetic patients: correlation with urinary and serum biomarkers. Abdom Radiol 42, 1493–1500.
6. Yin WJ, Liu F, Li XM, et al. Noninvasive evaluation of renal oxygenation in diabetic nephropathy by BOLD-MRI[J]. Eur J Radiol, 2012, 81(7): 1426-1431.
7. dos-Santos EA, Li LP, Ji L, et al. Early changes with diabetes in renal medullary hemodynamics as evaluated by fiberoptic probes and BOLD magnetic resonance imaging. Invest Radiol, 2007, 42(3): 157-162.
8. Feng YZ, Ye YJ, Cheng ZY, Hu JJ, Zhang CB, Qian L, Lu XH, Cai XR (2020) Non-invasive assessment of early stage diabetic nephropathy by DTI and BOLD MRI. Br J Radio 93(1105):20190562.
9. FENG Q,MA Z J,WU J L,et al. DTI for the assessment of disease stage in patients with glomerulonephritis- correlation with renal histology[J]. Eur Radiol,2015,25(1):92- 98.
10. Lu L, Sedor JR, Gulani V, Schelling JR, O'Brien A, Flask CA, MacRae Dell K. (2011) Use of diffusion tensor MRI to identify early changes in diabetic nephropathy. Am J Nephrol 34(5):476-82.
Figures

There was no statistically significant difference in sex, age or BMI among the HC group and the three diabetic subgroups. The HbA1c values in the three diabetes subgroups showed no difference. The mean eGFR of the DI group (115.25±16.25 mL/min/1.73 m2) was slightly higher than that of the HC group (109.49±9.70 mL/min/1.73 m2)(p> 0.05). One-way ANOVAs showed that the values of HGB, SCr, BUN, uAlb and Cys C were all significantly different among the three diabetes subgroups and the differences were mainly lied between the DI group and the DII/DIII group (p< 0.05).
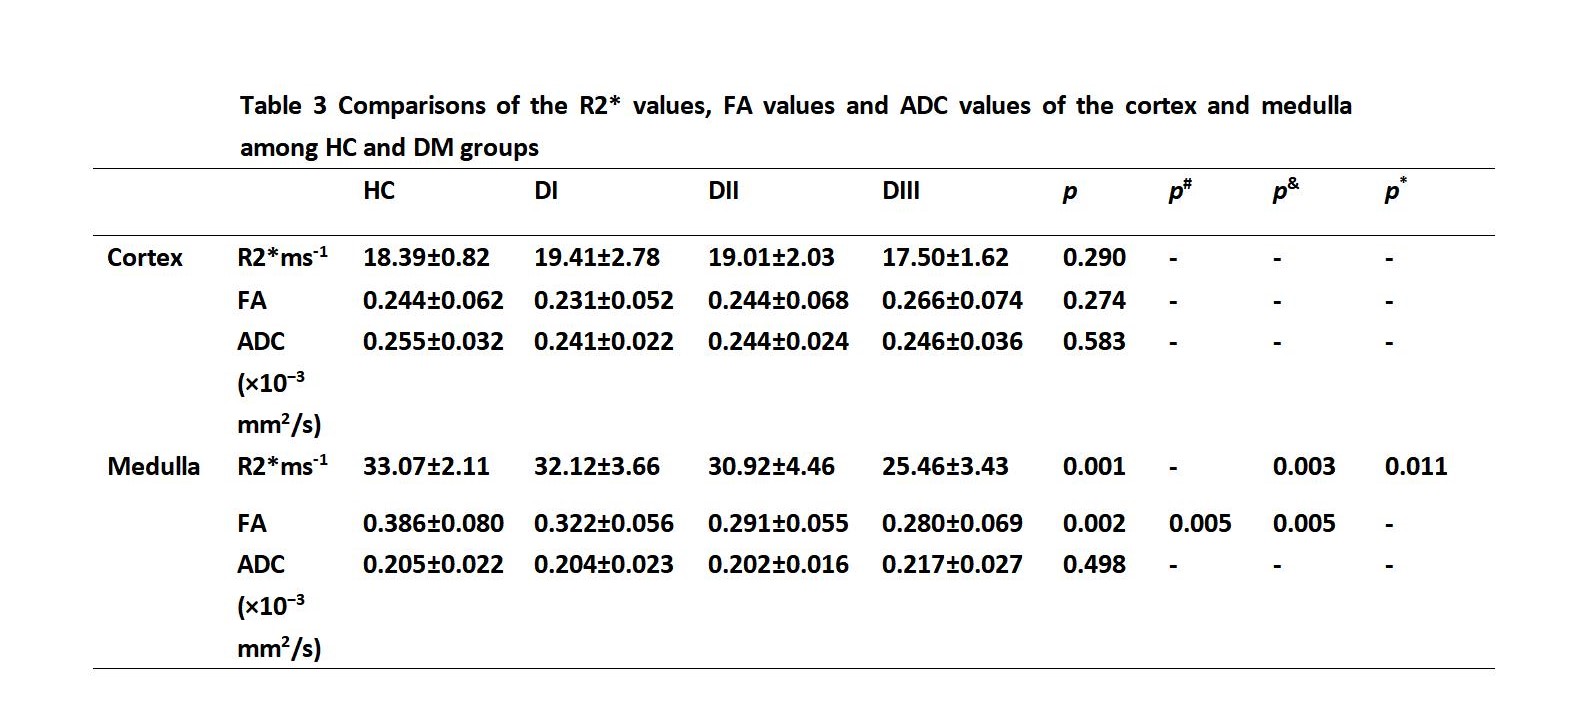
The R2* , FA and ADC values of the cortex were not significantly different among the HC group and the three diabetes subgroups (p>0.05). Medullally R2* values in both HC and DI group were significantly higher than those in the DIII group (p= 0.003, p= 0.011). Medullally FA values in the HC group were higher than those in the DII and DIII group (p= 0.005, p= 0.005). Medullally ADC values showed no significant difference among the HC group and the DI, DII, and DIII group.
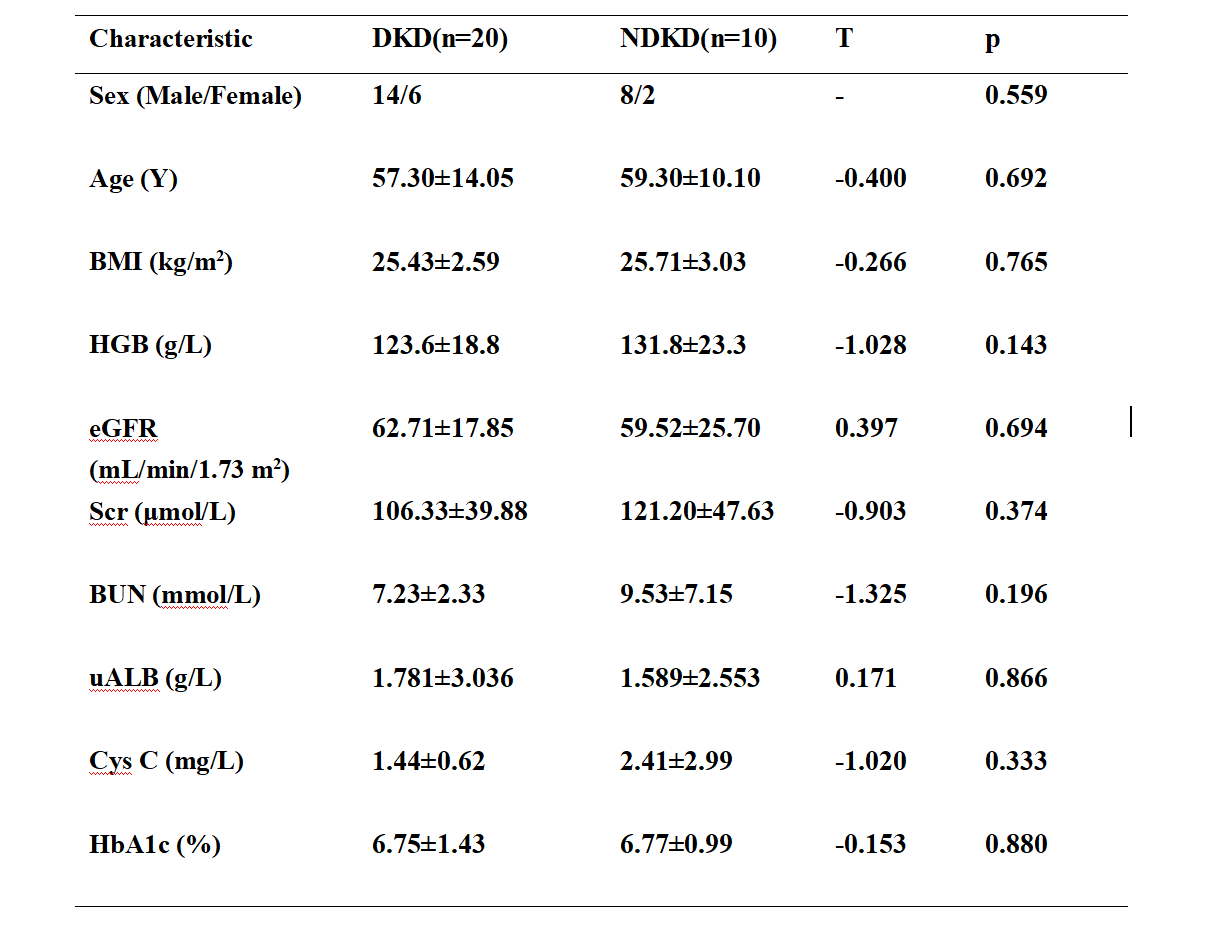
There was no significant difference in sex, age, or clinical data (including HGB, BMI, eGFR, BUN, HbA1c, uAlb and Cys C) between the DKD group (30 ml/min/1.73 m2 < eGFR < 90 ml/min/1.73 m2) and the NDKD group.

We found no difference in R2*, FA and ADC values between the DKD group and NDKD group (p>0.05).
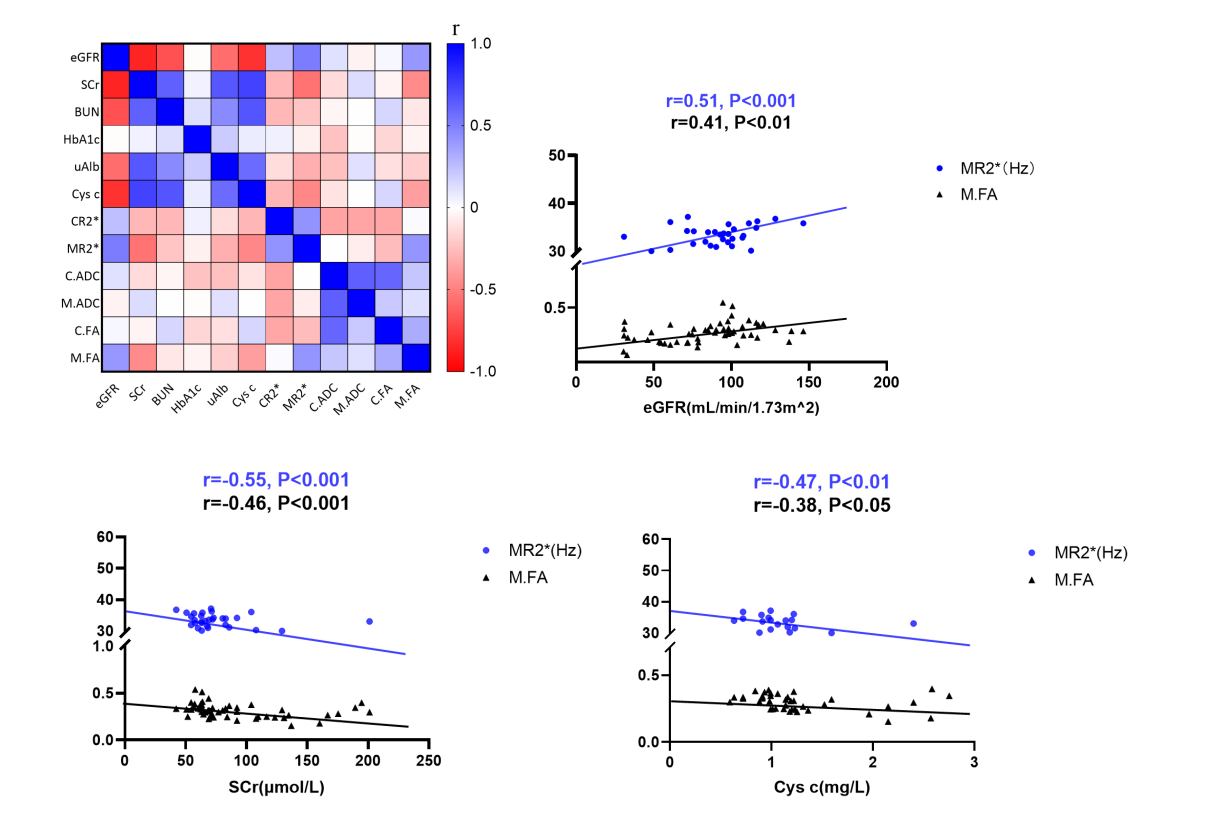
R2* and FA values of renal medulla were correlated with the eGFR, SCr, uAlb and Cys C values in the HC group and the three diabetic subgroups. The eGFR had a moderate and positive correlation with the MR2* value and a positive but weak correlation with the M.FA value (p<0.001). In contrast, SCr was moderately and negatively correlated with MR2* and negatively but weakly correlated with the M.FA value (p<0.001). Cys C had a weak and negative correlation with the MR2* and M.FA value (p<0.01, p<0.05).