4235
Low Variance ADC Technique Reduces Bias of Kidney ADC Values1Radiology, Jiangsu Provincial People’s Hospital,Nanjing Medical University, Nanjing, China, 2Philips Healthcare, Shanghai, China
Synopsis
Low variance (LOVA) ADC technique could compensate for gradient linearity errors, delivering consistent ADC values with high accuracy in large FOV. This work aims to investigate if gradient nonlinearity bias can be corrected in evaluating the ADC values of kidney using LOVA ADC technique. Our results verified that the corrective effect exists in both health volunteers and patients with common kidney diseases. With the corrected ADC, we could better estimate the unbiased difference between marginal lesions and central lesions, to better predict biological behavior of tissues and provide useful information for diagnosis and treatment.
Introduction
Extracapular extention is a potential prognostic factor of significance in renal cell carcinoma (RCC), which also affects patients to undergo radical or partial nephrectomy1. Diffusion-weighted MRI (DW-MRI), highly sensitive to microenvironmental alterations at the cellular level, has been evaluated extensively as a technique for the generation of quantitative and early imaging biomarkers of clinical outcome2. Therefore,we want to better show the state difference between marginal lesions and slightly central lesions by studying the corrected ADC, so as to better predict its biological behavior.Gradient nonlinearity bias causes apparent diffusion coefficient (ADC) values to deviate with increasing isocenter offset. Low variance (LOVA) ADC technique could compensate for gradient linearity errors, delivering consistent ADC values with high accuracy in large FOV. This work aims to investigate if gradient nonlinearity bias can be corrected in evaluating the ADC values of kidney using LOVA ADC technique3.Method
Thirty-five subjects (twenty-two healthy volunteers and thirteen patients with kidney diseases)were enrolled to assess LOVA correction in vivo. Kidney DWI sequence was performed on a 3.0T MRI system (Ingenia CX, Philips healthcare, Best, the Netherlands), using single-shot, spin-echo, echo-planar imaging with spectral presaturation with inversion recovery (SPIR) fat-saturation. The parameters are as follows: echo time (TE) = 73ms, repetition time (TR) = 3500ms, b = 0, 50, 800, 1200 s/mm2, pixel size = 2.90 × 2.53 mm2, slice thickness = 5 mm. ADC maps with and without ADC correction were created from the b50/b800 and from b50/b1200 images. Uncorrected and corrected ADC values were measured in cortical area of kidney by placing regions of interest (ROI) on one ADC map and then copying them to the other three ADC maps. The offsets of the ROIs were also recorded.Result
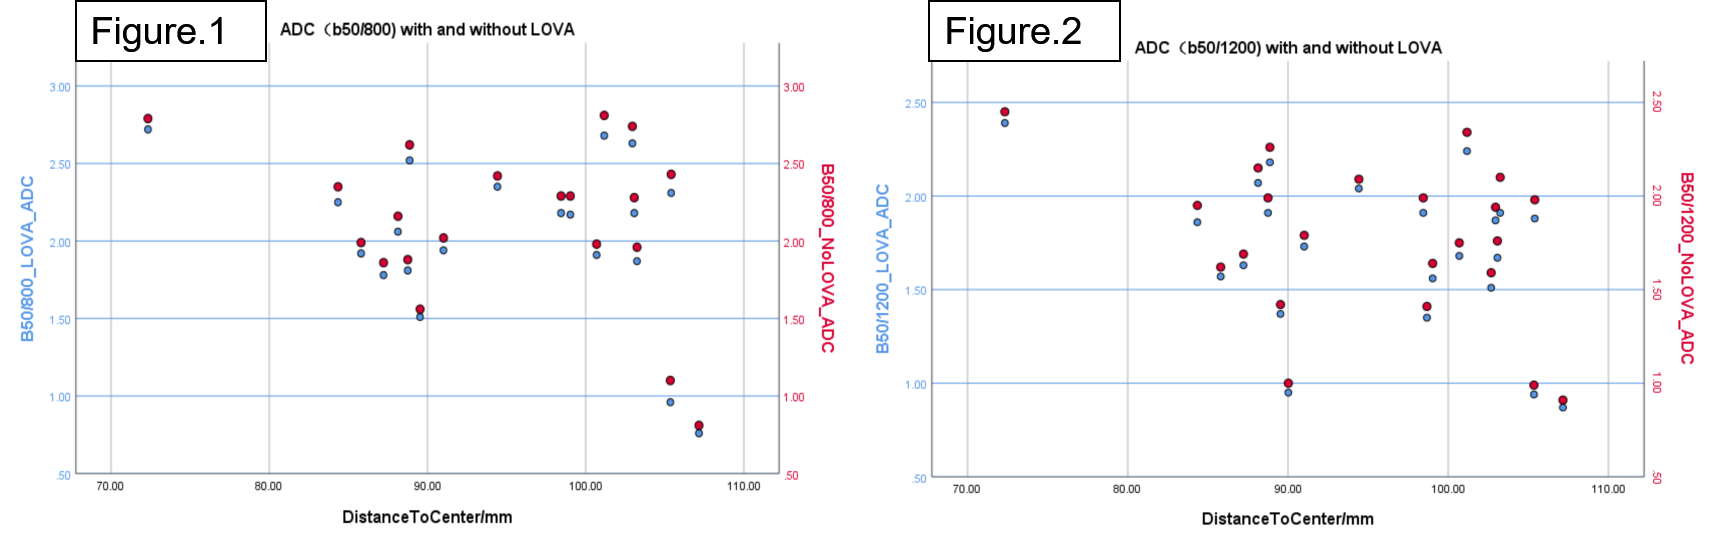
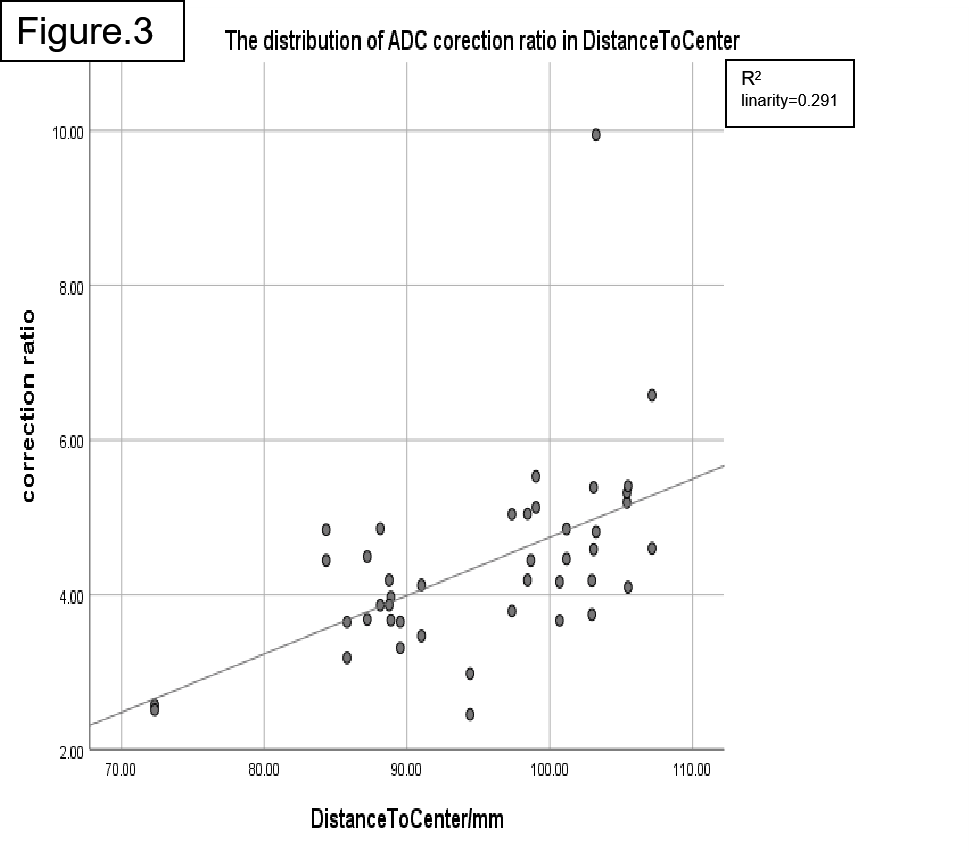
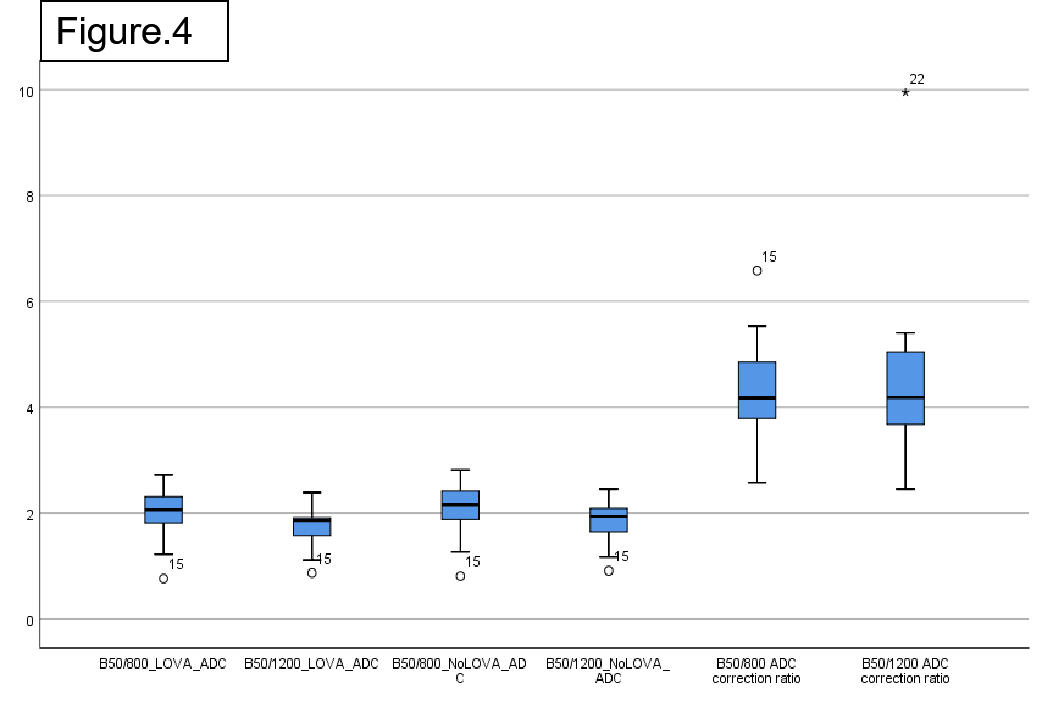
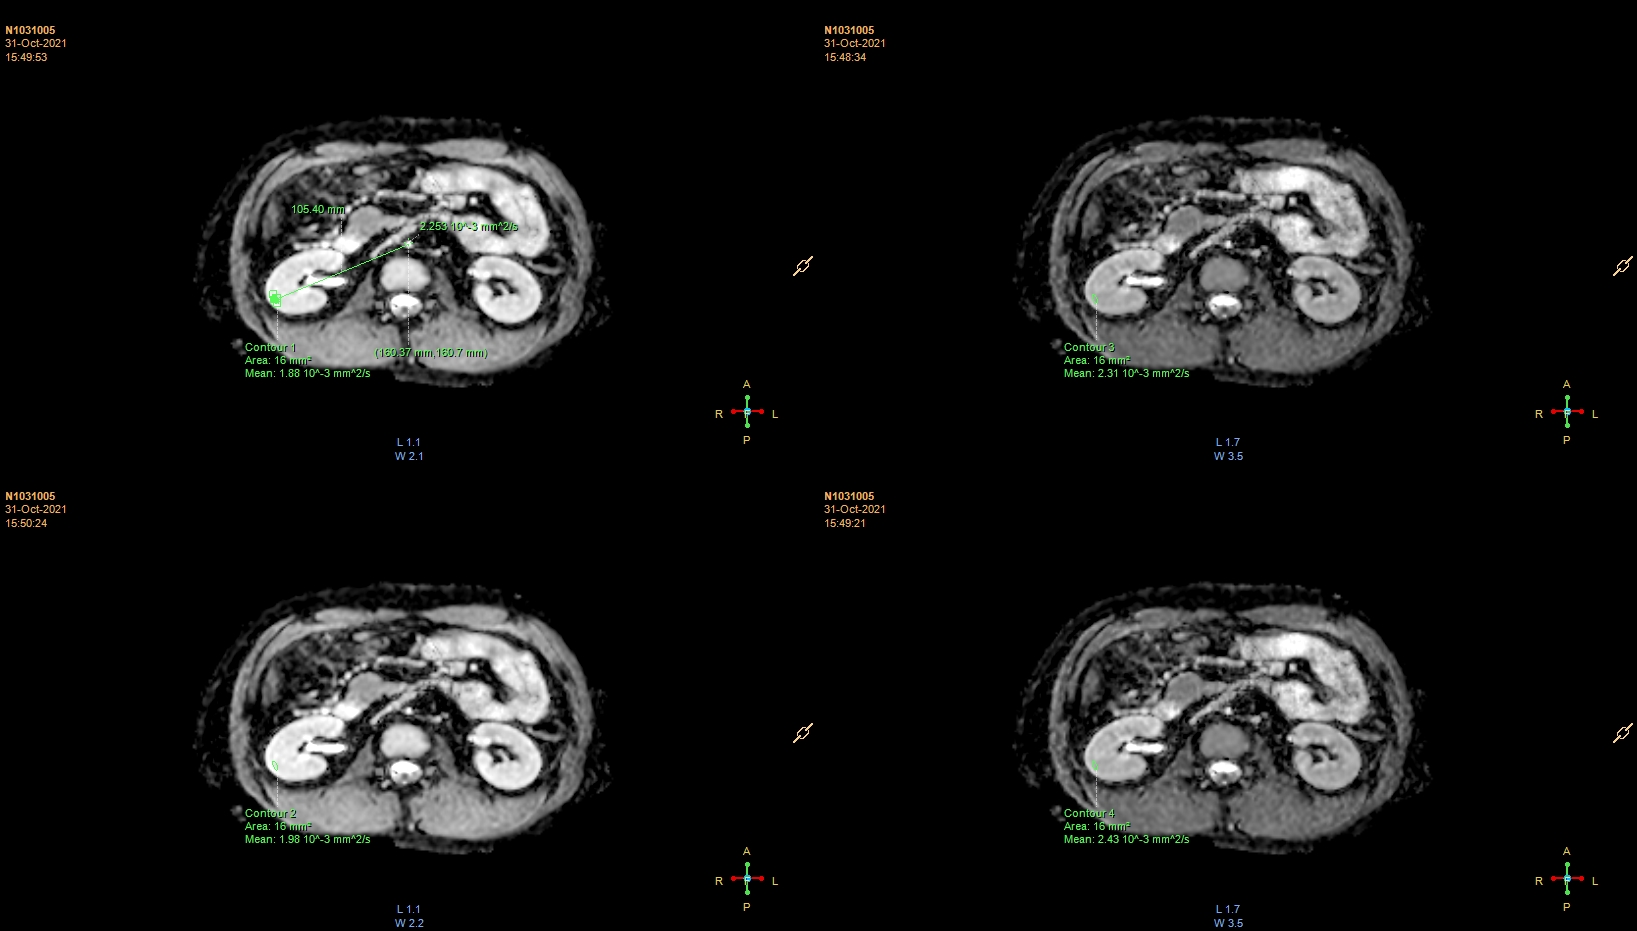
In healthy volunteers, the values after LOVA correction on ADC(b50/800) and ADC(b50/1200) are lower than those before correction. ADC(b50/800) represents ADC values calculated from b50 and b800 DWI images, and ADC(b50/1200) represents ADC values calculated from b50 and b1200 DWI images. With the increase of distance to center, the correction effect increases. The ADC correction ratio is about 4.32%(min2.57%/max6.58%) on ADC(b50/800) and is about 4.42% (min2.42% / max9.94%) on ADC(b50/1200). So, higher b value may have a greater correction effect. In patients with kidney disease, the values after correction on ADC(b50/800) and ADC(b50/1200) are also lower than those before correction, and the ADC correction ratio is about 4.33% (min3.38/max6.04) on b50/800 and 4.74% (min3.51 / max6.13) on b50/1200.Discussion
Our data sample is small and the consistency of the results is good, which needs to be further verified. If the corrective effect exists in normal people and patients with common kidney diseases and has high consistency, it must be well used for renal tumors which always originate from the center and invade to the edge. Through the comparison between the center and the edge, it can predict the invasion of renal capsule.Conclusion
With the LOVA ADC technique, we could better estimate the unbiased ADC values offsetting from the isocenter. In the future, we will collect more patients with renal tumors and compare them with pathology by measuring and correcting the ADC in the tumor center and marginal area, so as to predict the possible biological behavior of the tumor on the image and provide useful information for the selection of clinical operation methods and prognosis.Acknowledgements
No acknowledgement found.References
1. Ha U S , Lee K W , Jung J H , et al. Renal capsular invasion is a prognostic biomarker in localized clear cell renal cell carcinoma[J]. Rep, 2018, 8(1).
2. Galbán CJ, Hoff B A , Chenevert T L , et al. Diffusion MRI in early cancer therapeutic response assessment[J]. NMR in Biomedicine, 2017, 30(3):e3458.
3. Buus TW, Jensen AB, Pedersen EM. Diffusion gradient nonlinearity bias correction reduces bias of breast cancer bone metastasis ADC values. J Magn Reson Imaging. 2020;51(3).
Figures