4232
Diffusion and perfusion MRI and radiomics signatures for preoperative evaluation of epithelial-mesenchymal transformation in rectal cancer1Radiology, West China Hospital, Sichuan University, Chengdu, China, 2Guangxi Medical University First Affiliated Hospital, Nanning, China, 3Radiology, Guangxi Medical University First Affiliated Hospital, Nanning, China, 4MR Scientific Marketing, Siemens Healthineers, Wuhan, China
Synopsis
This study demonstrated morphological characteristics of MRI can hardly diagnose the expression of E-cadherin and Vimentin in rectal cancer. ADC value (Ultra-high b-Value) was positively and negatively correlated with E-cadherin and Vimentin expression. Ktrans and Kep values were negatively and positively correlated with E-cadherin and Vimentin expression. ADC, Ktrans and Kep values had significant diagnostic efficiencies for low E-cadherin and high Vimentin expression. Radiomics signatures with machine learning have excellent diagnostic efficacy for E-cadherin and Vimentin expression, building the model which combined MRI quantitative parameters and radiomics features will improve the predictive performance for E-cadherin and Vimentin expression.
Introduction/Purpose
expression of E-cadherin and increased expression of Vimentin which associated with poor prognosis in rectal cancer [1], the aim of this study was to explore the feasibility of using multi-parameter diffusion, perfusion magnetic resonance imaging (MRI) and radiomics features to evaluate the expression of E-cadherin and Vimentin.Patients and methods
110 patients with rectal cancer were included in this prospective study, who underwent preoperative multi-parameter diffusion, including intravoxel incoherent motion (IVIM) and diffusion kurtosis imaging (DKI) from DWI data with ultra-high b values (b=1000, 2000 and 3000 s/mm2), and dynamic contrast enhancement MRI (DCE-MRI). And then all patients were performed subsequent radical resection of rectal carcinoma. The expression of E-cadherin and Vimentin were identified by immunohistochemical test; MRI morphology, quantitative parameters and radiomics features were analyzed; and combined predictive models were created using machine learning, which were validated with an independent cohort (n = 23). Receiver operating characteristics (ROC) curve with area under the curve (AUC) was used to evaluated predictive performance. Interobserver agreement for MRI parameters was evaluated by intraclass correlation coefficient (ICC). P<0.05 was considered to be significantly different.Results
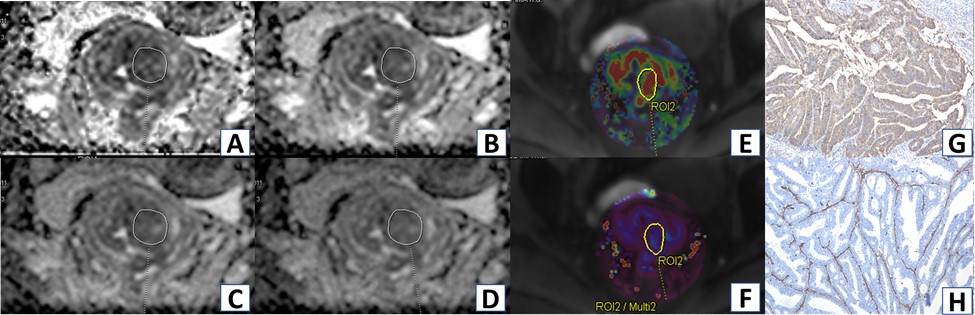
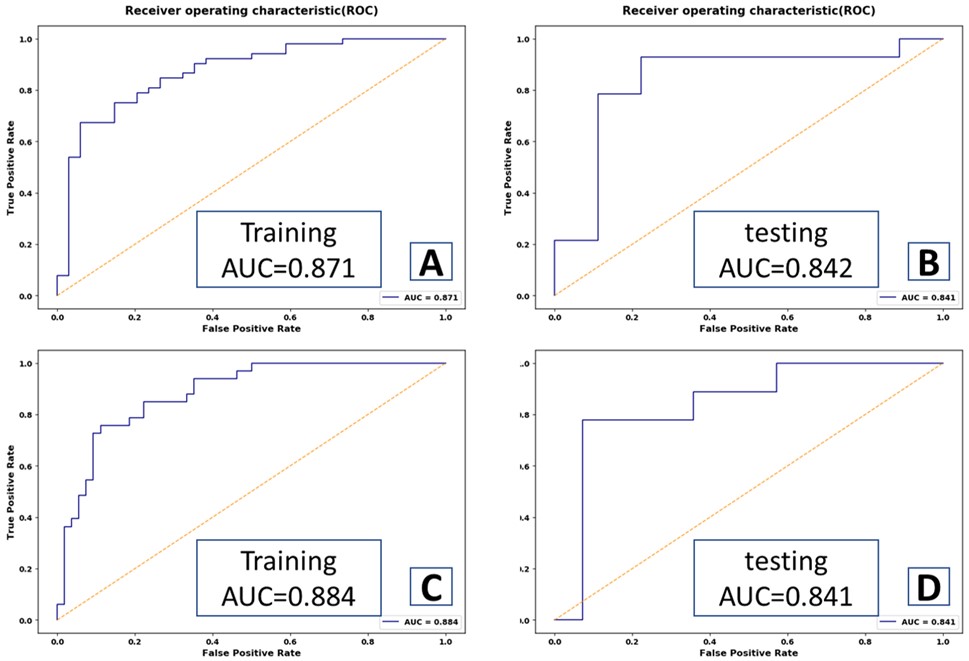
MRI morphological features had no diagnostic efficacy for E-cadherin expression in rectal cancer (P > 0.05). ADC (b = 2000 and 3000 s/mm2), Ktrans and Kep values had significant diagnostic efficiencies for low expression of E-cadherin (AUC = 0.628, 0.630, 0.801 and 0.722, P < 0.05). ADC (b = 3000 s/mm2), Ktrans and Kep values had significant diagnostic efficiency for high expression of Vimentin (AUC=0.644, 0.724 and 0.628, P < 0.05). Representative ADC maps using difference b value and Ktran and Kep maps are shown in Figure 1. The SVM classifier of machine learning based on dynamically enhanced sequences had the highest predictive efficiency for low expression of E-cadherin and high expression of Vimentin in rectal cancer (in validation set AUC was 0.825 and 0.809, respectively), the combined diagnostic model had higher predictive efficiency for low expression of E-cadherin and high expression of Vimentin (in validation set AUC was 0.842 and 0.841, respectively), as shown in Figure 2. Interobserver agreement of MRI parameters was excellent (all ICC>0.85,P<0.05).Discussion
This was a preliminary feasibility study of assessed Multi-parameter diffusion and perfusion magnetic resonance imaging and radiomics signatures for preoperative evaluation of epithelial-mesenchymal transformation in rectal cancer. The results suggest that the ADC (Ultra-high b-Value), Ktrans and Kep values can be used to assess the expression of E-cadherin and Vimentin. Furthermore, radiomics signatures with machine learning have excellent diagnostic efficacy for E-cadherin and Vimentin expression, building the model which combined MRI quantitative parameters and radiomics features will improve the diagnostic performance for predicting the expression of E-cadherin and Vimentin. Since the EMT was characterized by the decreasing E-cadherin expression and increasing Vimentin expression [2,3], that is a critical process enables tumor cells to migrate and metastasize to distant sites [4] and promoting colorectal cancer progression and resistance to neoadjuvant therapy [5,6]. So, our study indicated that metrics of diffusion and perfusion MRI and radiomics signatures could as a potential biomarker to assess the EMT in rectal cancer which has significant value for preoperative assessment of the tumor microenvironment, it may help to tailor the best treatment plan for the individual patient.Conclusion
Multi-parameter MRI, especially the quantitative parameters of dynamic contrast enhancement (Ktrans, Kep) can indicate the major biomarkers of EMT in rectal cancer, and the predictive model combined with the radiomics features can further improve the predictive efficiency for EMT, which possibly provide valuable information for noninvasive and preoperative assessment of the tumor microenvironment.Acknowledgements
This study was supported by the National Natural Science Foundation of China (82060310) Thanks to Yingying Ezell for the language recheck and editing, Chenhui Li and Huiting Zhang gave constructive suggestions for the MRI scanning. Cheng tang and Yiwu Dang technologists in our department, for their work performing measurements for this study.References
1. Uchikado Y, Natsugoe S, Okumura H, Setoyama T, Matsumoto M, Ishigami S, Aikou T. Slug Expression in the E-cadherin preserved tumors is related to prognosis in patients with esophageal squamous cell carcinoma. Clin Cancer Res. 2005 Feb 1;11(3):1174-80. PMID: 15709186.
2. Kalluri R, Weinberg RA. The basics of epithelial-mesenchymal transition. J Clin Invest. 2009 Jun;119(6):1420-8. doi: 10.1172/JCI39104. Erratum in: J Clin Invest. 2010 May 3;120(5):1786. PMID: 19487818; PMCID: PMC2689101.
3. Nieto MA, Huang RY, Jackson RA, Thiery JP. EMT: 2016. Cell. 2016 Jun 30;166(1):21-45. doi: 10.1016/j.cell.2016.06.028. PMID: 27368099.
4. Fan F, Samuel S, Evans KW, Lu J, Xia L, Zhou Y, Sceusi E, Tozzi F, Ye XC, Mani SA, Ellis LM. Overexpression of snail induces epithelial-mesenchymal transition and a cancer stem cell-like phenotype in human colorectal cancer cells. Cancer Med. 2012 Aug;1(1):5-16. doi: 10.1002/cam4.4. Epub 2012 Jun 8. PMID: 23342249; PMCID: PMC3544430.
5. Bhangu A, Wood G, Mirnezami A, Darzi A, Tekkis P, Goldin R. Epithelial mesenchymal transition in colorectal cancer: Seminal role in promoting disease progression and resistance to neoadjuvant therapy. Surg Oncol. 2012 Dec;21(4):316-23. doi: 10.1016/j.suronc.2012.08.003. Epub 2012 Sep 14. PMID: 22981546.
6. Bhangu A, Wood G, Brown G, Darzi A, Tekkis P, Goldin R. The role of epithelial mesenchymal transition and resistance to neoadjuvant therapy in locally advanced rectal cancer. Colorectal Dis. 2014 Apr;16(4):O133-43. doi: 10.1111/codi.12482. PMID: 24617665.
Figures