4231
Quantitative Evaluation of Crohn's Disease Using Native T1 Mapping: A Feasibility Study1Radiology Center, Kindai University Hospital, Osakasayama City, Japan, 2Department of Medical Physics and Engineering, Osaka University Graduate School of Medicine, Suita City, Japan, 3Department of Radiology, Kindai University, Osakasayama City, Japan, 4Department of Gastroenterology and Hepatology, Kindai University, Osakasayama City, Japan, 5Philips Japan, Tokyo, Japan
Synopsis
We investigated the usefulness of native T1 mapping using a modified look-locker inversion recovery (MOLLI) sequence, which can be used to evaluate Crohn's disease (CD). The nativeT1 value was measured by setting an ROI on the intestinal wall of the nativeT1 map containing the short-axis image of the intestine. Simple endoscopic activity score in CD (SES-CD) was used as the reference standard for evaluating CD activity. A strong correlation was found between native T1 value and the SES-CD (r = 0.83; p = 0.001).
Introduction
Crohn’s disease (CD) is a chronic, relapsing inflammatory disease characterized by transmural inflammation and can involve any part of the gastrointestinal tract. Imaging also has a critical role in CD phenotyping, with inflammatory, penetrating, and structuring CD variants associated with their own set of symptoms and treatment strategies1,2. Stricture formation is one of the most important and challenging complications of CD. Inflammation-predominant strictures may be relieved by anti-inflammatory treatment, whereas fibrosis-predominant strictures require endoscopic or surgical treatment3. Hence, differentiating the types of strictures in CD is critically essential for therapeutic management. Native T1 mapping used a breath-hold modified look-locker inversion recovery (MOLLI) sequence has been applied to cardiac imaging and enables detection and quantification of fibrosis4, without contrast. We hypothesized that intestinal native T1 value might reflect differences in fibrosis and endoscopic activity indices. The purpose of this study was to evaluate the feasibility of native T1 mapping in the bowel for evaluation of CD and to correlate the native T1 value with the simple endoscopic activity score in CD (SES-CD) from ileocolonoscopy as the reference standard.Methods
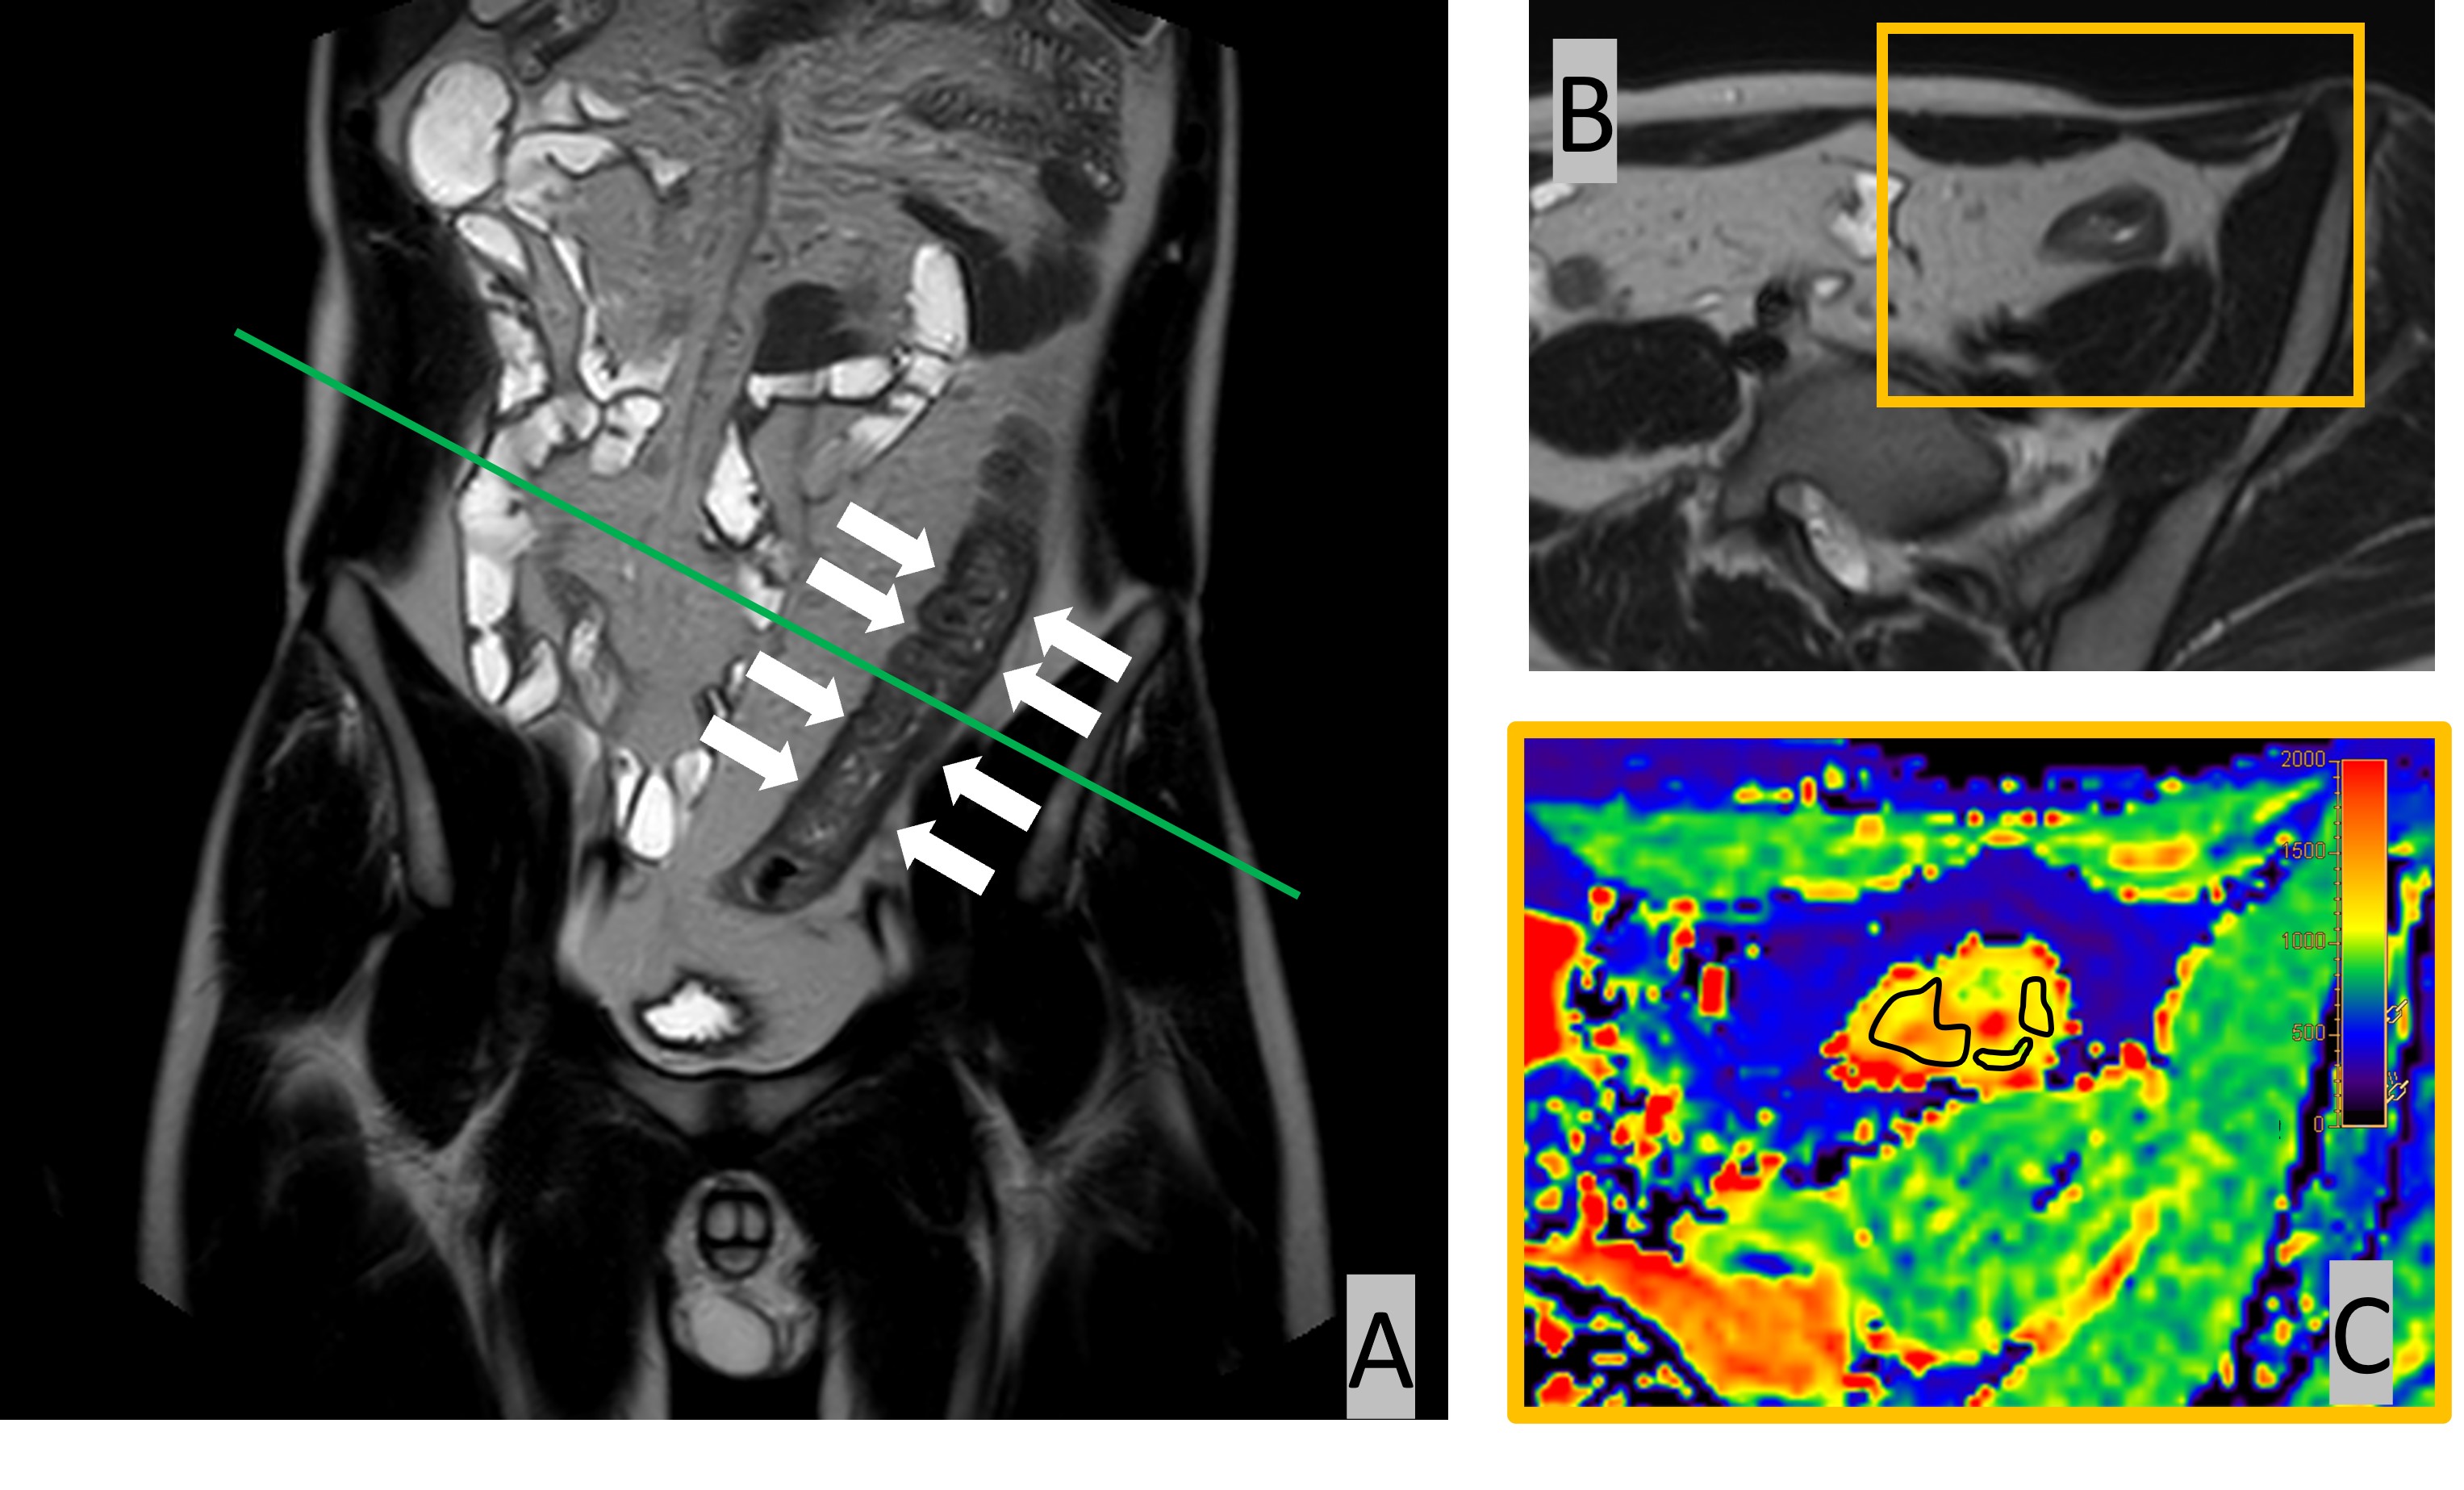
Institutional review board approval and informed consent were obtained for this prospective study. MR imaging was performed by a 1.5T unit (Achieva dStream, Philips Healthcare, Best, The Netherlands). After intravenous administration of scopolamine butylbromide, the native T1 map used by MOLLI sequence was obtained in the short-axis image of the intestine with marked thickening with reference to T2-weighted single shot fast spin echo (SSFSE) sequences in the coronal and axial plane. The SES-CD was evaluated at the same location where the native T1 map was acquired as the reference standard. Spearman's rank correlation coefficient was used to correlate native T1 value with the SES-CD.Results
A total of 15 patients were included in this study (13 men, two women; mean age, 39 ± 13 years; range, 19-70 years). The mean native T1 value was 1022.3 ± 148.7 msec. Total SES-CD scores ranged from 1-12 with a mean of 6.3 ± 3.0. Native T1 value strongly correlated with the SES-CD (rs = 0.83; p = 0.001).Conclusion
This study demonstrated the feasibility of native T1 mapping in the bowel and potential utility in quantifying disease in CD by showing a strong correlation between the native T1 relaxation time and the SES-CD.Acknowledgements
No acknowledgement found.References
1. Catalano OA, Gee MS, Nicolai E, et al. Evaluation of Quantitative PET/MR Enterography Biomarkers for Discrimination of Inflammatory Strictures from Fibrotic Strictures in Crohn Disease. Radiology 2016;278:792-800.
2. Rieder F, Zimmermann EM, Remzi FH, Sandborn WJ. Crohn's disease complicated by strictures: a systematic review. Gut 2013;62:1072-1084.
3. Latella G, Di Gregorio J, Flati V, Rieder F, Lawrance IC. Mechanisms of initiation and progression of intestinal fibrosis in IBD. Scand J Gastroenterol 2015;50:53-65.
4. Mahrholdt H, Wagner A, Judd RM, Sechtem U, Kim RJ. Delayed enhancement cardiovascular magnetic resonance assessment of non-ischaemic cardiomyopathies. Eur Heart J 2005;26:1461-1474.
Figures
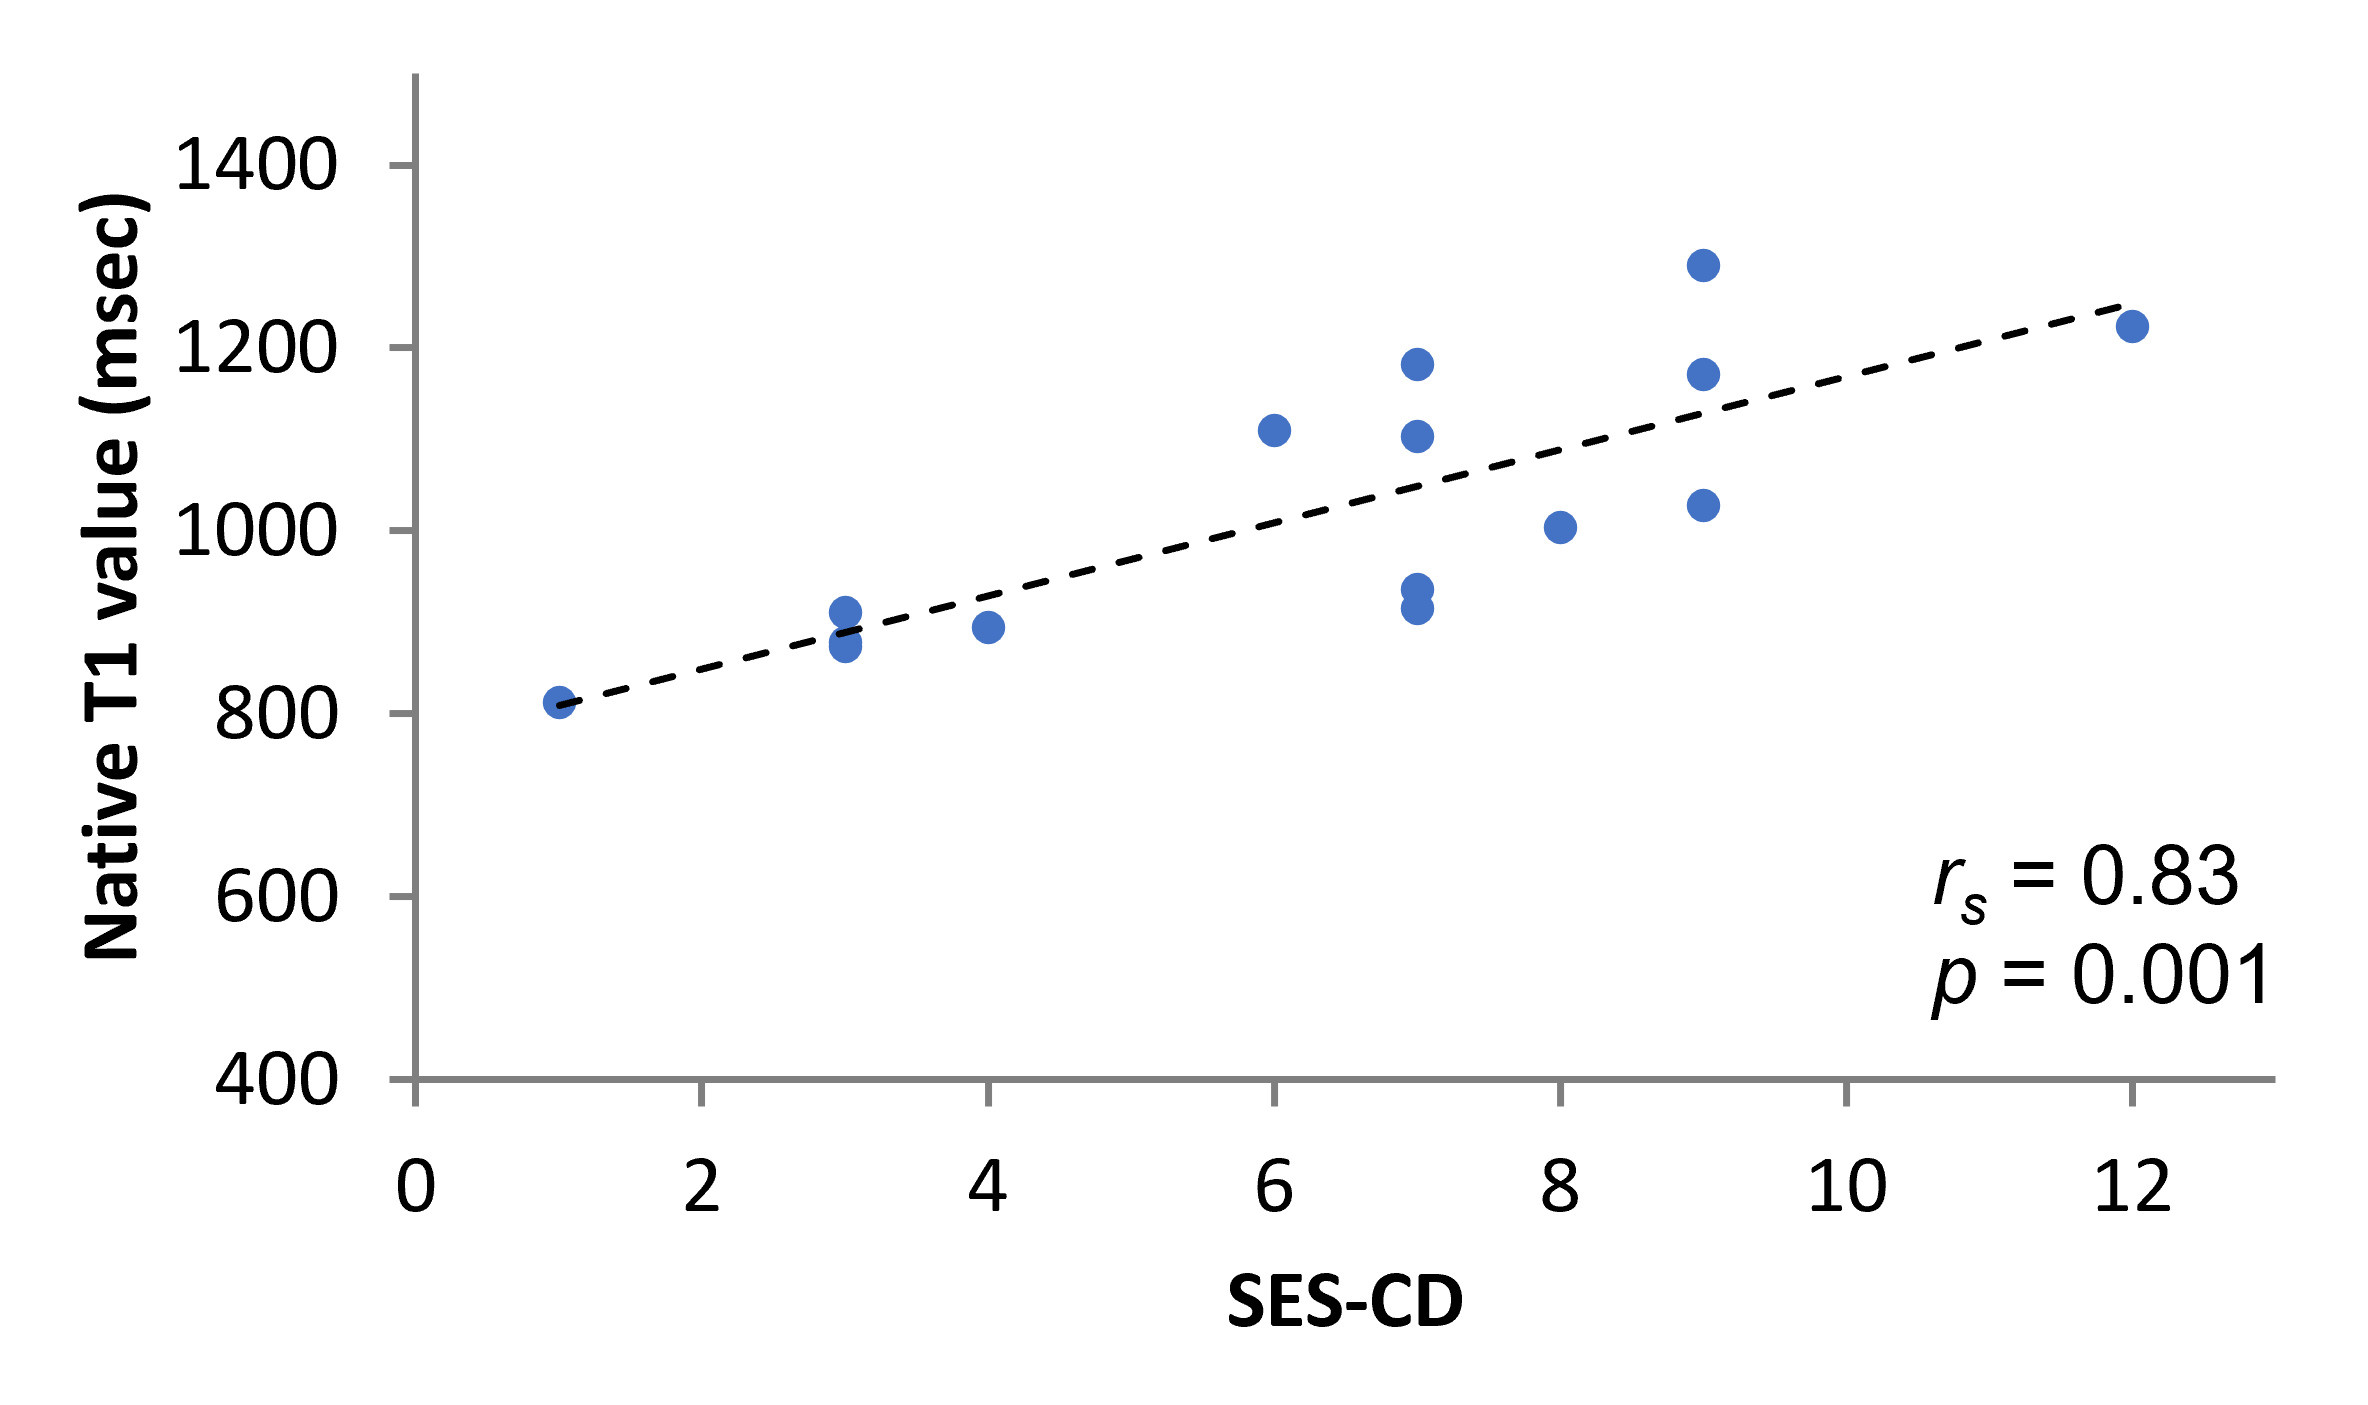
Scatterplots show the value pairs of native T1 value acquired with modified look-locker inversion recovery sequence and the simple endoscopic activity score in Crohn's disease (SES-CD). Each plot shows the linear regression (dashed line) and indicates Spearman's rank correlation coefficient (rs).