4226
The value of IVIM-DWI and IDEAL-IQ in evaluating pathological grading of Hepatocellular Carcinoma1Department of Radiology, The First Affiliated Hospital of USTC, Southern District of Anhui Provincial Hospital, Hefei, China, 2Department of Radiology, The First Affiliated Hospital of USTC, Southern District of Anhui Provincial Hospital, hefei, China
Synopsis
During the evolution of hepatocellular carcinoma(HCC) from high differentiation to low differentiation, the number of tumor cells increased and arranged more closely, the limited diffusion of water molecules was more obvious. Meanwhile, the iron and fat content in the lesions decreased gradually. The ADC、D values derived from IVIM-DWI and FF、R2* values derived from IDEAL-IQ can accurately reflect the diffusion limitation and the changes of fat and iron content in HCC, so as to accurately evaluate the pathological grade of HCC.
Objective
The prognosis of hepatocellular carcinoma(HCC) is closely related to its grade of pathological 1. Zhu et al showed that the ADC and D values which derived from IVIM-DWI were statistically significant in HCC with different degrees of differentiation 2. The D value of HCC with different degrees of differentiation was lower than the ADC value, and the D value had better diagnostic effect. Tsukahara et al showed that the stage of RN evolving into HCC will be combined with iron deficiency 3, and the sign of steatosis was a secondary sign of HCC specific malignancy. IDEAL-IQ can accurately evaluate liver iron and fat content 4,5,6. This study investigated the value of IVIM-DWI and IDEAL-IQ in grading of HCC.Methods
61 cases of hepatocellular cancer were confirmed by pathology. All HCCs were divided into high、moderate and low differentiation group according to the Edmondson-Steiner grading. For all patients underwent routine MR scans、IVIM-DWI and IDEAL-IQ examination. Measure these parameters by checking ADW 4.6 workstation, including ADC、D、D*、f and fat fraction(FF)、R2* values. Comparison between groups was conducted with ANOVA test and S-N-K test and the receiver operating characteristic curve (ROC) analysis was used to evaluate the predictive efficiency of IVIM-DWI and IDEAL-IQ parameters in preoperative grading. Correlation analysis of ADC, D, FF and R2 * and the HCC differentiation by Spearman correlation analysis. The difference was statistically significant when P<0.05.Results
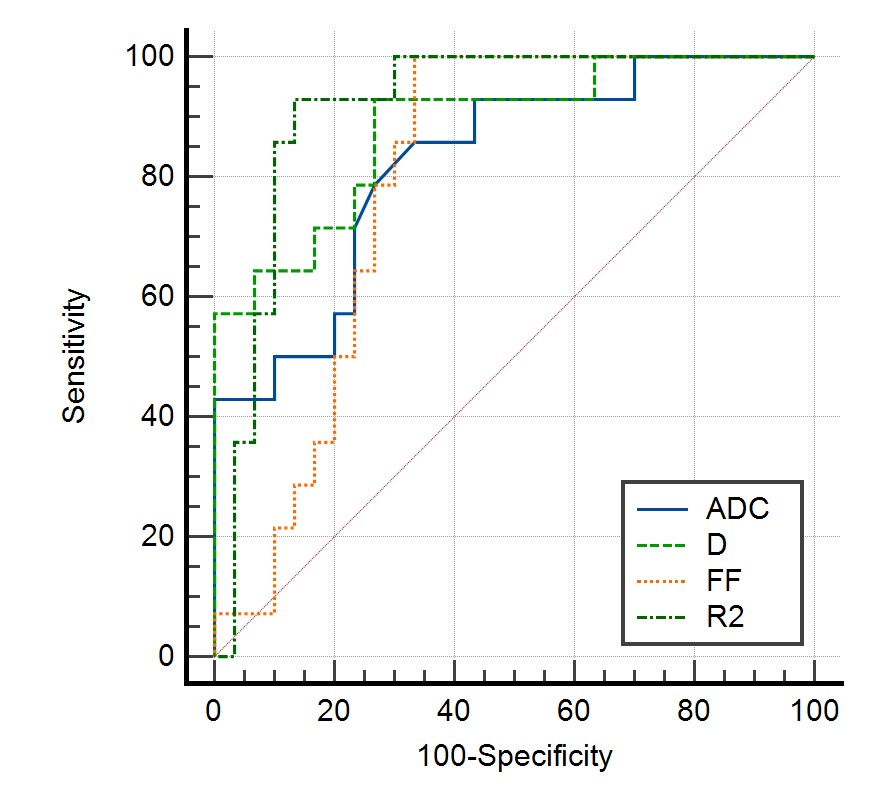
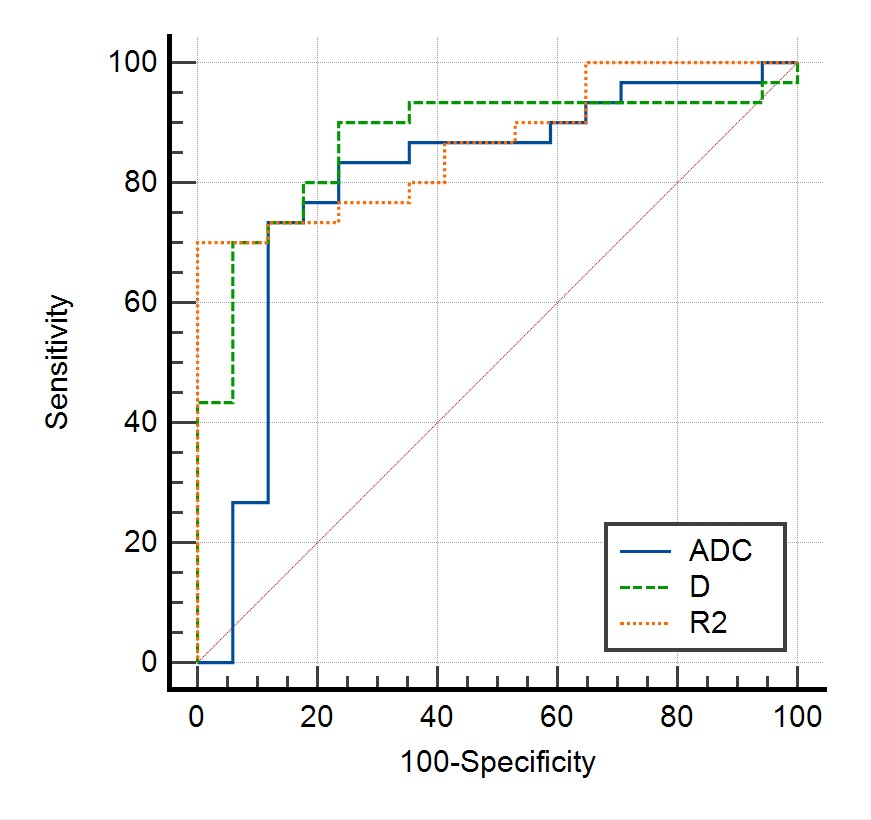
There were 14 cases in the high differentiated group, 30 cases in the moderate and 17 cases in the low differentiation group. The mean ADC、D、D*、f and FF、R2* values of the high differentiation group were (1.369±0.114)×10-3mm2/s、(1.075±0.131)×10-3mm2/s、(24.738±9.667)×10-3mm2/s、(0.264±0.08)%、(8.885±4.514)%、(27.937±2.724)Hz, while those values of the moderate and low differentiation group were (1.192±0.161)×10-3mm2/s、(0.861±0.131)×10-3mm2/s、(22.359±13.875)×10-3mm2/s、(0.327±0.164)%、(5.63±4.544)%、(21.15±4.535)Hz and (0.996±0.195)×10-3mm2/s、(0.685±0.098)×10-3mm2/s、(22.898±15.721)×10-3mm2/s、(0.501±1.054)%、(3.23±1.599)%、(14.911±3.054)Hz, respectively. The ADC、D、FF and R2* values had statistically significant differences between the three groups (P<0.05). The D* value and f value had no statistically significant difference between the three groups (P>0.05). The areas under the ROC curve of ADC、D、FF and R2* values were 0.825、0.883、0.795、0.914 between high-moderate differentiation group. The areas under the ROC curve of ADC、D、R2* values were 0.8、0.869、0.867 between moderate-low differentiation group respectively. The ADC、D、FF and R2* values were positively correlated with the differentiated degree of HCC, and the correlation coefficients were 0.625, 0.633, 0.568 and 0.713.Conclusions
ADC、D、FF and R2* values had an important reference value for evaluating the differentiation of HCC. R2* value had the highest test efficiency between high-moderate differentiation group, while D value had the highest test efficiency between moderate-low differentiation group(the efficiency of R2* value was slightly lower than that of D value). ADC、D、FF and R2* values were correlated with the degree of HCC differentiation, and the R2* value had the highest relativity.Acknowledgements
I am grateful to Kexue Deng and Peng Wang for their help and support in the design of the study and interpretation of the results.References
[1] Zhuang HK, Zhou ZX, Ma ZY, et al. Prognostic Stratification Based on a Novel Nomogram for Solitary Large Hepatocellular Carcinoma After Curative Resection [J]. Front Oncol, 2020,16(10):556489.
[2] Zhu SC, Liu YH, Wei Y, et al. Intravoxel incoherent motion diffusion-weighted magnetic resonance imaging for predicting histological grade of hepatocellular carcinoma: Comparison with conventional diffusion-weighted imaging[J].World J Gastroenterol,2018,24(8): 929-940.
[3] Tsukahara Y, Okajima Y, Yamada A, et al. The peritumoral hypointense rim around hepatocellular carcinoma on T2*-weighted magnetic resonance imaging: radiologic-pathologic correlation[J]. World J Surg Oncol,2021,19(1):41-50.
[4] Wang Q, Ye F, Ma PQ,et al. Quantitative magnetic resonance imaging evaluation of hepatic fat content with iron deposition: will it be disturbed?[J].J Int Med Res,2019,47(5):1958-1974.
[5] Chen YD, Long LL, Jiang ZJ, et al. Quantification of pancreatic proton density fat fraction in diabetic pigs using MR imaging and IDEAL-IQ sequence[J].BMC Med Imaging,2019,19(1): 38-45.
[6] Rajlawot K, Jiang T, Zhou J,et al. Accuracies of Chemical Shift In/Opposed Phase and Chemical Shift Encoded Magnetic Resonance Imaging to Detect Intratumoral Fat in Hepatocellular Carcinoma[J]. J Magn Reson Imaging,2021,53(6):1791-1802.
Figures