4225
Stage liver fibrosis and inflammatory activity using radiomic models based on easy access magnetic resonance images
Huanhuan Wei1, Fangfang Fu2, Yaping Wu2, Yan Bai2, Nan Meng1, Wei Wei2, Kewei Liu3, Xianchang Zhang4, and Meiyun Wang2
1Academy of Medical Sciences, the People’s Hospital of Zhengzhou University, Zhengzhou, China, 2Department of Medical Imaging, Henan Provincial People's Hospital & the People’s Hospital of Zhengzhou University, Zhengzhou, China, 3The First People's Hospital of Zhoukou, Zhoukou, China, 4MR Collaboration, Siemens Healthineers Ltd, Beijing, China
1Academy of Medical Sciences, the People’s Hospital of Zhengzhou University, Zhengzhou, China, 2Department of Medical Imaging, Henan Provincial People's Hospital & the People’s Hospital of Zhengzhou University, Zhengzhou, China, 3The First People's Hospital of Zhoukou, Zhoukou, China, 4MR Collaboration, Siemens Healthineers Ltd, Beijing, China
Synopsis
Invasive pathological puncture biopsy is the diagnostic standard for liver fibrosis (LF), but it has certain risks and low repeatability. A non-invasive and reliable method is essential for early detecting and staging of LF. To this end, this study explored the feasibility of using radiomics approach based on easy access T1-weighted and T2-weighted fat saturation magnetic resonance imaging data to stage the liver fibrosis and inflammatory activity. The receiver operating curves analysis demonstrated that the trained radiomic models could effectively stage the LF and inflammatory activity with a high efficacy.
SYNOPSIS
Invasive pathological puncture biopsy is the diagnostic standard for liver fibrosis (LF), but it has certain risks and low repeatability. A non-invasive and reliable method is essential for early detecting and staging of LF. To this end, this study explored the feasibility of using radiomics approach based on easy access T1-weighted and T2-weighted fat saturation magnetic resonance imaging data to stage the liver fibrosis and inflammatory activity. The receiver operating curves analysis demonstrated that the trained radiomic models could effectively stage the LF and inflammatory activity with a high efficacy.Summary of findings
The omics models based on T1-weighted and T2-weighted fat saturation MRI images can effectively predict liver fibrosis staging and verify activity staging.INTRODUCTION
Chronic liver disease can eventually lead to liver fibrosis (LF) or cirrhosis, accompanied by varying degrees of inflammatory activities. Studies[1] have confirmed that early liver fibrosis can be reversed by clinical intervention. Currently, invasive pathological puncture biopsy is still the diagnostic standard for liver fibrosis, which has certain risks and low repeatability. Thus, a non-invasive and reliable method is essential for early detecting and staging of LF. Radiomics has emerged as an attractive method that converted medical images into high-dimensional mineable data via high-throughput extraction of quantitative features, followed by subsequent first-, second-, and higher-order statistics for decision support. In this study, a radiomic approach was used to develop a diagnostic model for assessing and staging severity of LF based on conventional MRI images.METHOD
A total of 270 patients (Males:171, Age: 42.0 ± 13.0 ) with pathologically confirmed different degrees of liver fibrosis and 30 healthy controls were enrolled in this study. All the participants underwent routine MRI scans on a 3T MR scanner. The scans included axial T1-weighted imaging (T1WI) fast spin-echo sequence (repetition time [TR]/echo time [TE], 180 ms/2.1 ms), and an axial T2-weighted imaging (T2WIFS) fast spin-echo sequence with fat suppression (TR/TE, 4800 ms/76 ms). All of the participants were assigned to the training and test datasets with a 4:1 ratio. The fibrosis and inflammation were scored using the METAVIR [2] scoring system. The fibrosis was staged as follows: F0 = no fibrosis, F1 = portal fibrosis without septa formation, F2 = portal fibrosis with few septa, F3 = numerous septa without cirrhosis, and F4 = cirrhosis. The inflammation activity was graded as follows: A0 = no activity, A1 = mild activity, A2 = moderate activity, and A3 = severe activity.The radiomic method included the following steps: firstly, regions of interest (ROI) were drawn at the right lobe of the T2WIFS. The ROI was copied to the T1WI. The ROIs were drawn to avoid large liver blood vessels and bile ducts. Then, radiomic features, including statistical features, geometric features and texture features were extracted on the T1WI and T2WIFS MRI using PyRadiomic [3]. Wavelet features were derived from a transformation of the grayscale intensity and texture features. We combined the T1WI and T2WIFS set to generate T1W & T2WFS. Feature selection was performed to exclude redundant features. Finally, classifiers were trained by Scikit-learn with a pipline of preprocessing, feature reduction and model training.RESULTS
In the liver fibrosis stages, model1, model2, model3 represent the radiomics model constructed by T1WI, T2WIFS and T1W & T2WFS images, respectively. In the hepatitis activity stage, model a, b and c represent the omics model constructed from T1WI, T2WFS and T1W&T2WFS images. A total of 12 liver fibrosis stage model and 9 liver fiber inflammatory activity stage model were obtained. In the four groups with liver fibrosis stage (F0 vs. F1-4, F0-1 vs. F2-4, F0-2 vs. F3-4, as well as F0-3 vs. F4), both model 1 and model2 could effectively identify the stages of liver fibrosis, and model 3 has higher diagnostic efficacy than model 1 and model2 in each group (all P <0.05). At the level of identifying inflammatory activity, the three models were able to effectively identify G≥1, G≥2, and G≥3.DISCUSSION
Progress of chronic liver disease can cause liver fibrosis and hepatitis activities in varying degrees. Meanwhile, inflammatory stimuli will further worsen liver fibrosis [4,5]. Therefore, it is of clinical importance to evaluate fibrosis stage and inflammatory activity of chronic liver disease. In previous studies evaluating fibrosis grading or inflammatory activity, MRI has been commonly used [6], but relatively few studies have used conventional T1WI and T2WIFS sequences combined with imaging omics. In this study, the omics models were established to evaluate the staging and inflammatory activity of liver fibrosis by using imaging omics technology and multi-mode magnetic resonance scanning, and all of them had good diagnostic value. Previous studies have found that single T1WI has a poor diagnostic effect on inflammatory activity G≥3, but the model created in this study has a good diagnostic efficiency with an AUC of 86.3%, which may be related to the fact that omics can mine more image features with high throughput [7]. Our study suggest conventional MRI also can provide valuable diagnostic information for liver fibrosis by data-mining method.Acknowledgements
We acknowledge the support received from the National Natural Science Foundation of China, the National Clinical Key Specialty of China and the Henan Medical Science and Technology Research Program.References
1. Hytiroglou P, Theise ND. Regression of human cirrhosis: an update, 18 years after the pioneering article by Wanless et al. Virchows Arch. 2018 Jul;473(1):15-22.2. Bedossa P, Poynard T. An algorithm for the grading of activity in chronic hepatitis C. The METAVIR Cooperative Study Group. Hepatology. 1996 Aug;24(2):289-93.3. van Griethuysen, J. J. M., Fedorov, A., Parmar, C., Hosny, A., Aucoin, N., Narayan, V., Beets-Tan, R. G. H., Fillon-Robin, J. C., Pieper, S., Aerts, H. J. W. L. (2017). Computational Radiomics System to Decode the Radiographic Phenotype. Cancer Research, 77(21), e104–e107.4. Goldstein ST, Zhou F, Hadler SC, et al. A mathematical model to estimate global hepatitisB disease burden and vaccination impact. Int J Epidemiol, 2005, 34:1329-1339.5. Guido M, Rugge M. Liver biopsy sampling in chronic viral hepatitis. Semin Liver Dis, 2004,24(1):89-97.6. Fu F , Li X , Liu Q , et al. Noninvasive DW-MRI metrics for staging hepatic fibrosis and grading inflammatory activity in patients with chronic hepatitis B[J]. Abdominal Radiology, 2020(8):1-12.7. Gillies R J , Kinahan P E , Hricak H . Radiomics: Images Are More than Pictures, They Are Data[J]. Radiology, 2016, 278(2):563-577.Figures
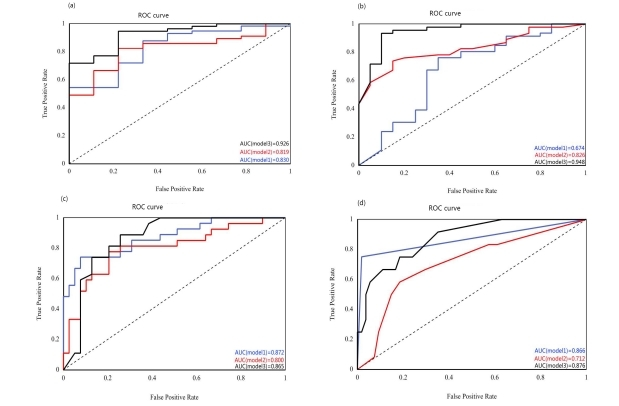
Hepatic fibrosis stage,a: ROC curves of liver fibrosis stage F≥1 in the three models respectively; b: ROC curves of liver fibrosis stage F≥2 in the three models; c: ROC curves of liver fibrosis stage F≥3 in the three models; d: ROC curves of liver fibrosis stage F≥4 in the three models; Model 1 represents the omics model created based on T1WI. Model 2 represents the omics model created based on T2WI. Model 3 represents the omics model created based on T1WI&T2WI;
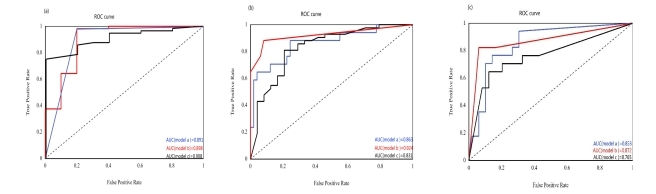
Hepatitis stage, a: ROC curves for hepatitis activity stage G≥1 of the three models; b: ROC curves for hepatitis activity stage G≥2 of the three models; c: ROC curves of hepatitis activity stage G≥3 in the three models; Model A represents the omics model created based on T1WI; Model B represents the omics model created based on T2WI. Model C represents the omics model created based on T1WI&T2WI;
DOI: https://doi.org/10.58530/2022/4225