4224
Correlation between liver function indexes and T1/T2 relaxation time in patients with liver cirrhosis1Department of Radiology, the First Affiliated Hospital of Dalian Medical University, Dalian, China, 2Philips Healthcare, Beijing, China
Synopsis
Evaluation of liver reserve function is crucial for patients with cirrhosis and is helpful for the determination of the surgical plan formulation, the evaluation of treatment process and prognosis, and the operation of cirrhosis. However, there is still lacking a clinically useable non-invasive technique to measure the abnormality of liver function. The purpose of this study is to investigate the potential correlation between T1/T2 relaxation time and liver function indexes in patients with cirrhosis using MR T1/T2 mapping. We found that there was a moderate correlation between T1/T2 relaxation time and liver function assay indexes in liver cirrhosis.
Introduction
Liver function evaluation plays an important role in the treatment of liver cirrhosis and the evaluation of liver function failure after treatment [1-3]. In recent years, more and more evidence indicated T1 mapping could be used to assess liver function. Liver function evaluation indexes, such as albumin and prealbumin synthesis by liver cells, could detect pathological changes earlier than the occurrence of abnormal liver function, and higher sensitivity was found for albumin and transferrin [4]. In this study, we investigated the potential correlation between T1/T2 relaxation time and liver function indexes in patients with cirrhosis using MR T1/T2 mapping and evaluate the clinical values of T1/T2 mapping for measuring the abnormality of liver function.Materials and Methods
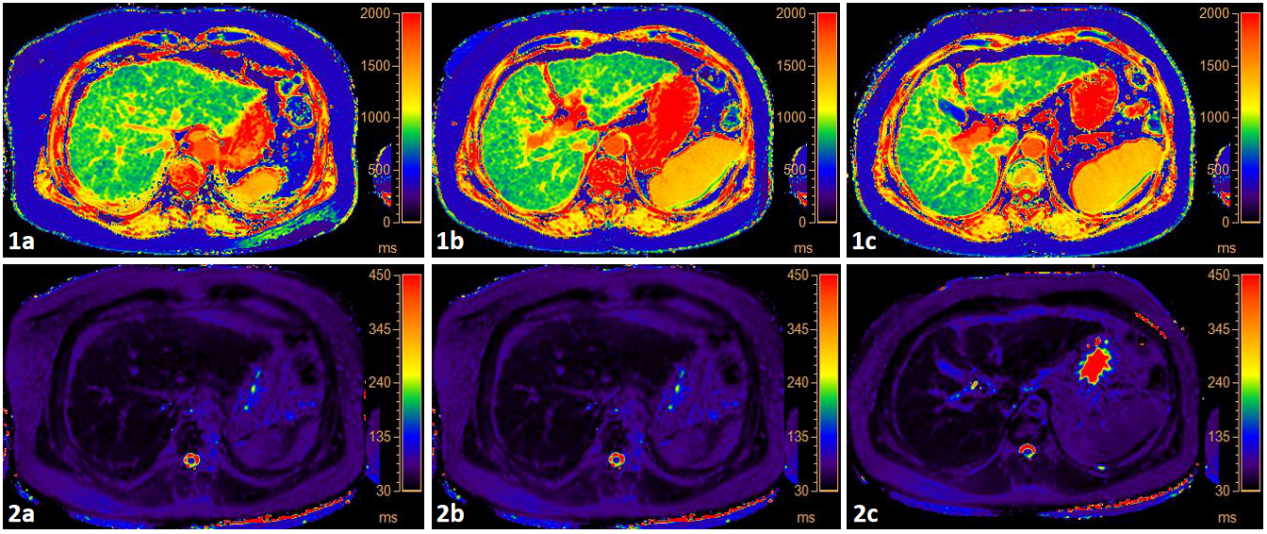
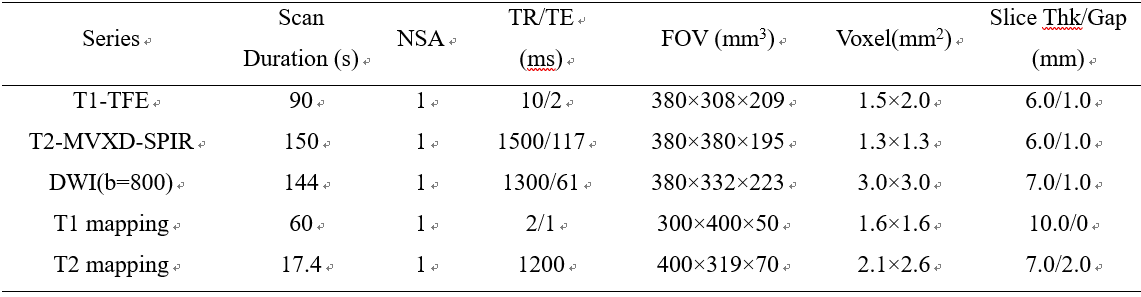
This study has been approved by the institutional IRB. We had retrospectively analyzed 27 patients with liver cirrhosis from October 2019 to October 2021. T1 and T2 mapping data were acquired on a 3.0 T MR system (Ingenia CX, Philips Healthcare, the Netherlands) using a 16-channel abdominal array coil. The diagnosis was confirmed by clinical symptoms, laboratory tests, and MRI examination. The detailed MR scanning paraments were shown in Table 1. The data of liver function test (total bilirubin, total bile acid, prealbumin, albumin, GGT, asparagine, Alanine aminotransferase, alkaline phosphatase, and prothrombin time) were recorded. The excluded criteria in this study were: A, clinical laboratory information was not complete or the date of assay inspection sampling more than 5 days of MRI examination; B, liver surgery patients; C. Intrahepatic space-occupying lesions. 21 cases were included in this study eventually. After finishing MR scanning, the raw data were uploaded to the Philips workstation (ISP10.0). T1 and T2 values were measured by two observers (MRI diagnostic experience for 3 years and 2 years) respectively. ROIs were placed manually in the left hepatic lobe, liver right anterior, and posterior lobe of liver maximum level (Figure 1). The statistical analysis was performed with SPSS 22.0 software. The inter-class correlation coefficient (ICC) was used to test the measurement consistency. Spearman analysis was used to explore the relationship between T1/T2 times and hepatic function tests indexes in patients with liver cirrhosis.Results
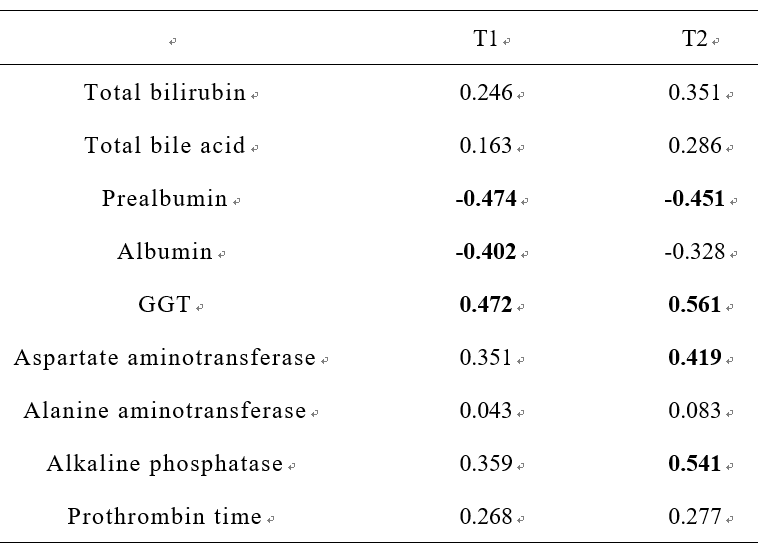
Statistical analysis revealed a negative correlation between T1 values and prealbumin as well as albumin (r = 0.474 and 0.402, P<0.05) and between T2 values and prealbumin (r = 0.451, P<0.05). In contrast, T1 values were found to be positively correlated with albumin (r = 0.472, P<0.05). T2 values were found to be positively correlated with GGT, Aspartate aminotransferase as well as Alkaline phosphatase (r = 0.561, 0.419, 0.541, P<0.05)Discussion and conclusion
In this study, the correlations between T1/T2 times of liver cirrhosis and the liver function indexes are observed in patients with cirrhosis. Since the clinical liver function indexes could reflect the degree of abnormality of liver function, quantitative relaxation time mapping might be a potential clinical method to evaluate liver function non-invasively.Acknowledgements
No acknowledgments.References
1. Obmann VC, Berzigotti A, Catucci D, et al. T1 mapping of the liver and the spleen in patients with liver fibrosis-does normalization to the blood pool increase the predictive value? Eur Radiol. 2021 Jun;31(6):4308-4318.
2. Erden A, Kuru Öz D, Peker E, et al. MRI quantification techniques in fatty liver: the diagnostic performance of hepatic T1, T2, and stiffness measurements in relation to the proton density fat fraction. Diagn Interv Radiol. 2020 Dec 8.
3. Huh J, Ham SJ, Cho YC, et al. Gadoxetate-enhanced dynamic contrast-enhanced MRI for evaluation of liver function and liver fibrosis in preclinical trials. BMC Med Imaging. 2019 Nov 15;19(1):89.
4. Hoffman DH, Ayoola A, Nickel D, et al. T1 mapping, T2 mapping and MR elastography of the liver for detection and staging of liver fibrosis. Abdom Radiol (NY). 2020 Mar;45(3):692-700.
Figures