4221
Feasibility and Reproducibility of Multi-frequency MR elastography in healthy and diseased pancreas1radiology, Shengjing Hospital of China Medical University, Shenyang,, China
Synopsis
To determine the feasibility of multi-frequency MRE for assessing pancreatic stiffness in healthy volunteers and patients with pancreatic adenocarcinoma (PDAC).A total of 40 healthy volunteers and 10 patients with PDAC were prospectively recruited between March 2020 and October 2021.Each volunteer and patient underwent 3.0-T pancreatic MRE at frequencies of 30Hz, 40Hz, 60Hz, 80Hz and 100Hz.Shear stiffness of healthy pancreas and PDAC, pancreatic width and volume, waist circumference, and wave distance were measured. Image quality assessment was performed according to image quality score (IQS: 1~4,≥3 considered qualified).
Synopsis
To determine the feasibility of multi-frequency MRE for assessing pancreatic stiffness in healthy volunteers and patients with pancreatic adenocarcinoma (PDAC). We propose a multi-frequency pancreatic MRE scanning scheme to explore the optimal MRE imaging frequency for healthy volunteers PDAC patients. Our research shows that MRE at 30Hz and 40 Hz provides qualified wave images and reliable measurements of pancreatic stiffness, and MRE at 30Hz, 40 Hz and 60 Hz acceptable for PDACs.Methods
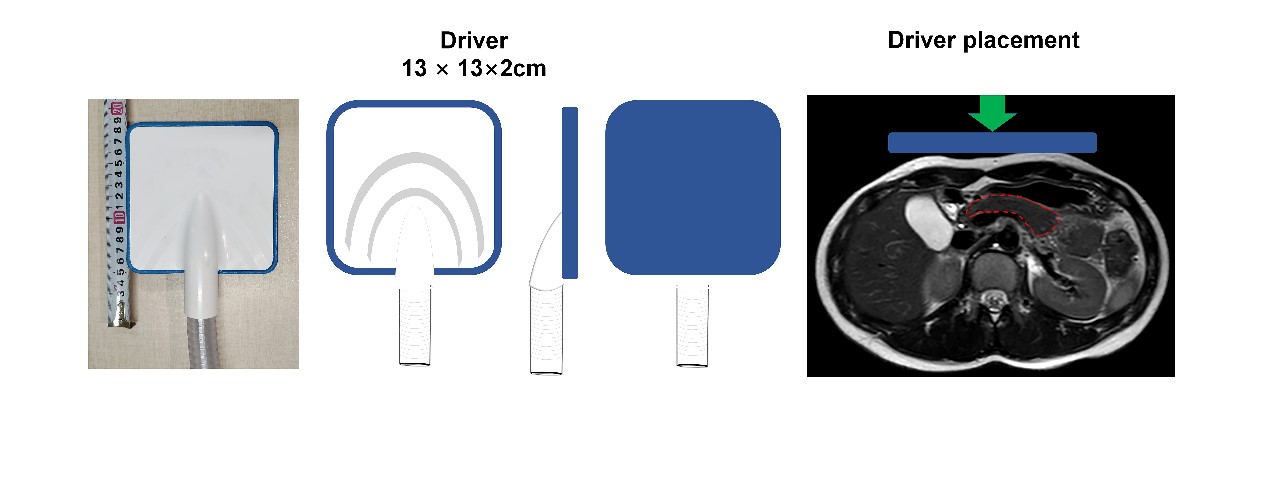
A total of 20 healthy volunteers and 5 patients with PDAC and main pancreatic duct obstruction (MPD ≥3 mm) were prospectively recruited between March 2020 and April 2021.All examinations were performed on an MR scanner (Signa HDX 3.0T system; GE Healthcare, Milwaukee, WI, USA) equipped with an eight-channel phased-array body coil. All subjects were instructed to fast for 6–8 hours before the examination. A rectangular semi-rigid driver (13× 13 cm) was placed against the upper abdomen, centred on the xiphisternum, and secured with a 20-cm-wide elastic band that wrapped around the body to ensure good coupling between the driver and the body. All subjects were placed in supine position. An active pneumatic driver system situated outside the scan room generated mechanical vibrations at the frequency of 30 Hz, 40 Hz, 60Hz, 80Hz and 100Hz for delivery to the upper abdomen via a plastic tube. Thirty-two consecutive slices were acquired within 5 breath holds (4 of 24 s and 1 of 12 s) at 30 Hz; 5 breath holds (4 of 22 s and 1 of 11 s) at 40 Hz; 3 breath holds (3 of 21 s) at 60 Hz; 3 breath holds (3 of 22 s) at 80 Hz and 3 breath holds (3 of 23 s) at 100 Hz. The imaging parameters for 3D SE-EPI MRE were as follows: The repetition time at each frequency is the same, repetition time = 1375ms; at each frequency the echo times for any particular patient were the same, and ranged from about 37.7–40.5 ms; depending on the patient weight; field of view = 36–44 cm; matrix size = 96 × 96; slice thickness = 3.5 mm; phase offsets = 3; parallel imaging acceleration factor = 3. In addition to MRE sequences, we also obtained routine plain pancreatic MRI studies, including respiratory-triggered T2-weighted imaging with/without fat suppression and T1-weightedimaging (T1WI).
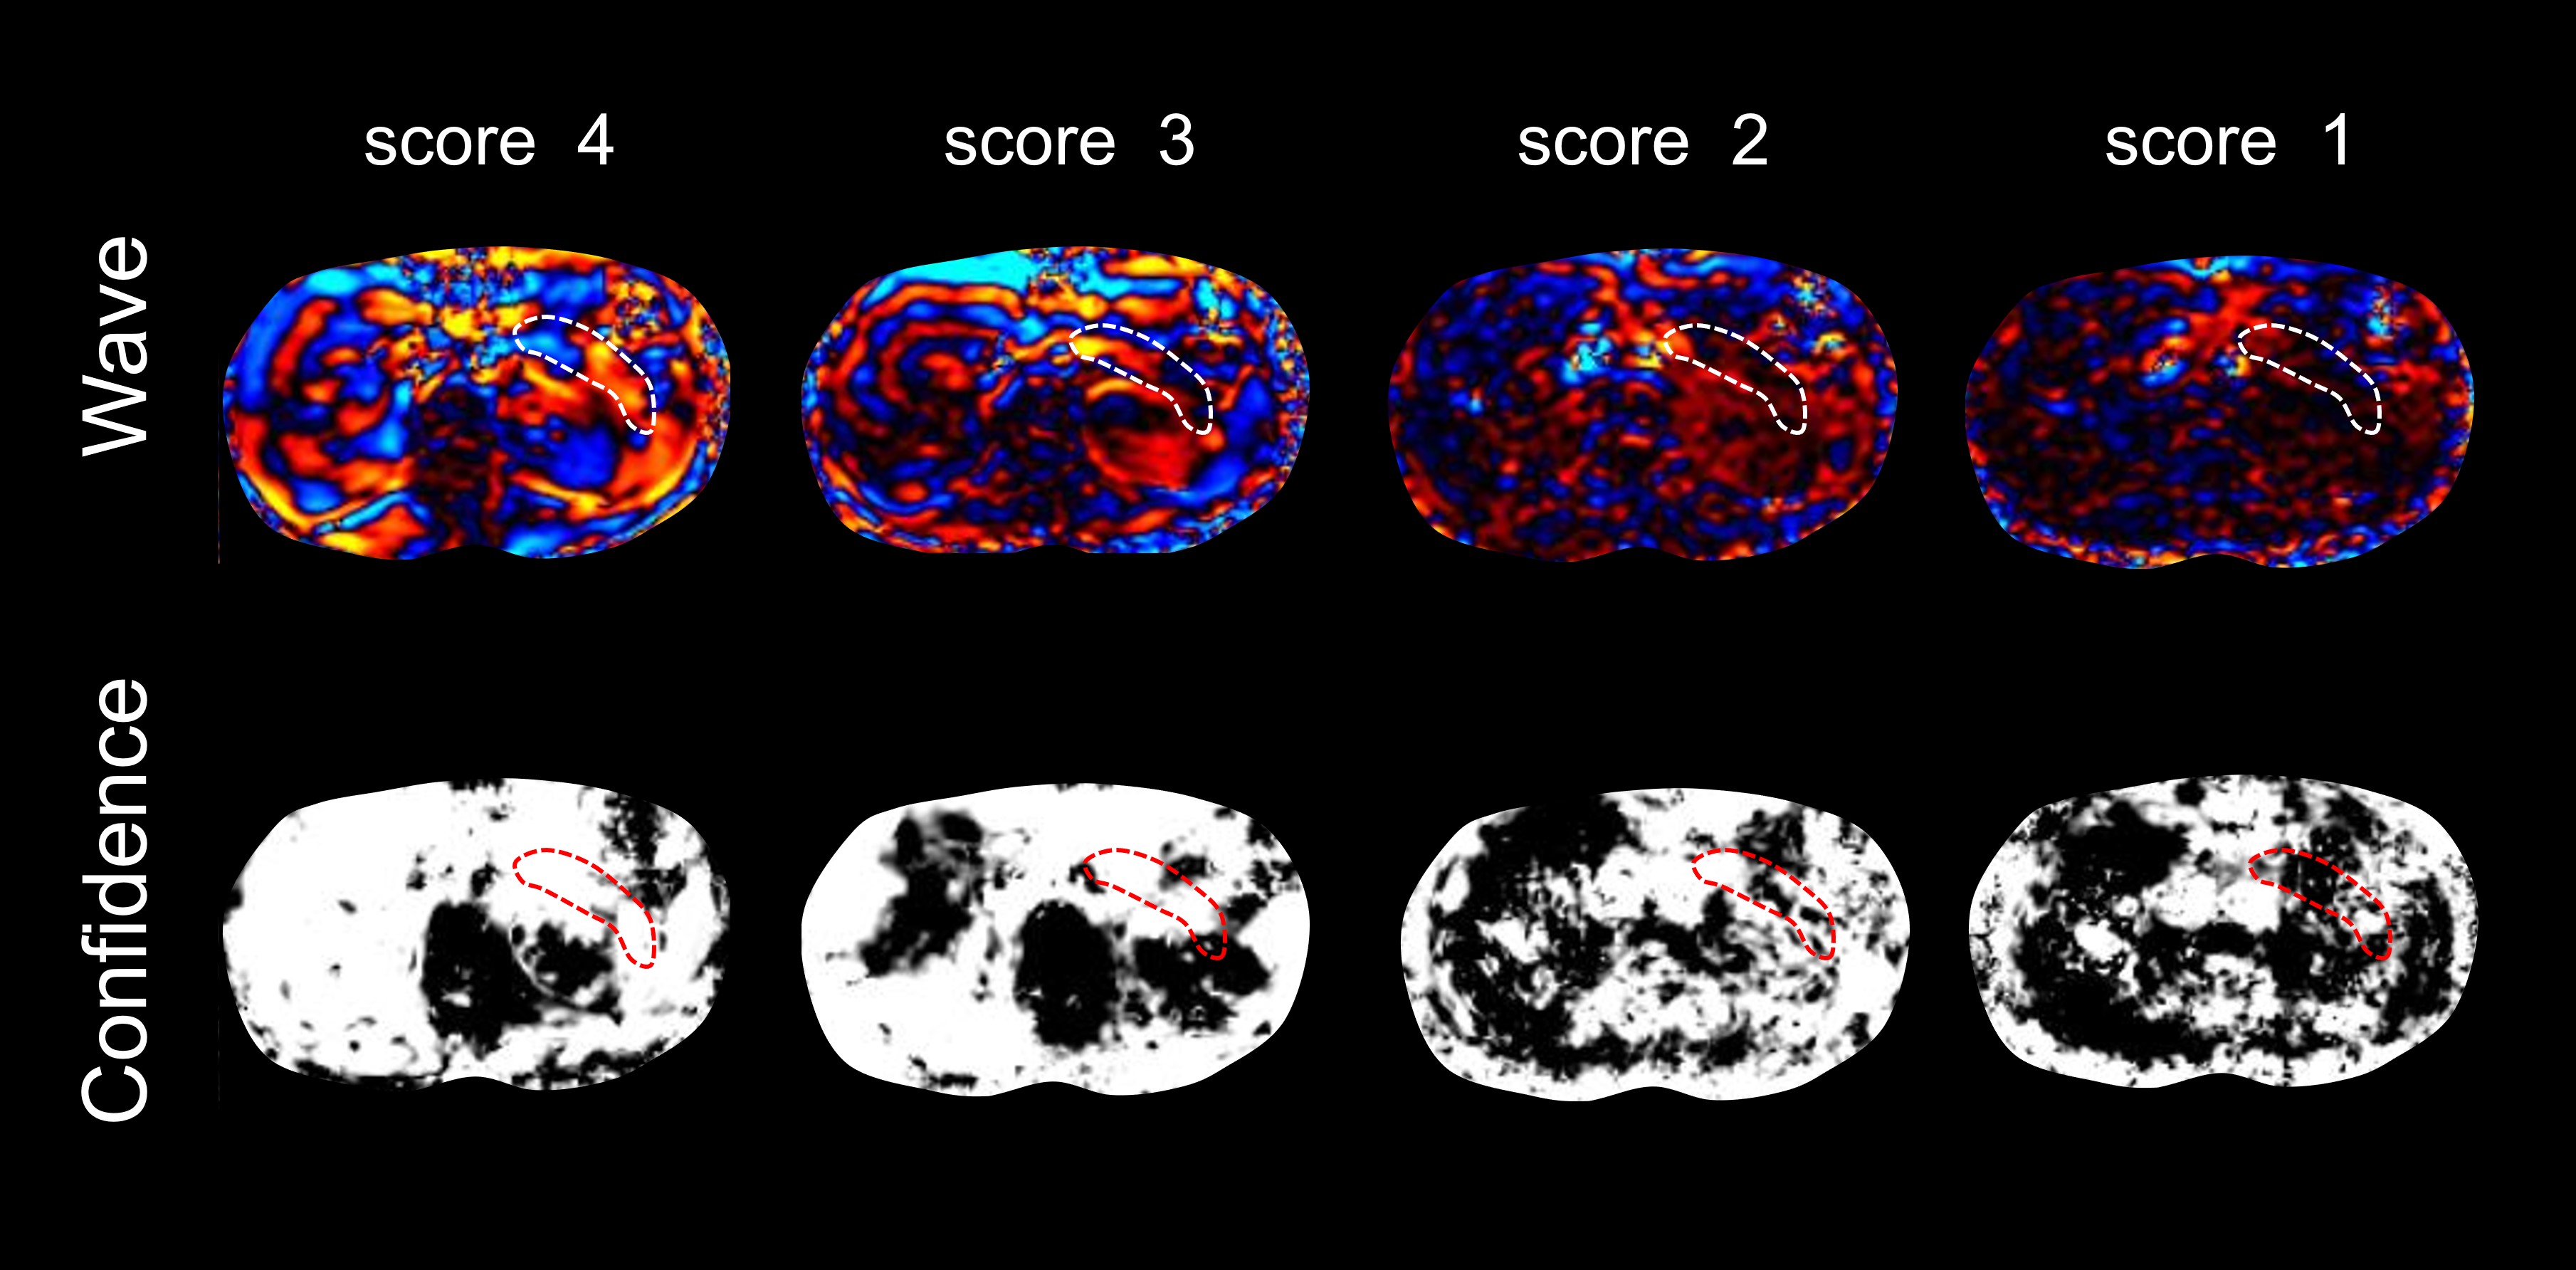
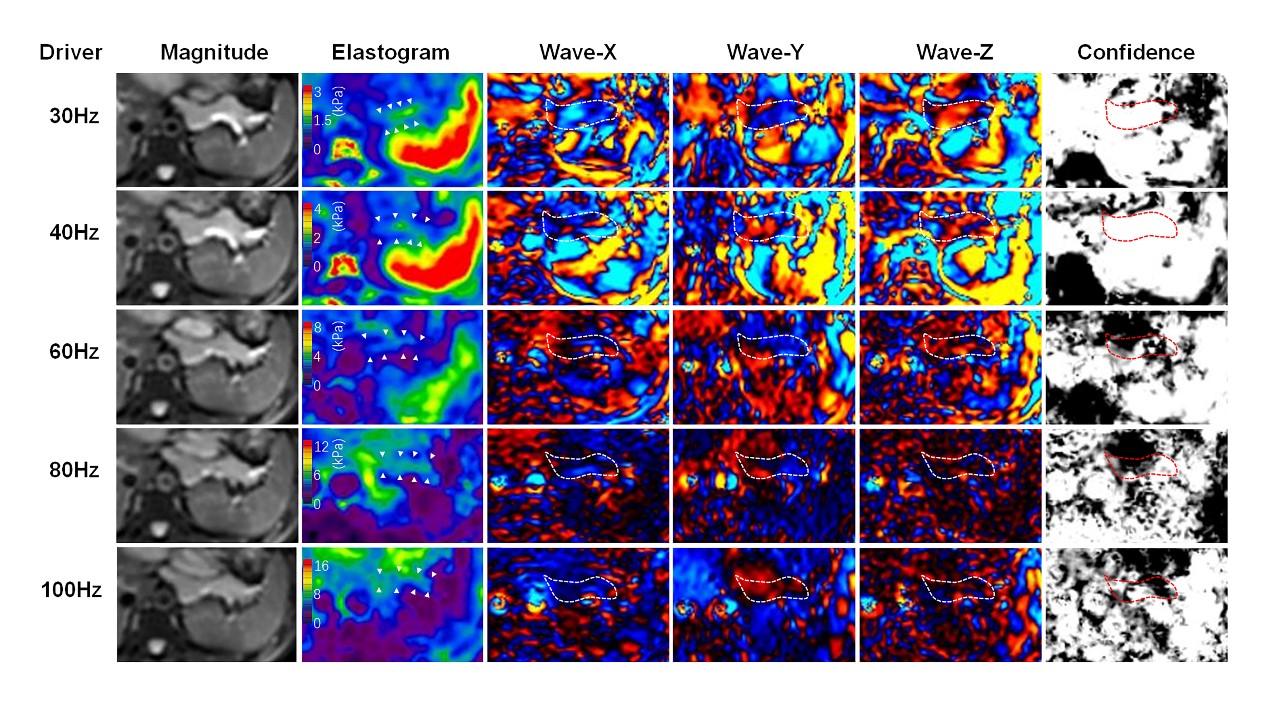
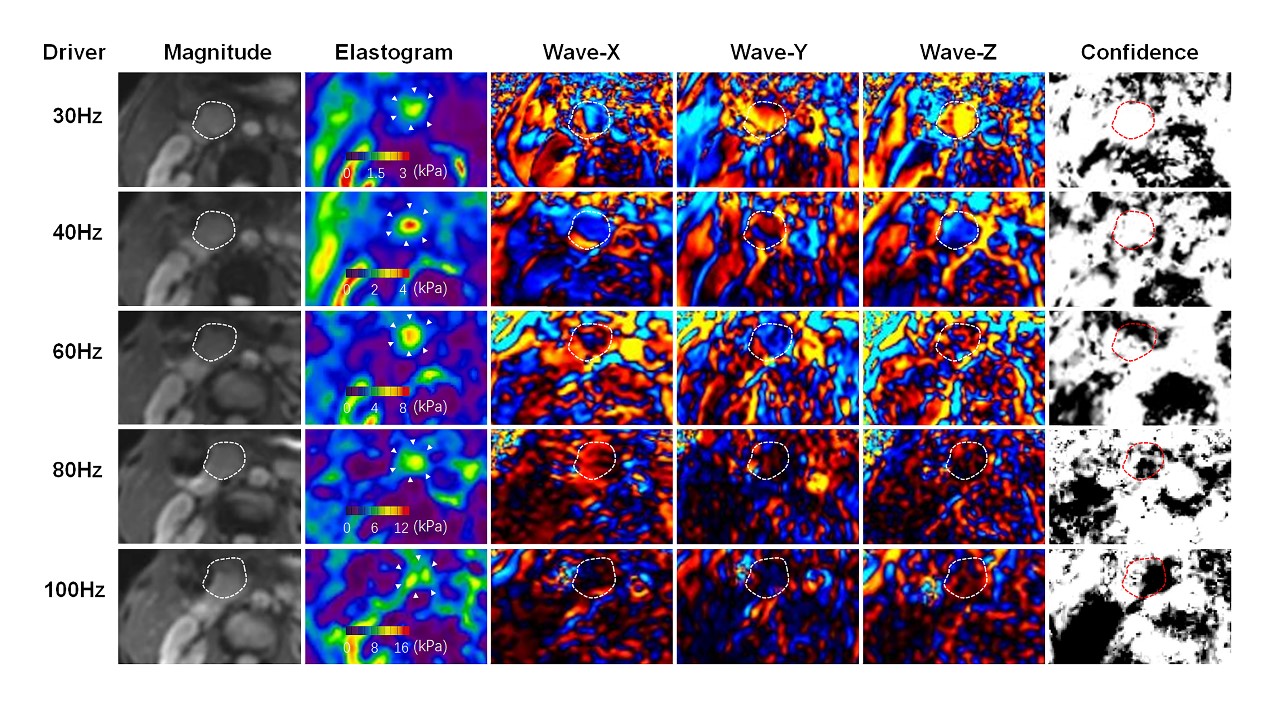
The post-processing software was supplied by the Mayo Clinic, Rochester, MN, USA, compatible with the MRE pulse sequence. A direct inversion of the Helmholtz wave equation was performed to estimate the tissue stiffness(1). X, Y and Z curled wave images, magnitude images, and local frequency estimation (LFE) confidence maps were also automatically generated. Regions of interest (ROIs) were drawn on the level that can show the largest cross-section of 5 subregions, including 3 subregions (head [uncinated], body and tail) for healthy pancreas, and 2 subregions (PDAC and its pancreatic distal remnant [1-2cm away from PDAC]) for patients at the magnitude images, avoiding the pancreatic border, large vessels, and the surrounding tissues(2). We refer to the 4-point wave image quality score (IQS) method(3) and combine the confidence map to comprehensively evaluate the image quality. The ratings for image quality and measurements of pancreatic stiffness were assessed separately for head, body, and tail in volunteers and for PDAC and pancreatic remnant for patients).The wave distance was described as minimum perpendicular distance between anterior abdominal wall and each ROI, which was also obtained from axial T1-weighted images. Pancreatic volume estimates were calculated as the product of voxel count and voxel size.
Results
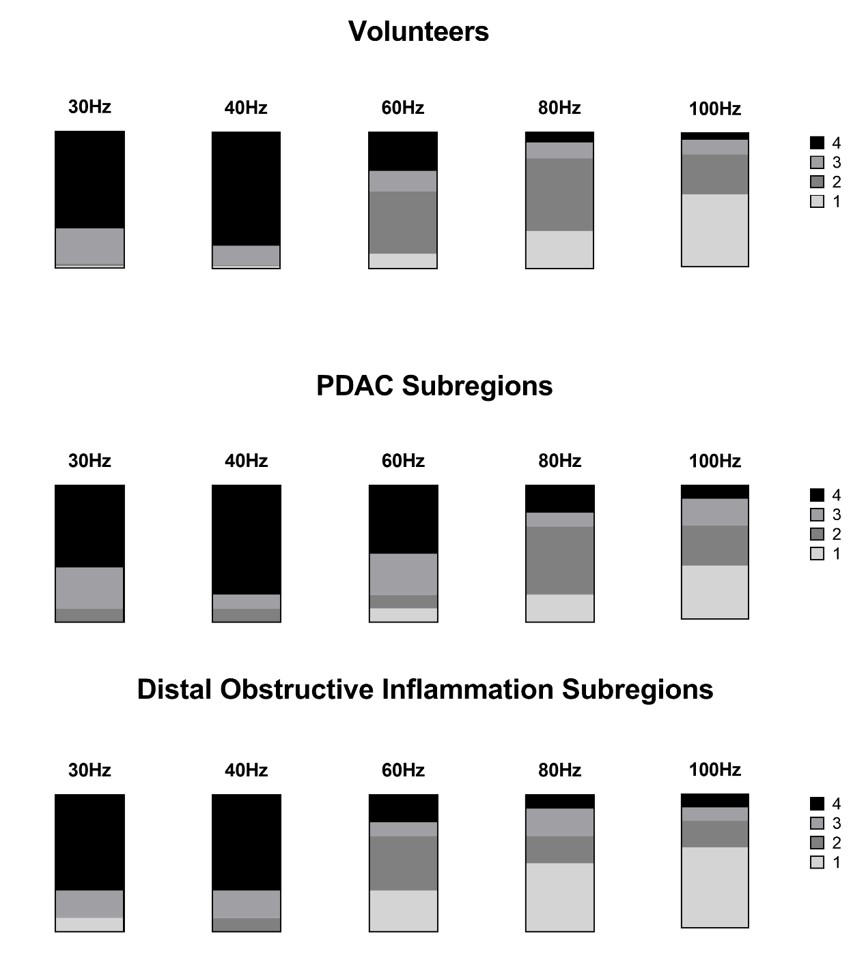
In logistic regression analysis, qualified IQS in healthy volunteers was independently associated with smaller BMI (Odds Ratio [OR] = 0.89, P = 0.003), shorter wave distance (OR = 0.70, P = 0.028), lower frequency (30 Hz, OR = 71.13, P <0.001; 40 Hz, OR = 90.85, P <0.001, respectively). Qualified IQS in PDAC was independently associated with frequency (30Hz, OR = 21.0, P =0.016; 40Hz, OR = 21.0, P =0.016, 60Hz, OR = 9.33, P =0.033, respectively), when using 100Hz as reference. The mean shear stiffness in healthy pancreas at 30Hz and 40 Hz was 0.74±0.07kPa and 1.18±0.10kPa, respectively. The mean shear stiffness of PDAC at 30Hz, 40Hz and 60Hz was 1.41±0.14kPa, 3.50±0.34kPa and 4.76±0.52kPa, respectively.Discussion
Theoretically, the data at 60-100Hz should give rise to improved resolution because the shorter shear wave length at the higher frequency can improve the calculation of stiffness. However, MRE at 60-100Hz appeared to deliver waves superficially, showing narrow penetration and less parallel waves, with illumination only immediately under the skin or confined to the pancreatic body.In PDAC, MRE at 60Hz also produced diagnostic quality images. This mainly due to PDAC lesions had a much higher mean stiffness value than that of the normal pancreas. The higher mean stiffness value indicates longer wavelengths and less energy loss from the propagated waves.
Conclusion
MRE at 30Hz and 40 Hz provides qualified wave images and reliable measurements of pancreatic stiffness, and MRE at 30Hz, 40Hz and 60Hz acceptable for PDACs.Acknowledgements
No acknowledgement found.References
1. Manduca, A., D.S. Lake, S.A. Kruse, et al. Spatio-temporal directional filtering for improved inversion of MR elastography images.Med Image Anal, 2003. 7(4):465-73.
2. Venkatesh, S.K., M. Yin,R.L. Ehman. Magnetic resonance elastography of liver: technique, analysis, and clinical applications.J Magn Reson Imaging, 2013. 37(3):544-55.
3. Ji, R., J. Li, Z. Yin, et al. Pancreatic stiffness response to an oral glucose load in obese adults measured by magnetic resonance elastography.Magn Reson Imaging, 2018. 51:113-119.
Figures