4220
An Automatic Abdomen MR-Quantification based on a Simultaneous Multi-Parameter Mapping within 3 Breath-holds and deep-learning Segmentation1Shanghai University of Medicine & Health Sciences, Shanghai, China, 2West China School of Medicine/West China Hospital, Sichuan University, Chengdu, China, 3Shanghai Key Laboratory of Magnetic Resonance, East China Normal University, Shanghai, China, 4MR Scientific Marketing, Siemens Healthineers, Shanghai, China
Synopsis
For automatic abdomen quantification, a rapid and simultaneous multi-parameter mapping method was evaluated, which could acquire quantitative R1, R2* and PDFF indices within 3-4 breath-holds. By adopting automatic organ segmentation, it could directly generate MR quantitative information for liver, kidney and spleen, which could be potentially used for liver pathology evaluation. The result showed that the multi-parameter sequence could generate high-quality R1, R2* and PDFF maps, with well B1 field correction and fat signal separation.
Introduction
Due to the prevalence of Liver disease internationally, quantitative and non-invasive methods are desired to evaluate the status of liver or diagnosis and stage liver pathology. MR showed great potential recently for liver quantification. T1/T2* mapping and MR spectroscopy techniques were successfully used in quantifying liver fibrosis, steatosis and haemosiderosis [1]. While these techniques need scan independently, which take more acquisition time and the joint analysis of multiple sequences is not easy. To accelerate the acquisition, multi-point quantitative Dixon (qDixon) technique was introduced to simultaneously calculate proton density fat fraction (PDFF) and R2* for quantification of fat and iron deposition [2], with a very rapid acquisition time in one breath-hold, and is very promising in clinical application. In this study, a quick method was evaluated to simultaneously acquire PDFF, T1 and R2* quantification within 3-4 breath-hold, and try to potentially provide adequate information for comprehensive liver disease in one scan.Methods
Acquisition: Liver MR scanning was conducted using a 3T MR scanner (MAGNETOM Prisma Fit, Siemens Healthcare, Erlangen, Germany). The acquisition contains two 3D-multi-TE-GRE scans with three different flip angles (3˚,9˚,15˚) and an additional B1 mapping scan. The imaging parameters for 3D-multi-TE-GRE were as follows: TR=11.51ms, TE1/TE6/𝜟TE=1.07/10.02/1.79ms, FOV=334×382mm2, matrix=196×224, slice thickness=3.5mm, slice number=52, in-plane acceleration factor=4, total time 15.32secs for each scan. An additional B1 map sequence was acquired with following parameters: TR=5050ms, TE=1.83ms, FOV=309×381mm2, matrix=52×64, slice thickness=8mm, total time 10secs.Quantification Algorithm: The algorithm contains 4 steps: 1) Water, fat signal and R2* map at each flip-angle were calculated from 3 scans independently by a quantitative Dixon (qDixon) technique, the T2*-IDEAL algorithm, based on a single R2* and 6-peak fat model, with the inhomogeneity magnetic field initialized by Spurs-gc algorithm[3]; 2) R2* maps from different flip angle were averaged to increase signal-to-noise ratio (SNR), and PDFF was calculated by dividing fat signal by total signal (fat+water). The signals at flip angle 3 was limited influence of T1 effect; 3) The additional B1+ map was used for correction, which was interpolated to the same image size of water signals; 4) water signals at 3 flip angles and the interpolated B1 map were then used to calculate T1 map using equation S(FA) = water(FAb1) × sin(FA b1) × (1 – exp(-TR/T1) / (1 – cos(FA b1) × exp(-TR/T1)), where FA b1 was flip angle corrected by B1 map. The algorithm was implemented in Matlab 2017a and Python 3.5. Abdomen Segmentation: The liver, kidney and spleen were automatically segmented using a deep-learning network. A pre-trained model from nnUNet[4] was used, which is based on the CHAOS open-source dataset (https://chaos.grand-challenge.org/Download/). Four region-of-interests (ROIs) were generated for liver, left and right kidney and spleen, and their volume and corresponding PDFF, R1, R2* value were also calculated.
Results
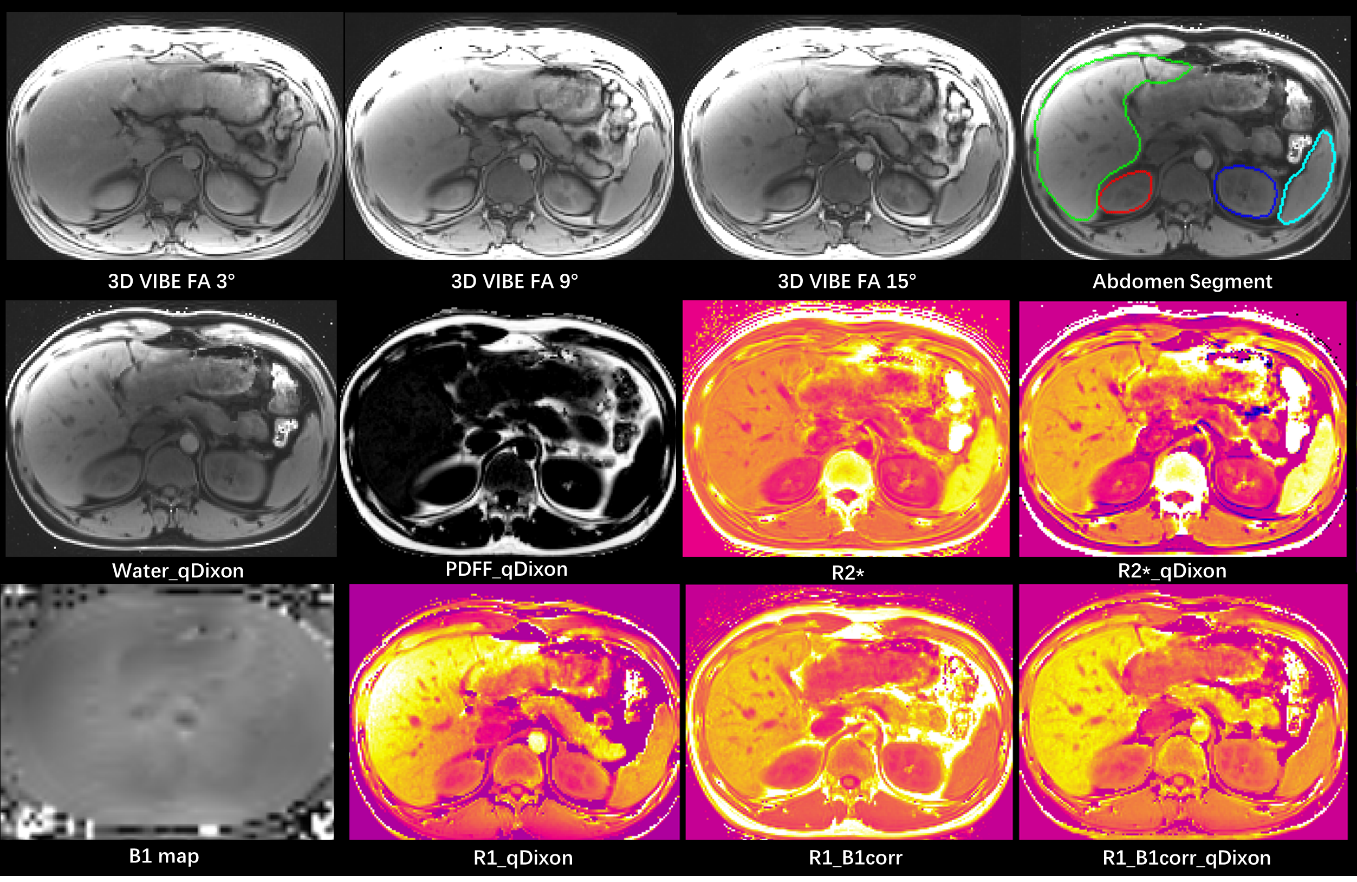
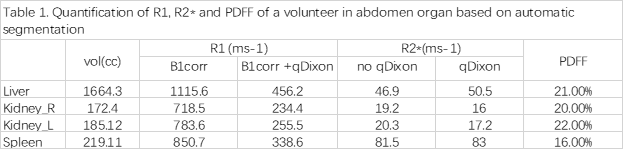
The result showed that this simultaneously R1, R2*, and PDFF quantification are feasible within 3-4 breath-holds, with good mapping SNR and free of motion artifacts when subject could control motion (Figure 1). The B1 correction compensated the signal variation due to B1 field inhomogeneity in liver effectively and showed significant influence on R1 map. By qDixon technique, the fat signal was well suppressed, and the visibility of abdomen organ boundary was much better than those without Dixon (see Figure 1). For quantitative comparison, the fat-water-separation showed small influence on R2* map, and the R2* values with and without fat-water separation were similar in liver, kidney and spleen respectively (see Table 1), though obvious difference could be found between R2* maps with and without qDixon in Figure 1. Meanwhile, the fat-water separation showed great influence on R1 map, and the R1 values with fat-water separation were much lower than those without.Discussion and Conclusions
In this study, we introduced a simultaneous multi-parameter mapping method for abdomen, within 3-4 breath-holds. The method could generate high quality R1, R2* and PDFF map with B1 inhomogeneity correction and fat signal separation. Moreover, by deep-learning network, the abdomen organ could be automatically segmented, thus quantitative feature of liver or other organ could be directly extracted for further pathology evaluation. In the future work, the correlation between quantitative imaging feature and pathology status will be analyzed. In addition, the accuracy of automatic segmentation needs further improvement for more reliable performance.In conclusion, a rapid and simultaneous multi-parameter mapping method was evaluated, which could acquire multiple MR quantification indices within 3-4 breath-holds. By adopting automatic organ segmentation, it could be potentially used for liver pathology evaluation.
Acknowledgements
No acknowledgement found.References
1. Banerjee, R., et al. Multiparametric magnetic resonance for the non-invasive diagnosis of liver disease. J Hepatol, 2014; 60(1): 69–77.
2. Bydder M, et al. Relaxation effects in the quantification of fat using gradient echo imaging. Magn Reson Imaging 2008;26:347-359.
3. Dong J, Liu T, Chen F, et al. Simultaneous phase unwrapping and removal of chemical shift (SPURS) using graph cuts: application in quantitative susceptibility mapping. IEEE Trans Med Imaging 2015;34:531-540.
4. Isensee F, Jaeger P F, Kohl S A A, et al. nnU-Net: a self-configuring method for deep learning-based biomedical image segmentation[J]. Nature Methods, 2021. 18(2): 203-211.
Figures