4217
Assessment of susceptibility-weighted Imaging in the staging of liver fibrosis1Department of Radiology, Zhujiang Hospital, Southern Medical University, Guangzhou, China, Guangzhou, China, 2Philips Healthcare, Guangzhou, China, Guangzhou, China
Synopsis
Diagnosing and staging liver fibrosis arouse worldwide concern, and the value of susceptibility-weighted Imaging (SWI) score combined with serum indexes in staging liver fibrosis is controversial. The objective of this study was to assess if SWI score combined with serum indexes could increase the accuracy of staging liver fibrosis. With the help of multivariate ordered logistic regression model, SWI score and serum indexes showed significant correlations with stages of liver fibrosis.
Introduction
Liver fibrosis represents a significant public health concern worldwide. One view is that liver fibrosis is a reversible process and cirrhosis is oppositely irreversible[1]. So there is a general recognition of the urgent need for a noninvasive methods to confirm the diagnosis of liver fibrosis. Magnetic resonance Imaging (MRI) may be an ideal noninvasive surrogate for liver biopsies[2].The correlation between SWI and liver fibrosis has been proved in previous studies[3,4], but the value of SWI score combined with serum indexes in staging liver fibrosis is controversial. Therefore, we aimed to combine SWI score and serum indexes to increase the accuracy of staging liver fibrosis.Material and Methods
93 patients who suffered from suspected or known liver fibrosis without liver surgery history, and 11 healthy volunteers were assisted in our research after giving informed consent. Clinical information and laboratory parameters were determined within one week before the MRI scan, including age, gender, platelet count, total bilirubin levels, aspartate aminotransferase (AST), alanine aminotransferase (ALT), International Normalized Ratio (INR) and albumin. Patients and volunteers were examined on a 3.0T MRI scanner (Ingenia, Philips Healthcare, Best, The Netherlands) with an Abdominal phased array coil in a fasting state (4h prior to exam).The SWI parameters were as follows: time of repeatation (TR) =100 ms, flip angle =20°, echo number=1, time of echo (TE) =10 ms, field of view (FOV) =30 cm×26 cm, slice thickness=5mm, number of slice=2, matrix size =120×102×2, voxel size =2.5×2.51×5 mm3. The acquisition time for each sequence was 11 seconds during one breath hold. Routine sequences like T1 weighted images and T2 weighted images were also performed for anatomical evaluation. The signal intensity (SI) of liver and both sides in lumbar back muscles were measured, avoiding large vessels, bile ducts and the border of liver. Whereafter, the liver-to-muscle SI ratios (SIR) were calculated.Result and Discussion
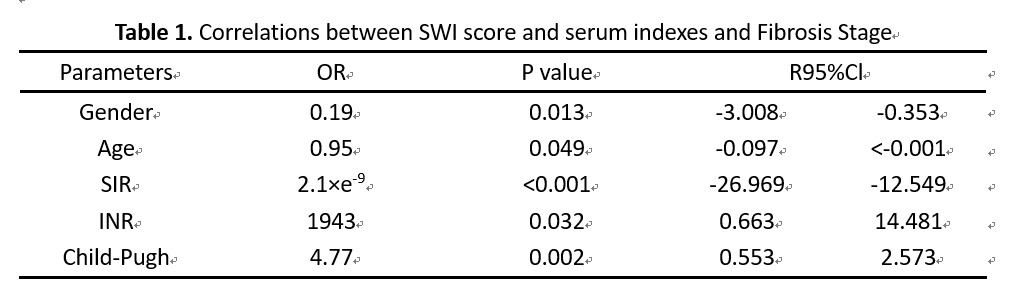
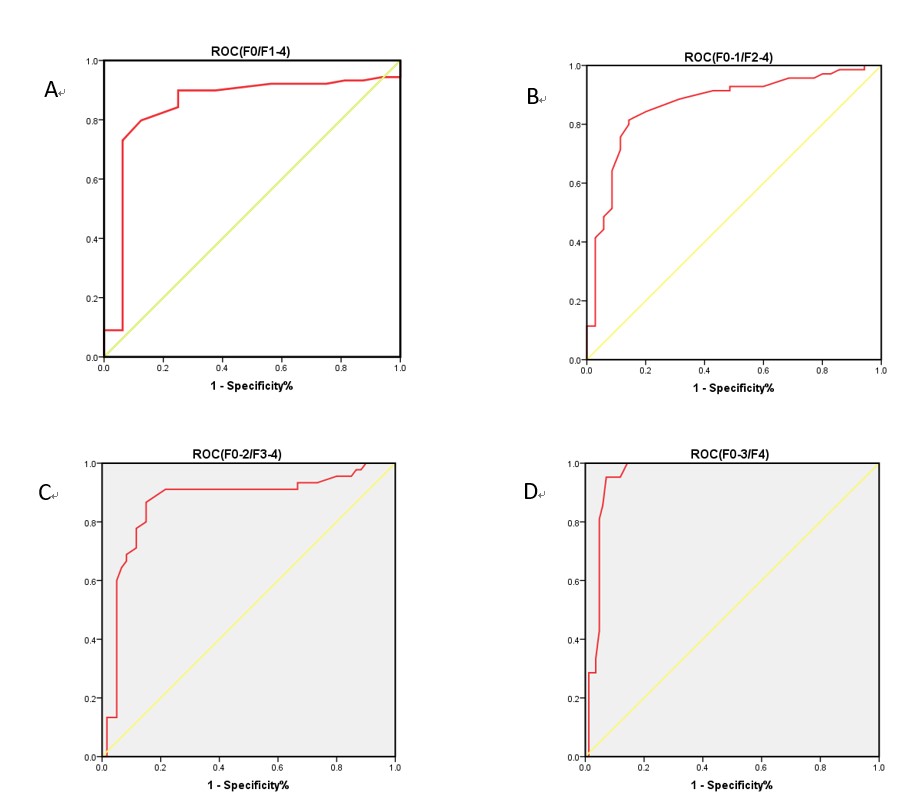
104 receivers were included in total, and 16, 19, 25, 24, and 21 patients were diagnosed as F0-F4. Gender, age, SIR, AST, ALT, total bilirubin levels, platelet count, INR and specific scoring system of liver which including Child-Pugh score, Fibrosis 4 Score were selected as dependent variables with the methods of Spearman bivariate correlate analysis and collinearity diagnostics.Through constructing a multivariate ordered logistic regression model, our study indicated the gender (OR=0.19, P=0.013), age (OR=0.95, P=0.049), SIR (OR=2.1×e-9, P<0.001), INR (OR=1943, P=0.032), Child-Pugh (OR=4.77, P=0.002) score were the independent influencing factors of liver fibrosis (Table 1). Moreover, the receiver operator characteristic (ROC) curves for differentiation of fibrosis stages with SIR values were as follows (Figure 1). Area under the Curve (AUC) of F0 and F1-4 were 0.846 (P<0.001), AUC of F0-1 and F2-4 were 0.867 (P<0.001), AUC of F0-2 and F3-4 were 0.866 (P<0.001), AUC of F0-3 and F4 were 0.958 (P<0.001). Statistical significance existed in the above content.
Conclusion
Assessment of SWI score and serum indexes exhibited that the SIR combining with serum indexes were of great potential in the staging of liver fibrosis.Acknowledgements
Thanks are due to my tutor Xianyue Quan and my colleagues for their theoretical and spiritual support in my study, and thanks to the engineer Chen Zhao of Philips Healthcare for technical support in my study. My study would not acquire success without their help.References
[1] Atta H M. Reversibility and heritability of liver fibrosis: Implications for research and therapy[J]. World Journal of Gastroenterology, 2015; 21(17): 5138-5148.
[2] Dillman J R, Trout A T, Costello E N, et al. Quantitative Liver MRI-Biopsy Correlation in Pediatric and Young Adult Patients With Nonalcoholic Fatty Liver Disease: Can One Be Used to Predict the Other? [J]. American Journal of Roentgenology. 2018; 210(1): 166–174.
[3] Obmann V C, Marx C, Berzigotti A, et al. Liver MRI susceptibility-weighted imaging (SWI) compared to T2* mapping in the presence of steatosis and fibrosis[J]. European Journal of Radiology. 2019; 118: 66–74.
[4] Balassy C, Feier D, Peck-Radosavljevic M, et al. Susceptibility-weighted MR Imaging in the Grading of Liver Fibrosis: A Feasibility Study[J]. Radiology. 2014; 270(1): 149–158.
Figures