4214
Evaluation of amide proton transfer-weighted imaging and stretch index diffusion imaging for lung cancer staging and its correlation with Ki671Department of Radiology, Henan University People’s Hospital & Henan Provincial People’s Hospital, Zhengzhou, China, 2Department of Radiology, Zhengzhou University People’s Hospital & Henan Provincial People’s Hospital, Zhengzhou, China, 3Xinxiang Medical University & Henan Provincial People's Hospital, Xinxiang, China, 4Department of Radiology, Henan Provincial People’s Hospital, Zhengzhou, China, 5UIH Group, Central Research Institute, Beijing, China, 6UIH Group, Central Research Institute, Shanghai, China
Synopsis
Amide proton transfer-weighted imaging (APTWI) primarily reflects the protein content and acidity information of tissue structures. Stretch index diffusion imaging includes α, DDC values, these parameters reflect the heterogeneous characteristics of tumors. Ki67 is a good indicator to evaluate the proliferative activity of tumor cells. The results showed that APTWI and stretch index diffusion imaging had similar diagnostic performance in the diagnosis of lung cancer staging,and there was a certain correlation between the parameters and Ki67.
Introduction
At present, lung cancer has become the number one killer of cancer-related death in the world [1]. Its clinical stage is an important factor affecting the treatment scheme and survival prognosis of lung cancer. APTWI (amide proton transfer weighted imaging), as an important branch of chemical exchange saturation transfer (CEST) technology, is a new imaging technology used to detect the exchange saturation of amide protons to specific chemicals [2], which can be used to detect the content of free proteins and peptides in tissues. The stretch index diffusion model based on multiple b values can more closely reflect the diffusion of water molecules in living tissues and the heterogeneity within voxels [3]. APTWI and stretch index diffusion imaging are currently rarely used in the lungs, especially there are fewer comparative studies between the two. This study aims to use APTWI and stretch index diffusion imaging to identify and diagnose lung cancer stage, and analyze the correlation between each parameter and Ki67 [4], to provide more help for the diagnosis and treatment of lung cancer.Material and Methods
In this study, 55 patients with lung cancer were staged according to the International Association for the Study of Lung Cancer (IASLC) eighth edition TNM staging, including 21 patients with early-stage ( ≤ stage IIIA) and 34 patients with advanced-stage ( ≥ stage IIIB). The study was performed on a hybrid 3.0T PET/MR scanner (uPMR790, UIH, Shanghai, China) with a 12-channel phased-array body coil. The IVIM sequence was set with the following parameters: TR = 1620 ms, TE = 69.6 ms; b-values = 0, 25, 50, 100, 150, 200, 400, 600, 800, and 1000 s/mm 2, number of averages = 1, 1, 2, 2, 4, 4, 6, 6, 8, 10. CEST MRI was performed by using a single slice FSE protocol, parameters are as follows: ETL = 39, B1 = 1.3μT and 2.5μT, Gaussian pulse, 100ms duration, 10 repeats, Δ spanned from [-4.5 4.5] ppm in 31 steps, plus one S0 with no CEST saturation pulse for normalization; 11 low power B1 = 0.13μT, Δ spanned from [-1.0 1.0] ppm images were collected as WASSR images for B0 map correction, TR/TE/Flip Angle = 4500ms/35.4ms/160o. The ROI was placed on as many solid tumor sites as possible, while avoiding areas prone to bleeding, necrosis and cystic changes, etc. The software automatically generated and recorded each parameter value. SPSS 23.0 and Medcalc 15.0 were used for data analysis. The independent sample t-test was applied for between-group analyses. The correlation between each parameter and Ki67 was analyzed by Pearson correlation coefficient. ROC curve was generated to evaluate the diagnostic accuracy of each parameter. The Delong method was used to compare the AUCs of different parameters. P<0.05 is considered statistically significant.Results
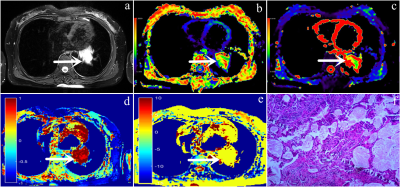
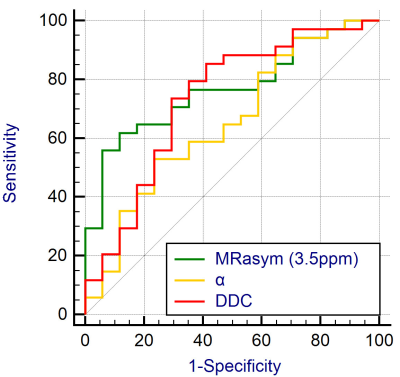
The MRasym (3.5ppm) value of the advanced-stage group [(3.86 ± 3.05) %] was significantly higher than that of the early-stage group [(1.44 ± 1.33) %], while the DDC value of the advanced-stage group [(1.52 ± 0.46) ×10-3mm2/s] was significantly lower than that of the early-stage group [(1.93 ± 0.85) ×10-3mm2/s]. There was no significant difference in α value between the two groups (Figure 1, 2). MTRasym (3.5ppm) of APTWI and DDC value of stretch index diffusion imaging showed AUC of 0.766 and 0.732 respectively, but the difference between them was not statistically significant (Figure 3). The MRasym (3.5ppm) value was weakly positively correlated with Ki67 (r = 0.368), the α value was moderately positively correlated with Ki67 (r = 0.557), and the DDC value was moderately negatively correlated with Ki67 (r = -0.429).Discussion
The MRasym (3.5ppm) of the advanced-stage group was higher than that of the early-stage group, while the DDC value was lower than that of the early-stage group. The reason may be that the advanced tumor cells proliferate more actively and have higher cell density, so they can synthesize more proteins and peptides, and the diffusion rate of water molecules slows down [5]. Higher Ki67 means higher cell proliferation activity, resulting in higher MRasym (3.5ppm) values and lower DDC values. However the α values were increased, which may be related to the varying degree of heterogeneity in advanced tumors [6], and the ROI outlined did not represent the heterogeneity of the entire tumor.Conclusion
Both APTWI and stretched exponential diffusion imaging can be used for the non-invasive assessment of lung cancer and have similar diagnostic efficacy. Meanwhile, these parameters have a certain correlation with Ki67.Acknowledgements
The National Key R&D Program of China (2017YFE0103600), the National Natural Science Foundation of China (81720108021 and 31470047), the Zhengzhou Collaborative Innovation Major Project (20XTZX05015).References
[1] Siegel RL, Miller KD, Fuchs HE, Jemal A. Cancer Statistics, 2021. CA Cancer J Clin. 2021;71(1):7-33.
[2] Kogan F, Haris M, Singh A, et al. Method for high-resolution imaging of creatine in vivo using chemical exchange saturation transfer. Magn Reson Med. 2014;71(1):164-172.
[3] Lai V, Lee VH, Lam KO, Sze HC, Chan Q, Khong PL. Intravoxel water diffusion heterogeneity MR imaging of nasopharyngeal carcinoma using stretched exponential diffusion model. Eur Radiol. 2015;25(6):1708-1713.
[4] Jakobsen JN, Sørensen JB (2013) Clinical impact of ki-67 labeling index in non-small cell lung cancer. Lung Cancer 79(1):1–7.
[5] Bai Y, Lin Y, Tian J, et al. Grading of Gliomas by Using Monoexponential, Biexponential, and Stretched Exponential Diffusion-weighted MR Imaging and Diffusion Kurtosis MR Imaging. Radiology. 2016;278(2):496-504.
[6] Lin M, Yu X, Chen Y, et al. Contribution of mono-exponential, bi-exponential and stretched exponential model-based diffusion-weighted MR imaging in the diagnosis and differentiation of uterine cervical carcinoma. Eur Radiol. 2017;27(6):2400-2410.
Figures


