4211
Quantification of multi-organ iron overload using R2* mapping in patients with transfusion-dependent diseases1Tianjin Medical University, Tianjin, China, 2Siemens Healthineers Ltd., Beijing, China, 3Siemens Healthcare GmbH, Erlangen, Germany, 4Tianjin First Central Hospital, Tianjin, China
Synopsis
We used R2* mapping to assess iron overload in multiple organs of patients with transfusion-dependent diseases and related the R2* values to transfusion volumes and serum ferritin (SF) levels. The organs assessed included the liver, spleen, pancreas, vertebral bone marrow, and myocardium. The results showed a correlation between the R2* values of multiple organs and between the R2* values of some organs and transfusion volumes. This study revealed differences in the distribution of iron overload in various organs and suggested that transfusion volumes could be used to predict the degree of liver iron overload in patients with transfusion-dependent diseases.
Introduction
Long-term transfusion could lead to transfusion-related multi-organ hemosiderosis, a cytotoxic condition that can lead to organ-specific complications. Furthermore, the dynamic process of iron absorption and clearance differs among various iron-sensitive organs 1. The early stages of iron overload do little harm to patients and are often ignored; however, iron deposition is an ongoing process due to the lack of an iron excretion mechanism 2. Therefore, the early assessment of multi-organ iron overload is essential for the proper treatment of these cases.The purpose of this study was to use R2* mapping to quantitatively measure iron deposition in the liver, spleen, pancreas, vertebral bone marrow, and myocardium of patients with transfusion-dependent diseases, and to explore the deposition characteristics in multiple organs. We studied the relationship of iron overload in these organs with red blood cell (RBC) transfusion volumes and serum ferritin (SF) levels.
Methods
Seventy-four patients with transfusion-dependent diseases (median age, 48 years [range 19-87], 40 males) and 21 healthy controls (HCs) (median age, 41 years [range 22-65], 8 females) were enrolled and subjected to MRI examinations using a 3T system (MAGNETOM Prisma, Siemens Healthcare, Erlangen, Germany) with an 18-channel body coil in combination of a 32-channel spin coil. R2* data for the abdomen were acquired using a prototypic 3D 6-echo DIXON VIBE sequence with breath-holding. Relevant parameters were as follows: repetition time (TR)=9.00 ms, echo time (TE)=1.07 / 2.86 / 4.65 / 6.44 / 8.23 / 10.02 ms, field of view (FOV)=400*350 mm2, matrix=111 x 160, bandwidth=1060 Hz/Px, flip angle=4°, slices=64, slice thickness=3.5 mm, and acquisition time=13 s. Cardiac R2* mapping was acquired using an 8-echo gradient echo (GRE) sequence with electrocardiogram (ECG) gating and breath-holding. The relevant parameters were as follows: TR=910.4 ms, TE=1.62 / 3.95 / 6.18 / 8.41 / 10.64 / 12.87 / 15.1 / 17.33 ms, FOV=360*270 mm2, flip angle=18°, bandwidth=1149 Hz/Px, and acquisition time=12 s. All the R2* maps were generated inline after data acquisition.R2* values of the liver, pancreas, spleen, bone marrow, and myocardium were measured, along with RBC transfusion volumes and SF levels. Representative images of patients with hemosiderosis are shown in Fig 1.
At 3 T, values of cardiac R2* >79 sec-1 were considered cardiac iron overload 3. Liver iron overload was defined as mild, moderate, and severe when R2* values were 120-435, 436-952, and >952 sec-1, respectively 3. Mean R2* values of the HCs plus two standard deviations (+ 2 SD) were employed as cutoff points for the other organs. R2* values of non-liver organs among patients with different liver iron overload levels were compared with reference values. Spearman correlation analysis was used to assess correlations between the R2* values of each organ and RBC transfusion volumes and SF levels.
Results
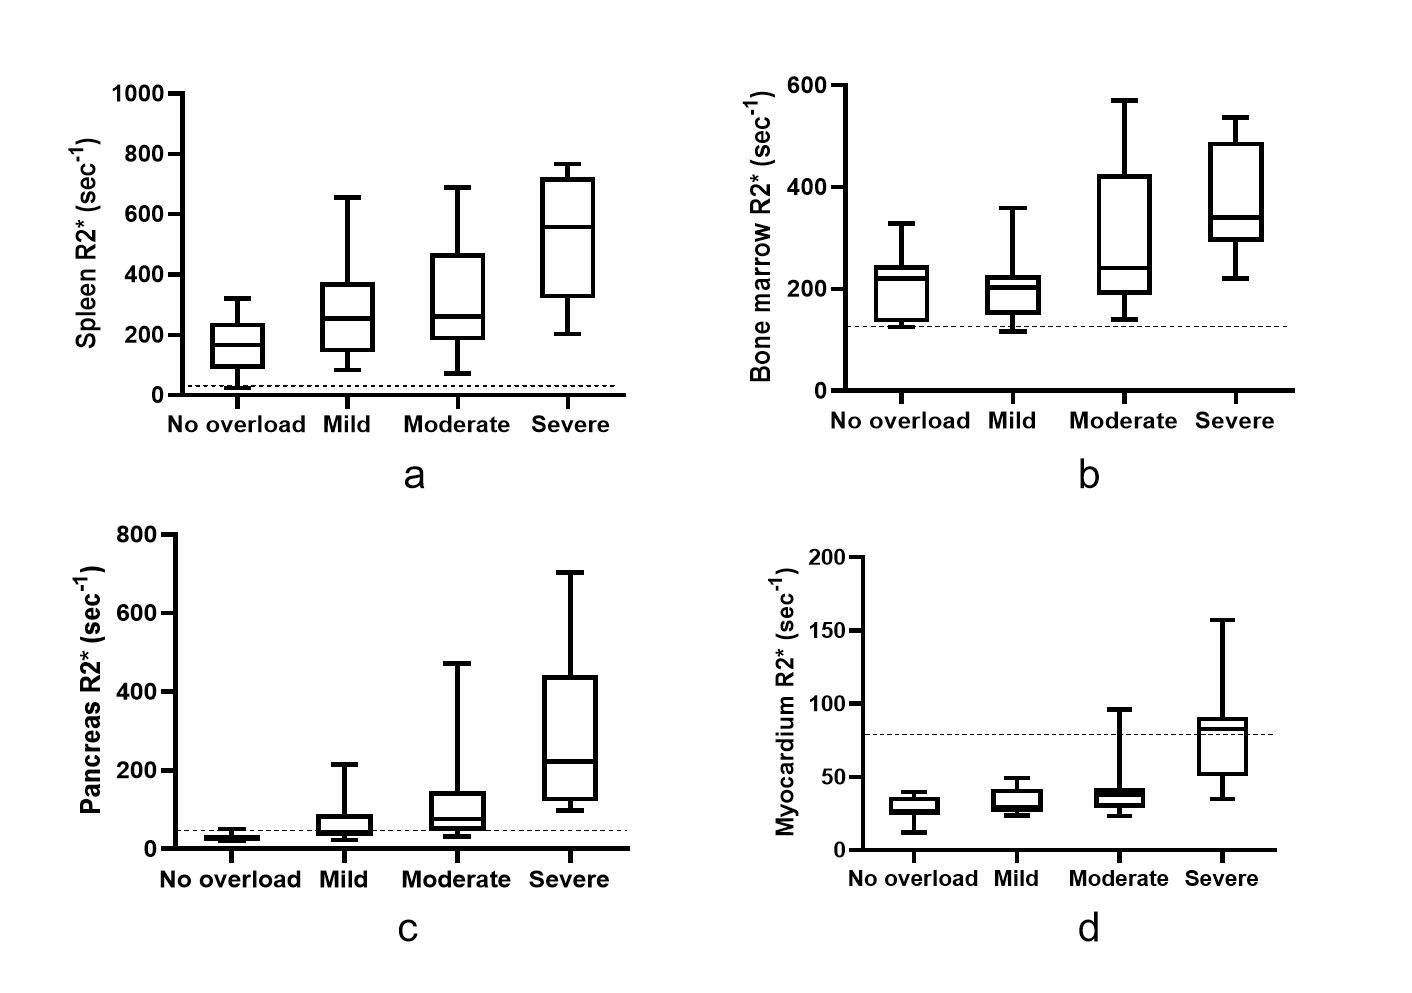
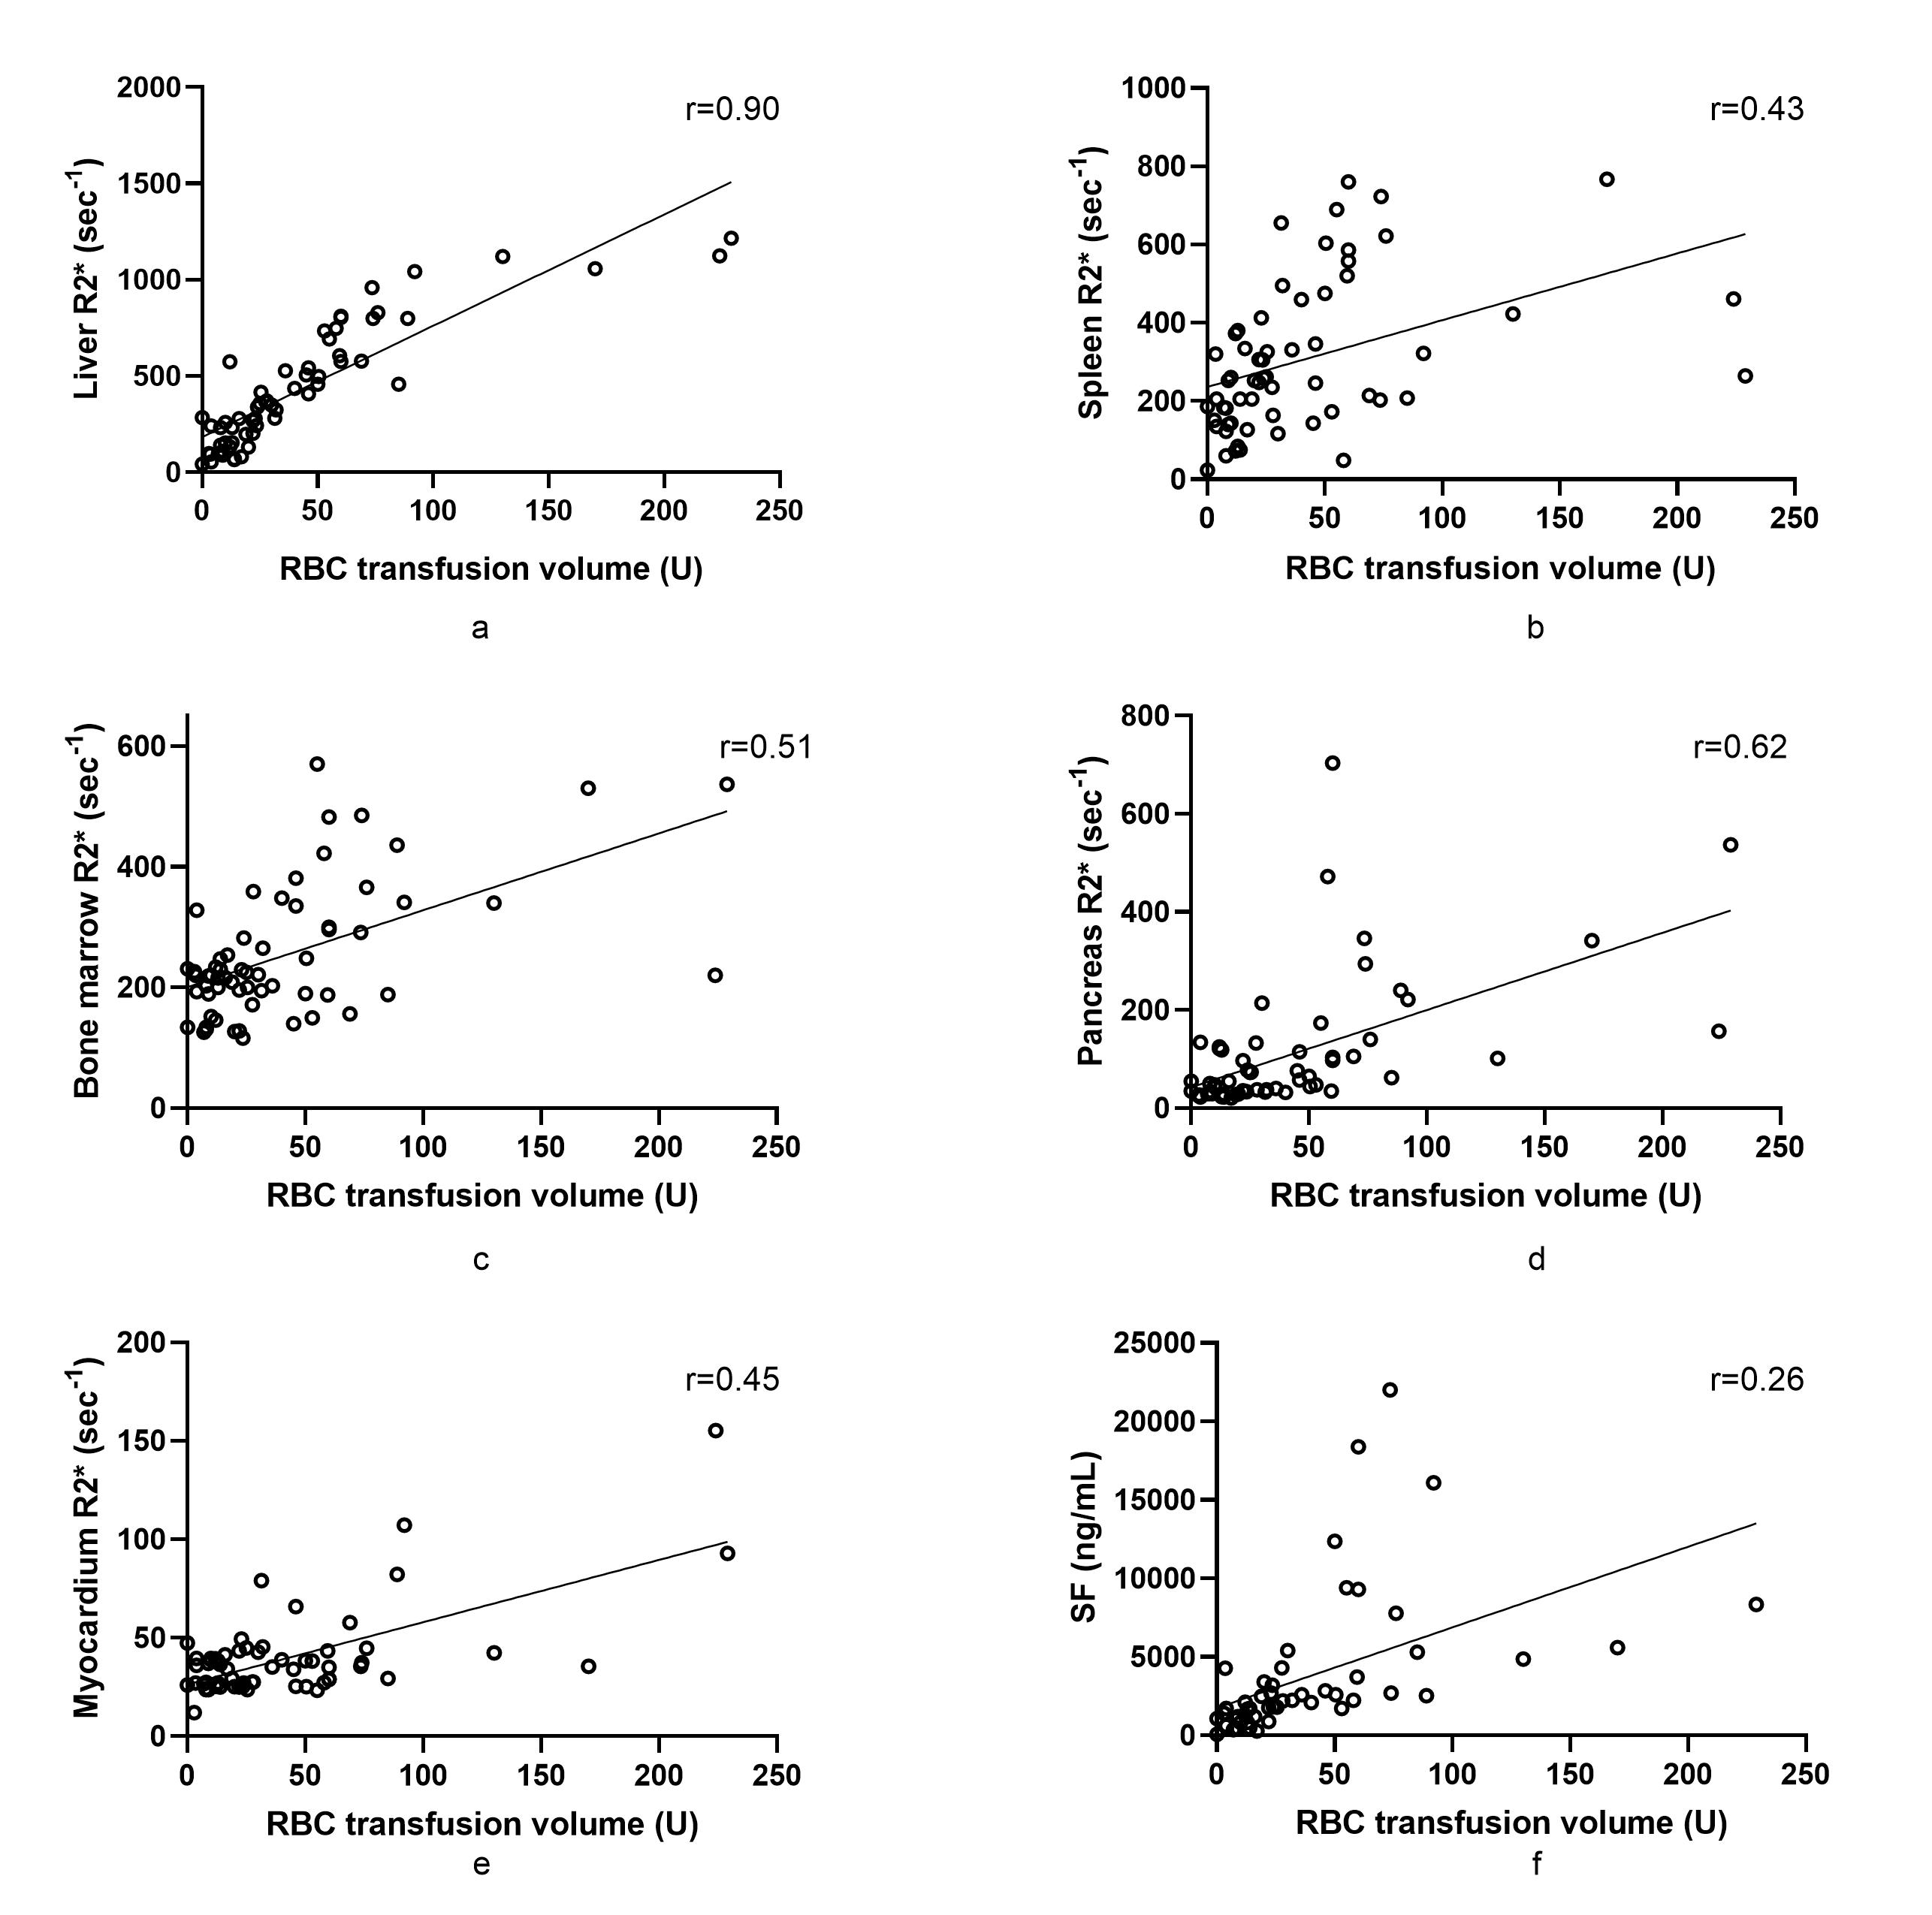
Of the 74 patients, 26(35.1%), 22(29.7%), and 14(18.9%) had mild, moderate, and severe liver iron overload, respectively. The mean R2* values for spleen, bone marrow and pancreas in HCs were (25.67±9.2), (115.7±9.07) and (29.03±11.24), respectively. The median of R2* values of spleen and bone marrow were increased in patients with various liver iron overload levels; abnormally elevated pancreatic R2* values were observed in the patients with moderate liver iron overload, and abnormally elevated myocardial R2* values were observed in patients with severe liver iron overload. (Figure 2). Overall, hepatic R2* values correlated moderately with splenic R2* values (r=0.49) and moderately with the values for bone marrow (r=0.58) and pancreas (r=0.51), but not with those for the myocardium. Bone marrow R2* values correlated weakly with splenic R2* values (r=0.32). Pancreatic R2* values correlated weakly with myocardial R2* values (r = 0.29). A very strong correlation was noted between hepatic R2* and total RBC transfusion volumes (r=0.90). A correlation between total RBC transfusion volume and other metrics of iron burden were also seen, including splenic R2*, marrow R2*, pancreatic R2*, cardiac R2*, and SF (r=0.43, 0.51, 0.62, 0.45, and 0.26, respectively) (Figure 3). SF levels correlated with liver R2* values (r=0.29) but not with those of any other organ. The RBC transfusion volumes for predicting mild, moderate, and severe liver iron deposition were 18, 34, and 60 U (respectively), with area under the curve (AUC) values of 0.822, 0.924, and 0.935.Discussion & Conclusions
Bone marrow and spleen iron deposition were seen early after transfusion. As iron deposition develops in the liver, iron overload develops in the pancreas and myocardium. Significant correlations were found between iron overload levels in the liver, bone marrow, and spleen, as expressed by respective R2* values. These results revealed the characteristics of iron distribution in patients with transfusion-dependent diseases. Furthermore, RBC transfusion volumes correlated with iron deposition in multiple organs, especially in the liver. Transfusion volumes could replace R2* values for predicting liver iron overload in patients with transfusion-dependent diseases.Acknowledgements
This study was supported by the Tianjin Research Innovation Project for Postgraduate Students (15KG134).References
1. Tahera AT, Saliba AN: Iron overload in thalassemia: different organs at different rates. Hematology 2014, the American Society of Hematology Education Program Book 2017;1:265-271.
2. Sheth S, Allen CJ, Farrell DE, Tripp JH, Jafari R, Wang Y, Brittenham GM: Measurement of the liver iron concentration in transfusional iron overload by MRI R2* and by high-transition-temperature superconducting magnetic susceptometry. Clin Imaging 2019;55:65-70.
3. Fernandes JL: MRI for Iron Overload in Thalassemia. Hematol Oncol Clin North Am 2018;32:277-295.
Figures
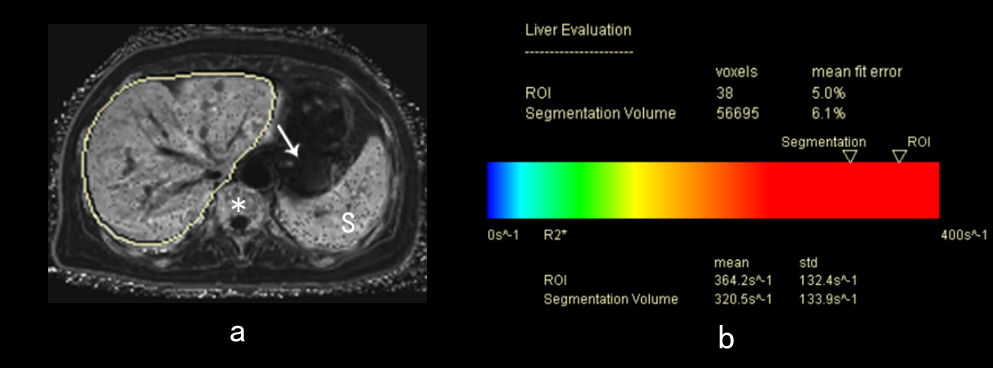
Figure 1. A 48-year-old female with myelodysplastic syndrome. (a) R2* maps show iron overload in the liver (liver segmentation contour, bone marrow (asterisk), and spleen (S). The pancreas (arrow) and myocardium (not shown) presented normal R2* values. SF levels: 2693 ng/mL, RBC transfusion volume: 28 U. (b) Report automatically generated for detecting liver iron overload.
SF, serum ferritin; RBC, red blood cell