4209
Evaluation of hepatic microenvironment in cirrhotic patients with collateral circulation by multiparametric MRI1Department of Radiology, the First Affiliated Hospital of Dalian Medical University, Dalian, China, 2Philips Healthcare, Beijing, China
Synopsis
Cirrhosis of the liver not only increases the risk of liver cancer but also causes portal hypertension, leading to gastrointestinal bleeding, hepatic encephalopathy, ascites, and other complications. The opening of collateral circulation caused by portal hypertension plays an important role in the occurrence and progress of diseases. Therefore, precise diagnosis of collateral circulation (CC) in cirrhotic patients is important for clinical practice. Hereby, we compared quantitative parameters from multiparametric MRI (4D flow, APT, IVIM, T1/T2 mapping) between the CC and non-CC groups in cirrhotic patients, which showed significant differences.
Introduction
Portal hypertension often occurs in patients with liver cirrhosis leading to the opening of collateral circulation (CC), which causes changes in intrahepatic blood flow and microenvironment in the liver[1]. The happening of CC will affect the treatment and prognosis of patients with liver cirrhosis. Therefore, precise diagnosis of CC in cirrhotic patients is important for clinical practice. Multiparametric MRI (mpMRI) such as 4D flow, APT, IVIM, T1/T2 mapping can evaluate the status of the liver with multiple quantitative parameters. 4D flow can obtain the quantitative value of portal blood flow directly[2]. APT imaging is usually to measure the protein content and pH of tissue, which reflects the metabolic process. T1/T2 mapping can determine the relaxation time of tissues and is sensitive to free water changes and fibrosis[4]. IVIM is a diffusion-based MRI method to provide both diffusion and perfusion information[5]. The purpose of this study is to evaluate the microenvironment in the liver of cirrhotic patients with portal hypertension by mpMRI.Materials and Methods
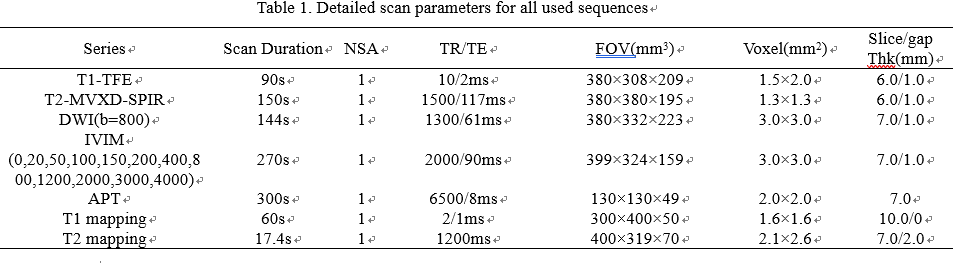
This study was approved by the institutional IRB. MRI data of 15 patients with clinically diagnosed liver cirrhosis in our hospital from January 2020 to October 2021 were retrospectively analyzed. All patients underwent epigastric MRI examination on a 3.0T MRI scanner using a 16-channel abdominal array coil (Ingenia CX, Philips Healthcare, Best, the Netherlands). The scanned MR protocols included T1WI, T2WI, DWI, IVIM, APT, T1/T2 mapping and 4D flow (axial, TR / TE = 5.0 / 3.2ms, FOV = 300 × 350 mm2, resolution = 2.5 × 2.5 × 2.5 mm3) for hemodynamic quantification. Other parameters were shown in Table 1. According to gastroscopy and imaging findings, patients with liver cirrhosis were divided into the normal group (8 patients) and collateral circulation group (7 patients). The acquired images were processed by a radiologist in CVI42. The proximal, middle, and distal planes of the portal vein and one plane of splenic vein confluence were taken as a reference plane to measure the flow parameters. The images from T1 mapping, T2 mapping, and APT were transferred to a post-processing workstation (Philips ISP10.0). The images from IVIM were processed using a GE workstation. Two physicians (both with more than 5 years of abdominal MRI diagnosis experience) independently draw ROI and measured the parameters. In both T1 mapping and T2 mapping images, the first hilar level was selected (the ROI was measured at the same level), and the long elliptical ROI was drawn in the left inner lobe, right anterior lobe, and right posterior lobe of the liver respectively. The long axis direction was consistent with the direction of the intrahepatic bile duct, and the size was about 300 mm2. The blood duct and bile duct were avoided as best as possible. The quantitative parameters of different groups were compared by the Mann-Whitney U test on SPSS 22.0 (IBM) platform.Results
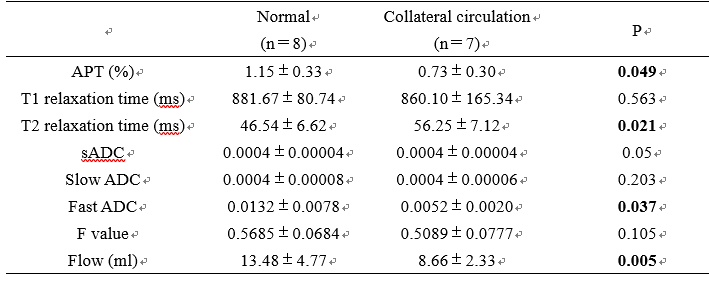
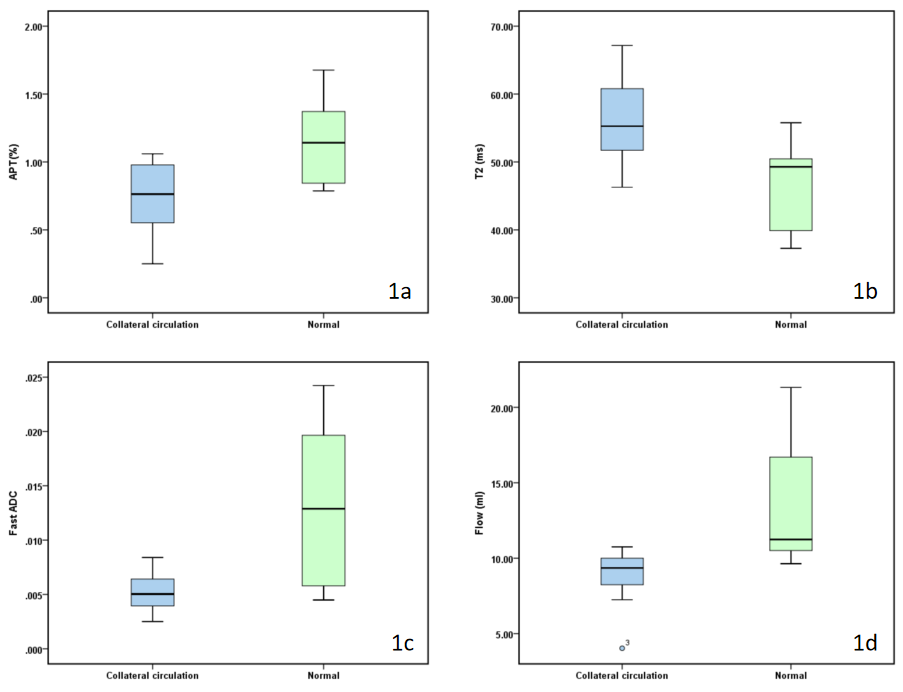
The values of APT, fast ADC and flow in the CC group were less than those in the non-CC group (P<0.05, table 2, figure 1), and the T2 relaxation time in the CC group are longer than those in the non-CC group (P<0.05, table 2, figure 1), while other quantitative parameters are not statistically significant (P > 0.05, table 2).Discussion and conclusion
In this study, we compared quantitative parameters from multiparametric MRI (4D flow, APT, IVIM, T1/T2 mapping) between the CC and non-CC groups in cirrhotic patients, which showed significant differences. Therefore, the opening of CC resulted from portal hypertension in patients with liver cirrhosis altered blood flow state, microcirculation perfusion, material exchange, and component transformation, etc. The mpMRI can provide abundant information on the microenvironment and status of the liver in patients with liver cirrhosis, which showed clinical potentials.Acknowledgements
No Acknowledgement.References
1. Møller S, Bendtsen F. The pathophysiology of arterial vasodilatation and hyperdynamic circulation in cirrhosis. Liver Int. 2018 Apr;38(4):570-580.
2. Bane O, Peti S, Wagner M, Hectors S, Dyvorne H, Markl M, Taouli B. Hemodynamic measurements with an abdominal 4D flow MRI sequence with spiral sampling and compressed sensing in patients with chronic liver disease. J Magn Reson Imaging. 2019 Apr;49(4):994-1005.
3. CHEN S Z,YUAN J,DENG M,et al.Chemical exchange saturation transfer (CEST) MR technique for in-vivo liver imaging at 3.0 Tesla. Eur Radiol, 2016, 26(6): 1972-1800.
4. Hoffman DH, Ayoola A, Nickel D, Han F, Chandarana H, Shanbhogue KP. T1 mapping, T2 mapping and MR elastography of the liver for detection and staging of liver fibrosis. Abdom Radiol (NY). 2020 Mar;45(3):692-700.
5. Chen F, Chen YL, Chen TW, Li R, Pu Y, Zhang XM, Li HJ, Tang S, Cao JM, Yang JQ. Liver lobe based intravoxel incoherent motion diffusion weighted imaging in hepatitis B related cirrhosis: Association with child-pugh class and esophageal and gastric fundic varices. Medicine (Baltimore). 2020 Jan;99(2):e18671.
Figures