4206
Comparative Study of histogram analysis of Intravoxel Incoherent Motion and Diffusion Kurtosis Imaging for the staging of liver fibrosis1Department of Magnetic Resonance, Lanzhou University Second Hospital, Lanzhou, China, 2GE Healthcare, Shanghai, China
Synopsis
The purpose of this study is to compare the diagnostic accuracy of histogram analysis–derived parameters from intravoxel incoherent motion (IVIM) and diffusion kurtosis imaging (DKI) for staging of liver fibrosis (LF). The correlations between different histopathologic stages and histogram parameters were determined. The results showed that the histogram metrics of DKI maps demonstrate significant correlation with fibrosis stage, while there was no correlation between histogram metrics of IVIM and fibrosis stage. In conclusion, histogram analysis of DKI may serve as a valuable and robust tool for the staging of LF.
Introduction and purpose
Liver fibrosis (LF) was viewed as a reversible process if optimal management is started timely [1]. Although liver biopsy is the current reference standard for staging LF, it has limitations, such as invasive, sampling errors and a series of complications. Diffusion-weighted imaging (DWI) is a specific functional MRI technique based on the principles of random thermal diffusion of small molecules, makes the non-invasive evaluation of LF feasible [2]. Actually, in biological tissues, water diffusion is restricted by the presence of barriers and compartments, leading to a non-Gaussian distribution. Therefore, non-Gaussian diffusion models have been introduced for the study of DWI, such as intravoxel incoherent motion (IVIM) and diffusion kurtosis imaging (DKI) [3]. Histogram analysis provides multiple parameters reflects the subtle microscopic changes that are not detectable by the human eye in the early pathological stages. Our study aims to assess the histogram analysis of IVIM and DKI for evaluating fibrosis as a comparison.Materials and Methods
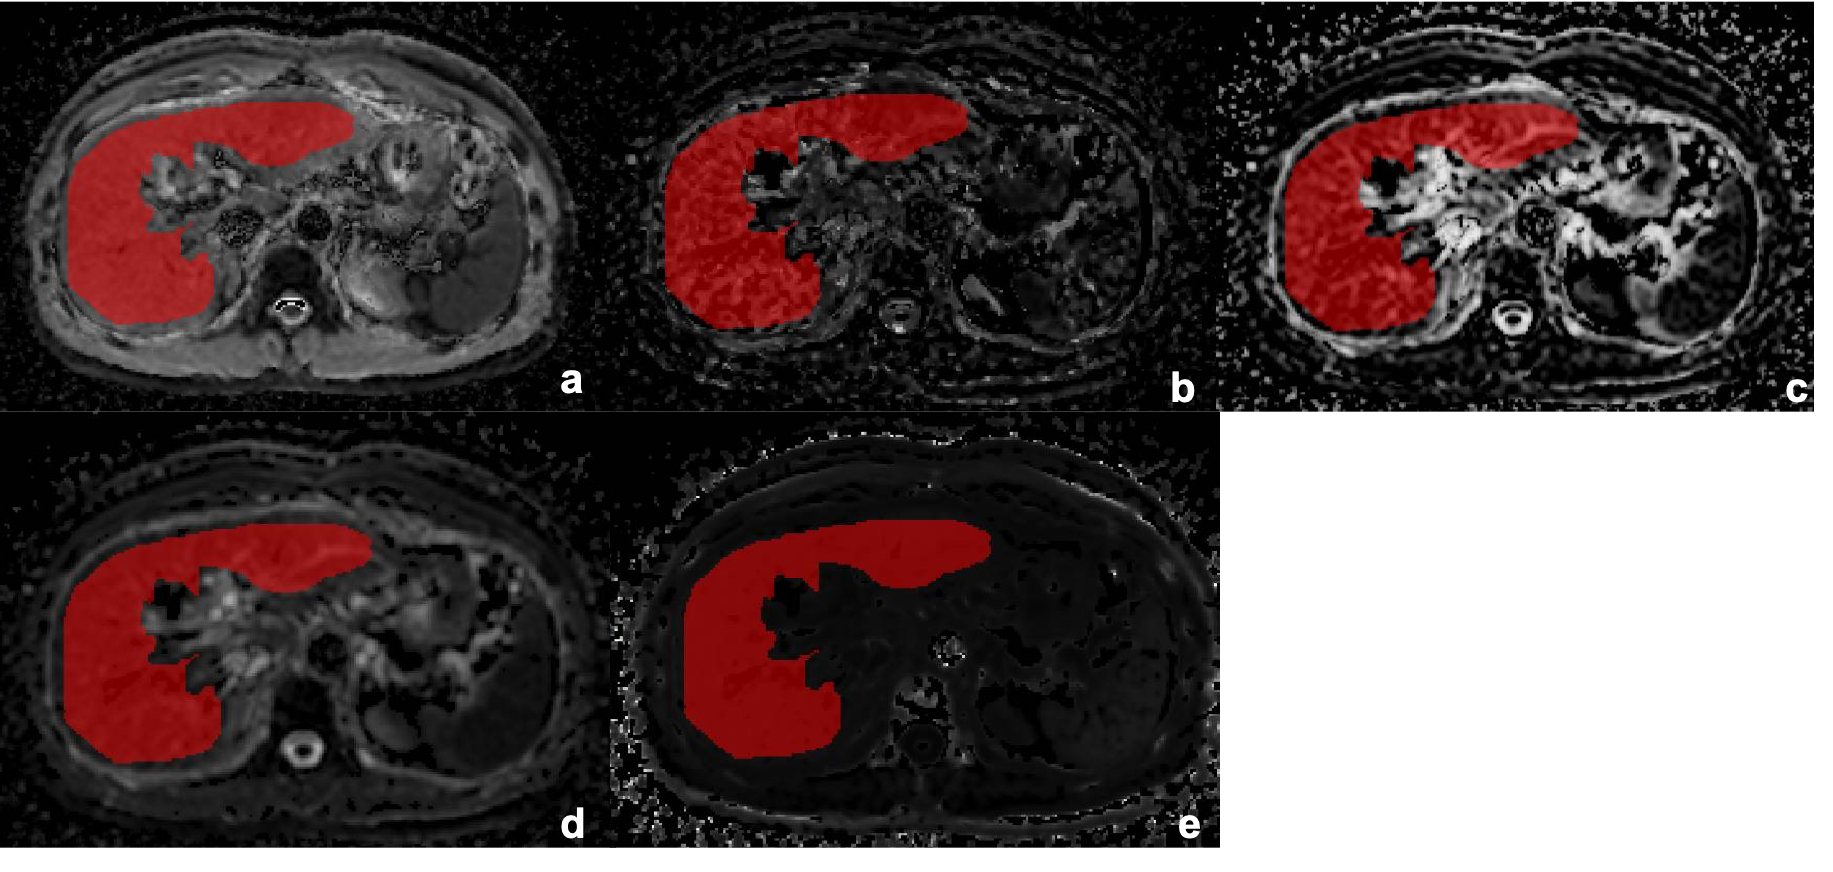
Twenty-nine patients with chronic liver diseases were reclassified as three groups: mild fibrosis (F1, n=10), moderate fibrosis (F2, n=10) and advanced fibrosis (F3-4, n=9). MRI was performed using a 1.5T scanner (Aera, Siemens Healthcare, Erlangen, Germany). DWI was acquired using a single-shot echo-planar imaging sequence in the axial orientation. The detailed parameters were as follows: TR/TE =6800/58ms, FOV=304×380mm2, scan matrix=108×134, slice thickness=6mm, the total of acquisition time was approximately 10 min12sec. Then different b values were selected for IVIM and DKI post-processing respectively. The b-values of IVIM included 0, 50, 100, 150, 200, 400, 600, 800 s/mm2, the b-values of DKI included 0, 200, 400, 600, 800, 1000, 1200 s/mm2. The diffusion coefficient (D), pseudo-diffusion coefficient (D*), perfusion fraction (f), mean diffusion (MD), and mean kurtosis (MK) values were calculated by using the prototype post-processing software Body Diffusion Toolbox (Siemens, Erlangen, Germany). Regions of interests (ROIs) were manually drawn covering the whole liver parenchyma on axial images (Figure 1). Histogram metrics, including the 10th, 90th Percentile, Energy, Entropy, Interquartile (Iq) Range, Kurtosis, Maximum (Max), Mean Absolute Deviation (MAD), Mean, Median, Minimum (Min), Range, Skewness, Uniformity, Variance were generated for the related parameter maps (D, f, D*, MD and MK maps). The correlation between different fibrosis stage groups and histogram metrics was determined through Spearman correlation coefficients. For significant parameters, receivers operating characteristic curve (ROC) analyses were further performed for identifying significant LF (≥F2) and advanced LF (≥F3 stage). Areas under the ROC curve (AUCs) were compared between histogram metrics using the Delong test.Results
Correlations between the histogram metrics of D, D*, f, MD, MK maps and the fibrosis stage are presented in Table 1 and 2. For D, D* and f maps, there was no correlation between histogram parameters and fibrosis stage (all P > 0.05). Entropy, uniformity of MD map, entropy, kurtosis, Max, MAD, range, variance of MK map demonstrated moderate correlations with the fibrosis stage (r = -0.403 to 0.489, p < 0.001 to p=0.002). 10Percentile, Iq Range, MAD, variance of MD map, 90Percentile, Iq Range, skewness, uniformity of MK map demonstrated weak correlations with the fibrosis stage (r = -0.363 to 0.373, p=0.005 to 0.017). The AUCs of histogram metrics moderately correlating with fibrosis as well as the optimal cutoff values along with the corresponding AUC, sensitivity, specificity are showed in Table 3. For F ≥ 2, the largest AUC was 0.737 (entropy) for MD map, although no significant differences existed in any pairwise comparisons (p = 0.127 to 1.000). For F≥ 3, the largest AUC was 0.815 (Max) for MK map, although differences between the AUCs were not statistically significant for any pairwise comparison (p = 0.288 to 1.000).Discussion
Our study demonstrated that histogram metrics for DKI can be a valuable biomarker for the quantitative assessment of LF, with good performance for identifying degree of fibrosis. However, histogram analysis of liver IVIM was not able of separating fibrotic livers into different severity groups. It is possible that IVIM allows evaluate the perfusion-related diffusivity(PD) status of liver, rather than the histological structure and collagen deposition of fibrotic liver, PD measurements of some fibrotic livers are not uncommon in the normal range, especially in the presence of significant inflammation[4].Conclusion
Histogram analysis of DKI outperformed IVIM in detecting various stages in LF, and may serve as a valuable and robust tool for the staging of LF.Acknowledgements
No acknowledgement found.References
[1] Campana L, Iredale J P. Regression of Liver Fibrosis[J]. Semin Liver Dis, 2017, 37(1): 1-10.
[2] Besheer T, Elalfy H, Abd El-Maksoud M, et al. Diffusion-weighted magnetic resonance imaging and micro-RNA in the diagnosis of hepatic fibrosis in chronic hepatitis C virus[J]. World J Gastroenterol, 2019, 25(11): 1366-1377.
[3] Jensen J H, Helpern J A. MRI quantification of non-Gaussian water diffusion by kurtosis analysis[J]. NMR Biomed, 2010, 23(7): 698-710.
[4] Li T, Che-Nordin N, Wáng Y X J, et al. Intravoxel incoherent motion derived liver perfusion/diffusion readouts can be reliable biomarker for the detection of viral hepatitis B induced liver fibrosis[J]. Quant Imaging Med Surg, 2019, 9(3): 371-385.
Figures