4204
Application of native T1 mapping for distinguishing histopathologic subtypes, grades, and stages of rectal adenocarcinoma1Department of MRI, The First Affiliated Hospital of Zhengzhou University, Zhengzhou, China, 2MR Application Predevelopment, Siemens Healthcare GmbH, Erlangen, Germany, 3MR collaboration, Siemens Healthcare Ltd., Beijing, China
Synopsis
This study evaluated the clinical significance of using native T1 mapping for distinguishing histopathologic subtypes, grades, and stage of rectal adenocarcinoma by measuring parameters such as T1 relaxation time and apparent diffusion coefficient (ADC). The results showed that T1 and ADC values were significantly higher in rectal mucinous adenocarcinoma (MC) compared to non-mucinous rectal adenocarcinoma (AC). In the AC group, T1 values were significantly lower in the low-grade AC than in the high-grade AC. Our findings suggest that native T1 mapping can distinguish histopathologic subtypes of renal adenocarcinoma. Moreover, T1 values distinguish different grades of AC more accurately than ADC values.
Introduction
Colorectal cancer is a common malignancy of the digestive tract. The overall therapeutic efficacy of rectal cancer is associated with factors, such as histologic grades, tumor types, and pathologic T and N stages [1]. Magnetic resonance imaging (MRI) is the first choice imaging modality for preoperative diagnosis and staging of rectal cancer. In recent years, technological advances in functional MRI (fMRI), especially diffusion-weighted imaging (DWI), have resulted in its widespread use in tumor staging as well as therapeutic response prediction and assessment of patients with rectal cancer [2]. T1 mapping is a quantitative and noninvasive technique for measuring longitudinal relaxation time (T1), which is used to estimate quantitative changes in tissue structure and composition [3, 4]. In this study, we used T1 mapping for determining the subtypes, grades, and stages of rectal adenocarcinoma patients. We also estimated reference T1 and ADC values that can be used for clinical evaluation of rectal adenocarcinoma patients.Methods
We enrolled 148 patients with histopathologically confirmed rectal cancer in this study. The MAGNETOM Prisma 3T MRI system (Siemens Healthcare, Erlangen, Germany) was used to acquire oblique axial T2W turbo spin-echo (TSE), axial DWI, and prototypic T1 mapping sequences. DWI was performed using a single-shot echo plane imaging (ss-EPI) sequence with two b-values (50 and 800 s/mm2). The DWI parameters were as follows: TR/TE = 4050/48 ms; FOV = 300×225 mm2; slice thickness = 3 mm; matrix = 168×126; parallel imaging factor = 2; and acquisition time = 3 min 28 sec. The T1 map was acquired using the prototypic inversion recovery snapshot FLASH sequence (Siemens Healthcare, Erlangen, Germany), which continuously acquired 16 FLASH contrast images after a 180° inversion pulse. The T1 mapping parameters were as follows: TR/TE = 3/1.32 ms; FOV = 380×308 mm2; slice thickness = 4 mm; matrix = 192×125; parallel imaging factor = 2; and acquisition time = 1 min 32 sec. The apparent diffusion coefficient (ADC) maps and T1 parametric maps were both generated inline during data acquisition. T1 and ADC values were used to distinguish rectal mucinous adenocarcinoma (MC) and non-mucinous rectal adenocarcinoma (AC) patients. T1 and ADC values were also used to determine the grades and stages of individual rectal adenocarcinoma patients. Diagnostic performances of T1 and ADC values were evaluated using receiver operating characteristic (ROC) curves. P<0.05 was considered statistically significant.Results
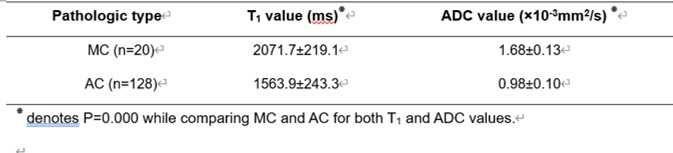
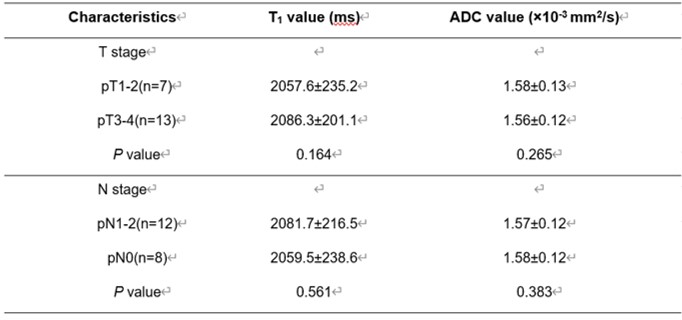
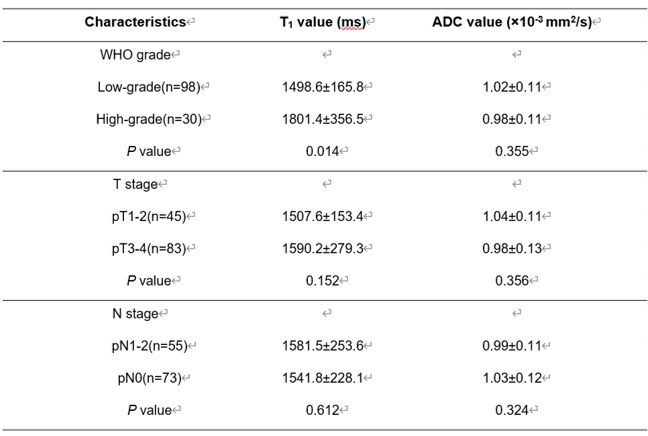
T1 and ADC values for the rectal mucinous adenocarcinoma (MC) group were significantly higher compared to the non-mucinous rectal adenocarcinoma (AC) group (T1: 2071.7±219.1 ms vs. 1563.9±243.3 ms; ADC: 1.68±0.13×10⁻³mm2/s vs. 0.98±0.10×10⁻³mm2/s; P<0.001; Table 1). AUC values were 0.916 and 0.911 for T1 and ADC values, respectively, in distinguishing MC and AC. T1 values for the low-grade adenocarcinoma group were significantly lower compared to the high-grade adenocarcinoma group (1498.6±165.8 ms vs. 1801.4±356.5 ms; P<0.05), but ADC values for both groups were similar (1.02±0.11×10⁻³ mm2/s vs. 0.98±0.11×10⁻³mm2/s; P>0.05). The AUC value for distinguishing low-grade and high-grade adenocarcinomas was 0.731 with 91.8% sensitivity and 66.7% specificity. The MRI images of representative MC and AC patients are shown in Figures 1 and 2, respectively. The comparative T1 and ADC values between early- and late-stage, as well as pN1-2 and pN0 groups, were statistically similar for both MC and AC patients (all P>0.05; Tables 2&3).Discussion
In this study, we evaluated the feasibility of using native T1 mapping combined with DWI and T2W MRI to accurately determine the histopathologic types, grades, and stages of rectal adenocarcinoma. Our results showed that T1 and ADC values for MC cases varied significantly from AC cases. T1 values also demonstrated greater diagnostic ability than ADC values in distinguishing high-grade AC from low-grade AC. This suggested that the pathologic grades and degree of tumor cell malignancy in rectal cancer can be accurately determined using T1 values. However, T1 and ADC values of early- and late-stage rectal adenocarcinoma cases were statistically similar. This suggested that tumor microenvironments were indistinguishable in rectal adenocarcinoma cases belonging to different T stages [5]. Furthermore, T1 values of the pN1-2 stages were higher compared to the pN0 stage, and ADC values of the pN1-2 stages were lower than the pN0 stage. However, these differences were not statistically significant. Overall, our results suggest that further investigations are necessary to determine the significance of T1 values in predicting lymph node metastasis in rectal cancer.Conclusions
Our study demonstrates that native T1 mapping accurately distinguishes MC from AC based on both T1 and ADC values. Moreover, low- and high-grade AC can be distinguished using T1 values.Acknowledgements
We sincerely thank all the study participants.References
1. Curvo-Semedo L. Rectal Cancer: staging. Magn Reson Imaging Clin N Am 2020; 28:105-115. 2. Schurink NW, Lambregts DMJ, Beets-Tan RGH. Diffusion-weighted imaging in rectal cancer: current applications and future perspectives. Br J Radiol 2019; 92:20180655. 3. Taylor AJ, Salerno M, Dharmakumar R, et al. T1 Mapping: basic techniques and clinical applications. JACC Cardiovasc Imaging 2016; 9:67-81. 4. Fernandes JL, Rochitte CE. T1 mapping: technique and applications. Magn Reson Imaging Clin N Am 2015; 23:25-34. 5. Zhu L, Pan Z, Ma Q, et al. Diffusion kurtosis imaging study of rectal adenocarcinoma associated with histopathologic prognostic factors: preliminary findings. Radiology 2017; 284:66-76.Figures
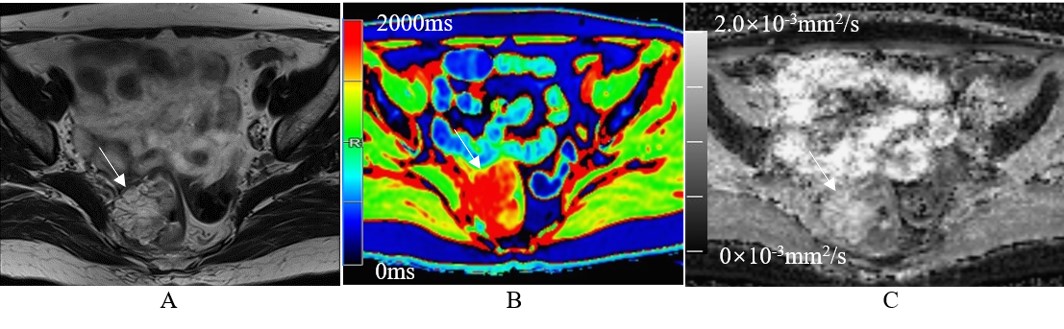
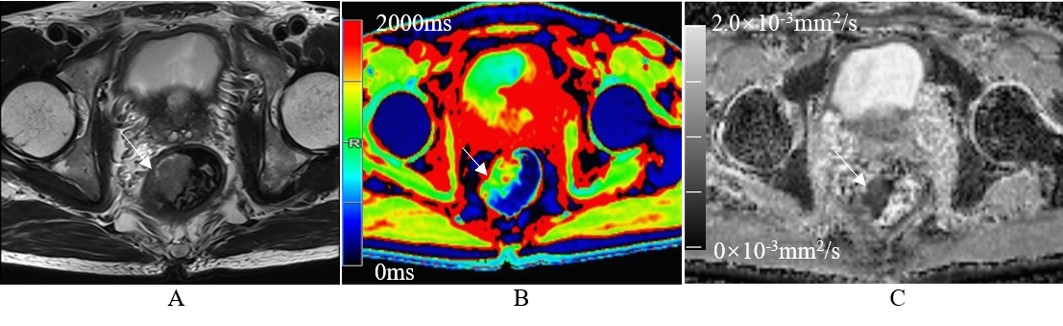
Fig.1. A 60-year-old female with mucinous adenocarcinoma. (A) The representative oblique axial T2-weighted image shows very high-intensity signals for the tumor mass in the rectum. (B) The color-coded T1 map shows tumor mass with very high-intensity signal (red) and a T1 value of 1840.0 ms. (C) The ADC map shows tumor mass with an ADC value of 1.92×10⁻³mm2/s.